ABSTRACT
-
Objective
Melatonin plays an important role in metabolic regulation and has been suggested to influence adipose tissue function through the modulation of leptin and adiponectin. However, evidence from randomized controlled trials (RCTs) on the effects of melatonin supplementation on these adipokines is inconsistent.
-
Methods
In this systematic review and meta-analysis, we searched PubMed, Web of Science, Scopus, and Google Scholar for RCTs on this topic published up to July 2025. We calculated weighted mean differences (WMDs) using random-effects models to identify net changes in risk factors.
-
Results
Our search yielded nine RCTs (with 11 arms). We found that melatonin supplementation had no significant effects on serum leptin (WMD, 0.172 ng/mL; 95% confidence interval [CI], −2.15 to 2.50; n=11) or adiponectin (WMD, 1.432 µg/mL; 95% CI, −0.112 to 2.976; n=7) levels.
-
Conclusion
This meta-analysis showed that melatonin supplementation does not significantly affect serum leptin and adiponectin levels. However, further studies are needed to confirm this.
-
Keywords: Adipokines; Adiponectin; Leptin; Melatonin
INTRODUCTION
Melatonin (N-acetyl-5-methoxytryptamine) is an indoleamine hormone produced rhythmically by the pineal gland and controlled by the suprachiasmatic nucleus. It acts primarily through the G-protein–coupled MT1 and MT2 receptors to regulate the circadian rhythm, immune response, endocrine activity, and energy balance [
1,
2]. There is growing evidence that melatonin also plays an important role in metabolic regulation, influencing insulin secretion and sensitivity, as well as glucose and lipid metabolism in adipose tissue [
3-
5]. The interplay between melatonin and adipocyte-derived cytokines, particularly leptin and adiponectin, has garnered research attention. Chronobiological studies indicate that melatonin may modulate their secretion and contribute to metabolic homeostasis [
6,
7]. These effects suggest that melatonin may have potential as a therapeutic agent for metabolic disorders such as obesity, type 2 diabetes, and metabolic syndrome [
8].
Leptin and adiponectin are major adipokines produced by adipose tissue. They play essential roles in energy regulation, insulin sensitivity, and inflammation [
6]. Dysregulation of these hormones is closely linked to the development of obesity-related metabolic disturbances [
6,
9]. Leptin resistance impairs appetite regulation and promotes excess fat accumulation. Decreased adiponectin levels are associated with insulin resistance, chronic low-grade inflammation, and elevated cardiovascular risk [
6,
10]. Given their fundamental importance in metabolic regulation, therapeutic strategies that modulate leptin or adiponectin would have significant clinical implications.
Experimental and clinical studies suggest that melatonin may affect adipose tissue function by modulating adipokine secretion, improving oxidative stress, suppressing pro-inflammatory pathways, and contributing to the circadian regulation of metabolic processes [
7,
11,
12]. Nevertheless, the findings of randomized controlled trials (RCTs) on the effects of melatonin supplementation on circulating levels of leptin and adiponectin have been inconsistent. These inconsistencies likely reflect the between-study heterogeneity in study populations, melatonin dose, intervention durations, outcome measures, and participant characteristics, including baseline metabolic status [
13]. To address this, we conducted a systematic review and meta-analysis of RCTs evaluating the impact of melatonin supplementation on plasma leptin and adiponectin concentrations. We used the Grading of Recommendations, Assessment, Development, and Evaluation (GRADE) framework to provide a transparent and rigorous assessment of the quality, robustness, and certainty of the available evidence.
METHODS
Ethics statement
Ethical approval was not required for this study because it was based on data from previously published studies.
Search strategy
This meta-analysis was designed and reported in line with Preferred Reporting Items for Systematic Reviews and Meta-Analyses (PRISMA) guidelines to ensure clarity and methodological integrity. We performed a systematic literature search on three major databases: PubMed, Scopus, and Web of Science. We also performed a manual search on Google Scholar. We used the population, intervention, comparator, outcome, and study design (PICOS) framework to formulate our search strategy, which included Medical Subject Headings and relevant keywords. The defined components were as follows: adult human participants (population), melatonin administration (intervention), placebo treatment (comparator), leptin and adiponectin levels (outcomes), and clinical trial design (study type) (
Table S1). Details of the search strategies for each database are provided in
Table S2. Eligible studies included RCTs published in English before August 2025 that examined the effects of melatonin on adipokine-related outcomes. In addition to the database searches, we also manually screened the reference lists of selected articles and relevant review papers to identify any additional studies. Two reviewers (MM and VH) independently assessed the eligibility of each article, and any disagreements were resolved through consultation with a third reviewer (SH). To capture newly published studies beyond the initial search period, we activated a PubMed email alert. The study protocol was prospectively registered with PROSPERO (Reg. no. CRD420251208093).
The inclusion criteria for this review were: (1) controlled trials with either a parallel or crossover design; (2) reported measurements of leptin and adiponectin at baseline and end of intervention in both intervention and control groups; (3) appropriately controlled control and intervention groups in which the only difference is the melatonin intervention; (4) an intervention duration of at least 2 weeks; and (5) adult participants aged ≥18 years. Studies that did not meet these eligibility criteria were excluded.
Data extraction
Two researchers (MM and VH) independently screened eligible RCTs and extracted relevant data using a standardized electronic form. For each study, the key data were recorded, including the name of the first author, publication year, country of origin, study design, sample size per group, participant demographics (age, sex, and body mass index), and intervention dose and duration of the intervention. In studies with multiple control arms, each control group was reviewed and analyzed separately to ensure accurate comparisons.
Quality assessment
We systematically evaluated the risk of bias in each study using the Cochrane Risk-of-Bias tool for RCTs [
14]. This assesses seven key domains for associated types of bias: random sequence generation and allocation concealment (selection bias), blinding of participants and study personnel (performance bias), blinding of outcome assessors (detection bias), completeness of outcome data (attrition bias), selective reporting of outcomes (reporting bias), and any other potential sources of bias. The risk of bias in each domain is rated as having a low, high, or unclear risk of bias based on the information provided in the original publications.
Intervention effects were expressed as weighted mean differences (WMDs) with corresponding 95% confidence intervals (CIs). These differences were calculated based on net changes from the baseline values of the adipokines. When standard deviations (SDs) of change were not reported, they were estimated using the following formula:
, assuming a moderate correlation coefficient (R) of 0.5 [
15]. When outcomes were reported as medians and interquartile ranges (IQRs), the mean and SD were estimated using established conversion methods [
16]. To approximate the minimum and maximum values from IQRs, we applied the following equations:
A = median + 2 ⋅ (Q3 − median)
B = median − 2 ⋅ (median − Q1)
where A and B represent the upper and lower bounds, and Q1 and Q3 denote the first and third quartiles, respectively. When standard errors (SEs) were provided, the SDs were derived using the formula SD = SE⋅√n, with n denoting the sample size per group. In studies that presented outcomes in graphical formats only, we extracted the data using Plot Digitizer software.
Study heterogeneity was assessed using Cochran’s Q test (significance threshold: P<0.1) and quantified with the I² statistic. Values ≥50% were considered indicative of substantial heterogeneity. We employed a random-effects model to calculate pooled effect sizes. We performed sensitivity analyses using the leave-one-out approach, whereby each study was sequentially excluded to evaluate its influence on the overall findings and heterogeneity. We examined potential publication bias using funnel plot visualization, Begg’s rank correlation, and Egger’s regression test. To adjust for bias, we applied Duval and Tweedie’s trim-and-fill method and the fail-safe N technique. To explore potential sources of variation in outcomes, subgroup analyses were performed based on body mass index (BMI; ≥30 kg/m² vs. <30 kg/m²), intervention duration, and dosage. All statistical analyses were conducted using Comprehensive Meta-Analysis software, version 3 (Biostat). Statistical significance was defined as P<0.05.
RESULTS
Study selection and characteristics
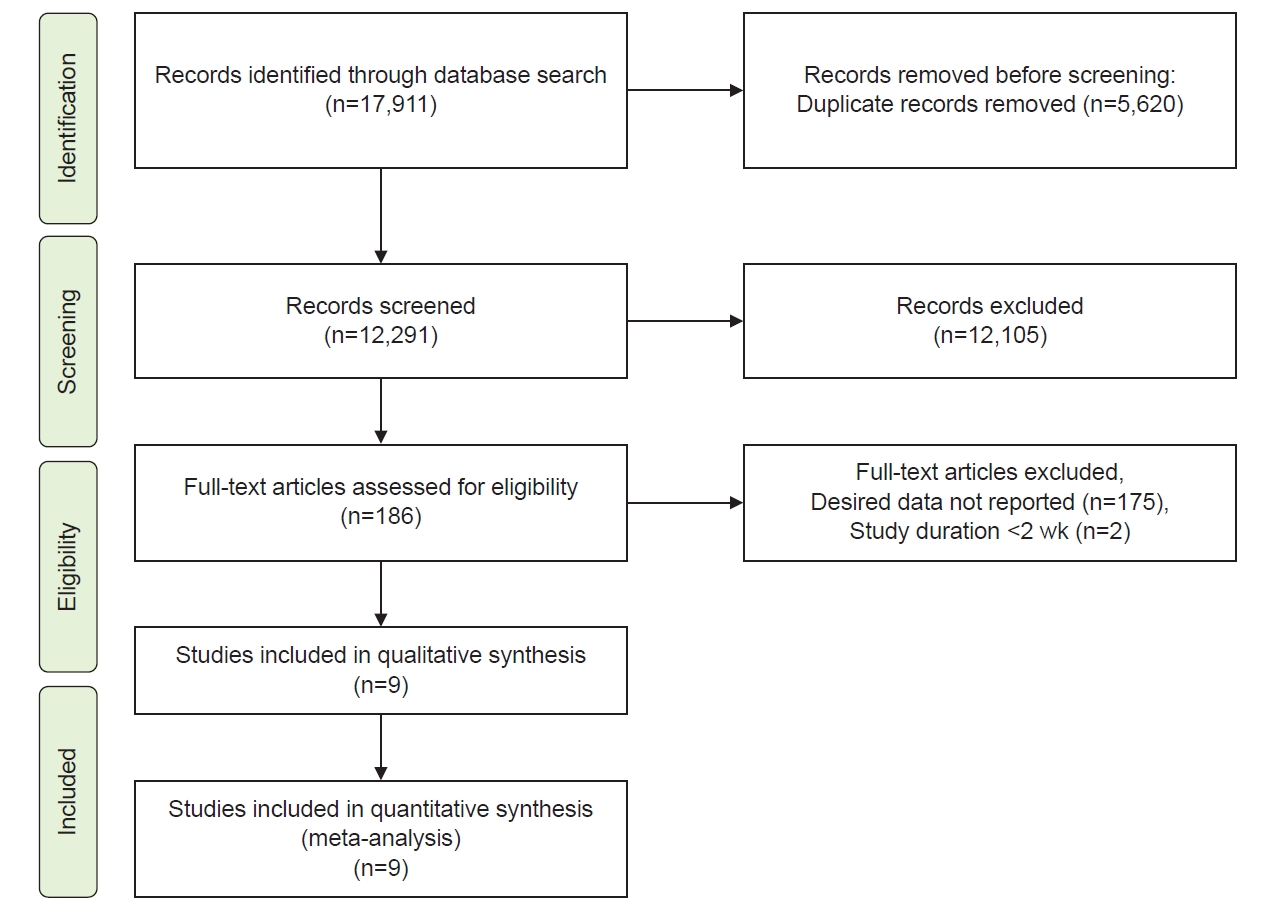
Our initial literature search identified a total of 17,911 publications (
Fig. 1). After removing duplicates and screening of titles and abstracts, 186 studies were retained. Following the full text assessment, 177 of these were excluded, leaving nine studies for inclusion in the final analysis.
The key characteristics of the nine eligible studies are summarized in
Table 1 [
7,
13,
17-
23]. Four of the studies were conducted in Iran, two in Denmark, two in Poland, and one in Iraq. One study employed a randomized crossover design, another used a three-arm randomized parallel design, and the remaining studies followed a randomized parallel design. Four studies enrolled only female participants, one included only male participants, and the remaining studies included both sexes. The durations of the interventions ranged from 4 to 48 weeks. Melatonin was provided in daily doses ranging from 3 to 10 mg. The final pooled analysis included 467 participants, of whom 242 received melatonin, and 225 served as controls (
Table 1). Participants were aged 25.5–65 years, with BMIs of 23.6–40.24 kg/m². There was noticeable diversity in the health status of the included populations, ranging from generally healthy participants to those with specific metabolic disorders (
Table 1).
Our Cochrane Risk-of-Bias assessment found that most (six) of the included studies were of high quality, with a low overall risk of bias. Three studies were classified as moderate quality (
Table S3).
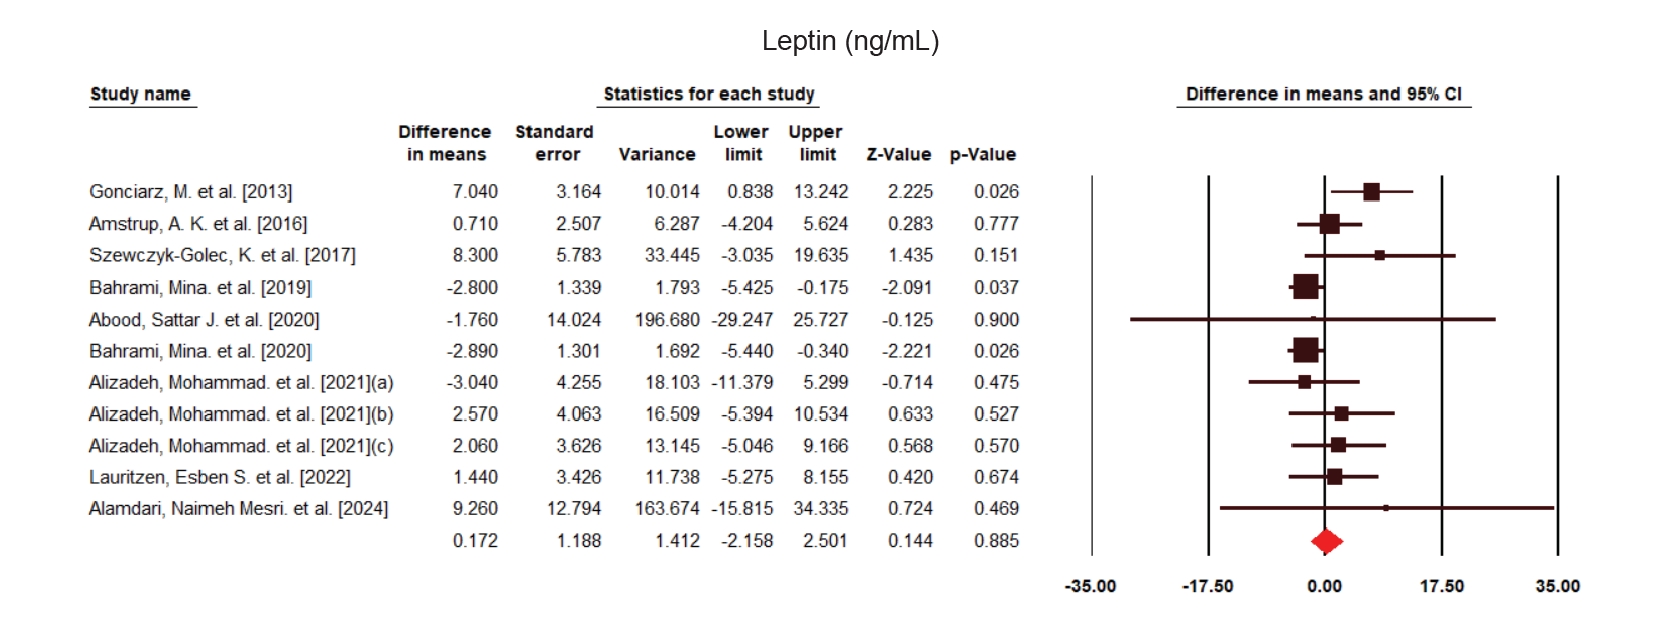
Our meta-analysis found that melatonin supplementation had no significant effect on circulating leptin levels (WMD=0.172 ng/mL, 95% CI −2.158 to 2.501, P=0.885, I
2 =38.55%, heterogeneity P=0.092, n=11) (
Fig. 2). The effect size for melatonin’s impact on leptin remained robust in the leave-one-out sensitivity analysis. Thus, the exclusion of any single trial did not significantly alter the overall findings (
Figs. S1 and
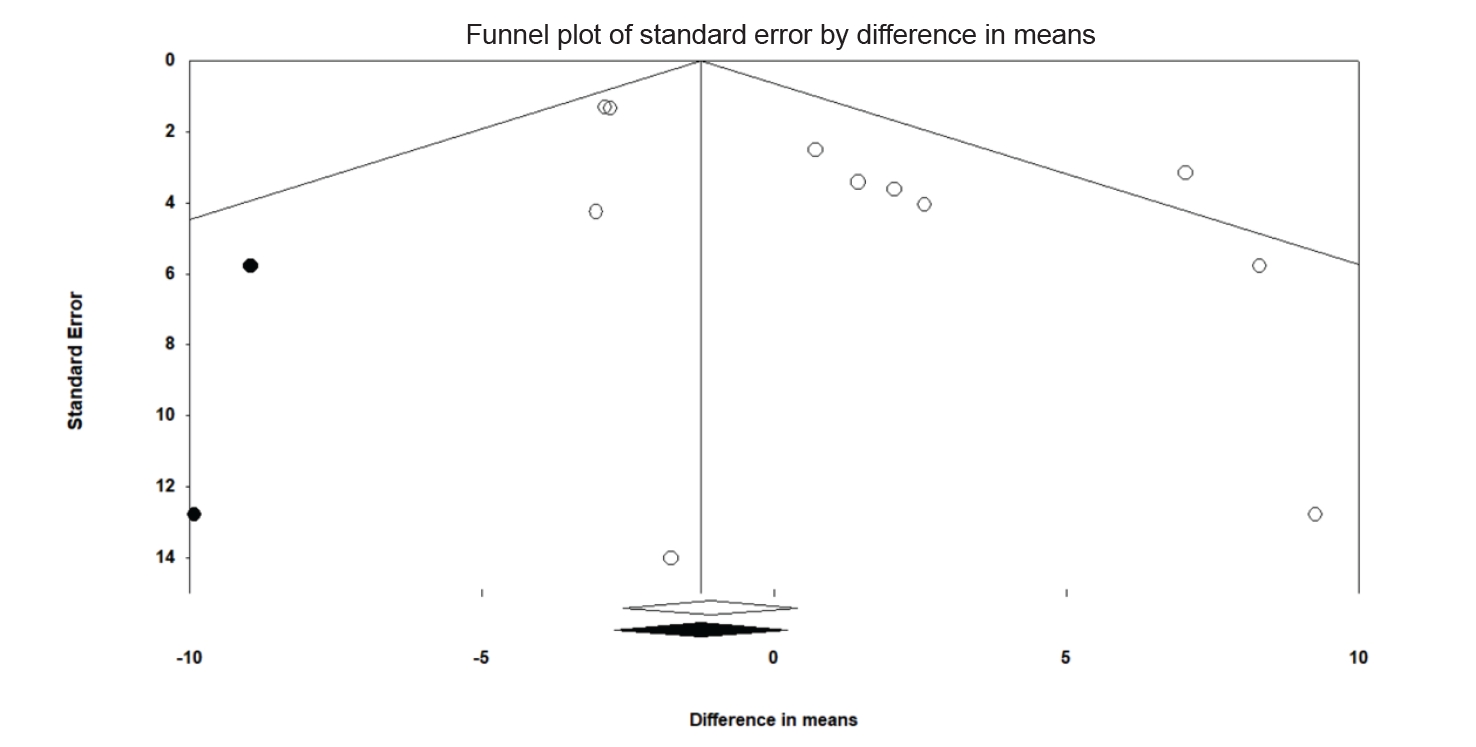
S2). Our funnel plot showed evidence of asymmetry between articles (
Fig. 3). While Begg’s test found no evidence of publication bias (P=0.27), Egger’s test revealed significant publication bias (P=0.02) for the effect of melatonin on leptin. The corrected WMD, derived through the trim-and-fill method, is presented in the funnel plot and
Table 2. Our subgroup analyses for the effect of melatonin on leptin found no difference between participants with BMIs above and below 30. However, when we stratified interventions by study duration, we found significant increases in leptin levels in those lasting <10 weeks (P=0.044). Trials with durations >10 weeks demonstrated significant reductions in leptin concentrations (P=0.010). In our dose-based subgroup analyses, melatonin supplementation at a dose of 10 mg significantly increased serum leptin levels (P=0.023), whereas doses below 10 mg significantly decreased serum leptin levels (P=0.016). The specific doses administered in each study are presented in
Table 1.
Details of the subgroup findings are presented in
Table 3.
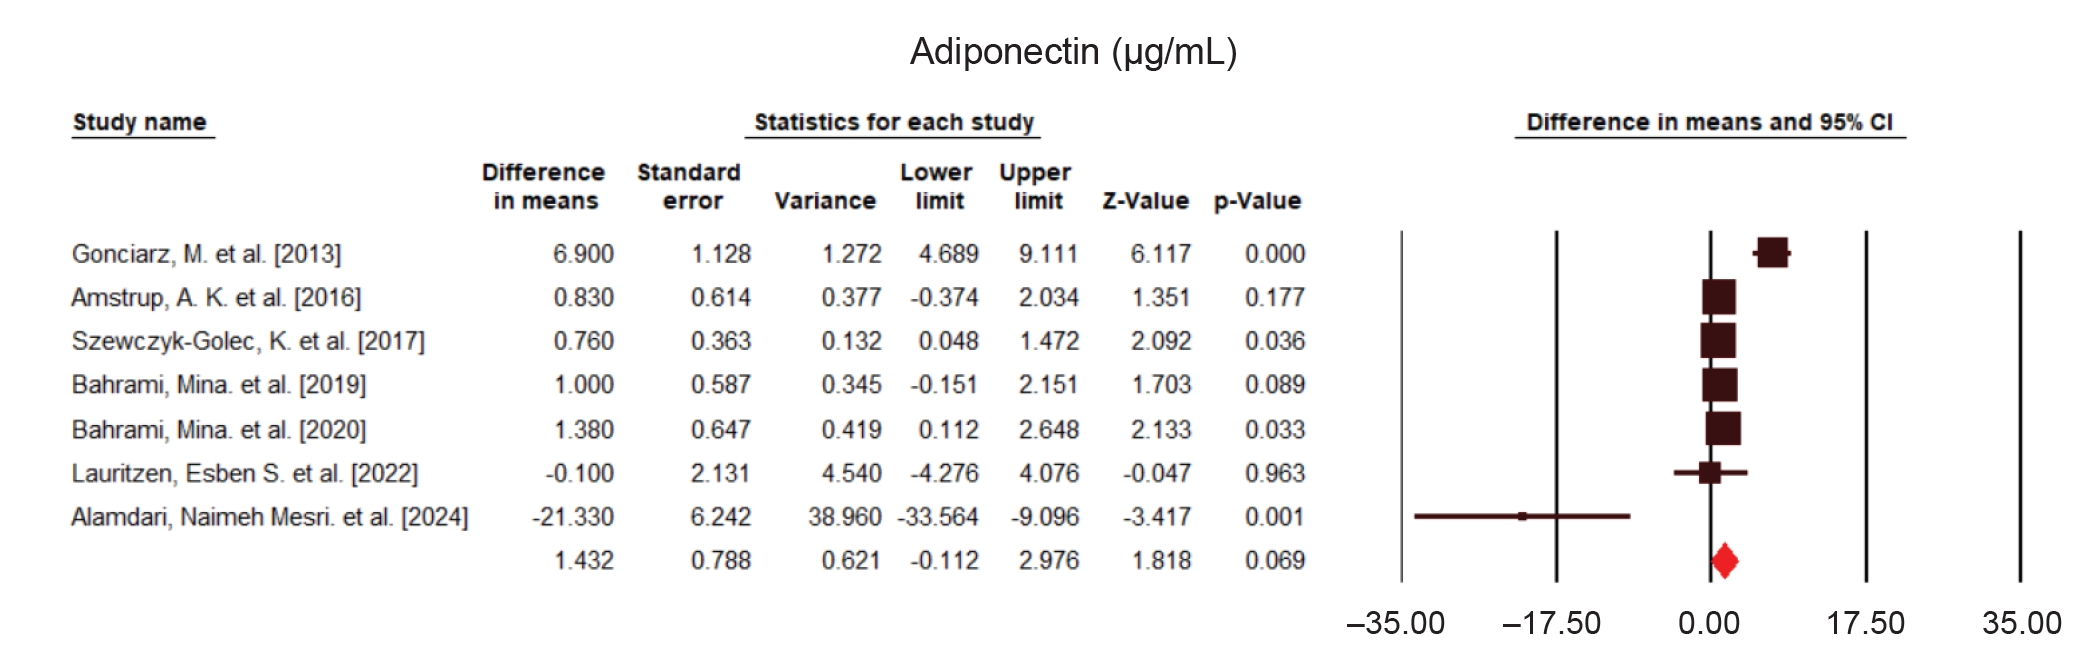
Our meta-analysis found that melatonin supplementation had no significant effect on circulating adiponectin levels (WMD=1.432, 95% CI −0.112 to 2.976, P=0.069, I²=85.33%, heterogeneity P<0.001, n=7) (
Fig. 4). The effect size for melatonin’s impact on adiponectin did not remain stable in the leave-one-out sensitivity analysis, as the exclusion of the trial conducted by Mesri Alamdari et al. [
13] significantly altered the pooled estimate. Specifically, after removing this study, melatonin supplementation was associated with a significant increase in circulating adiponectin levels (
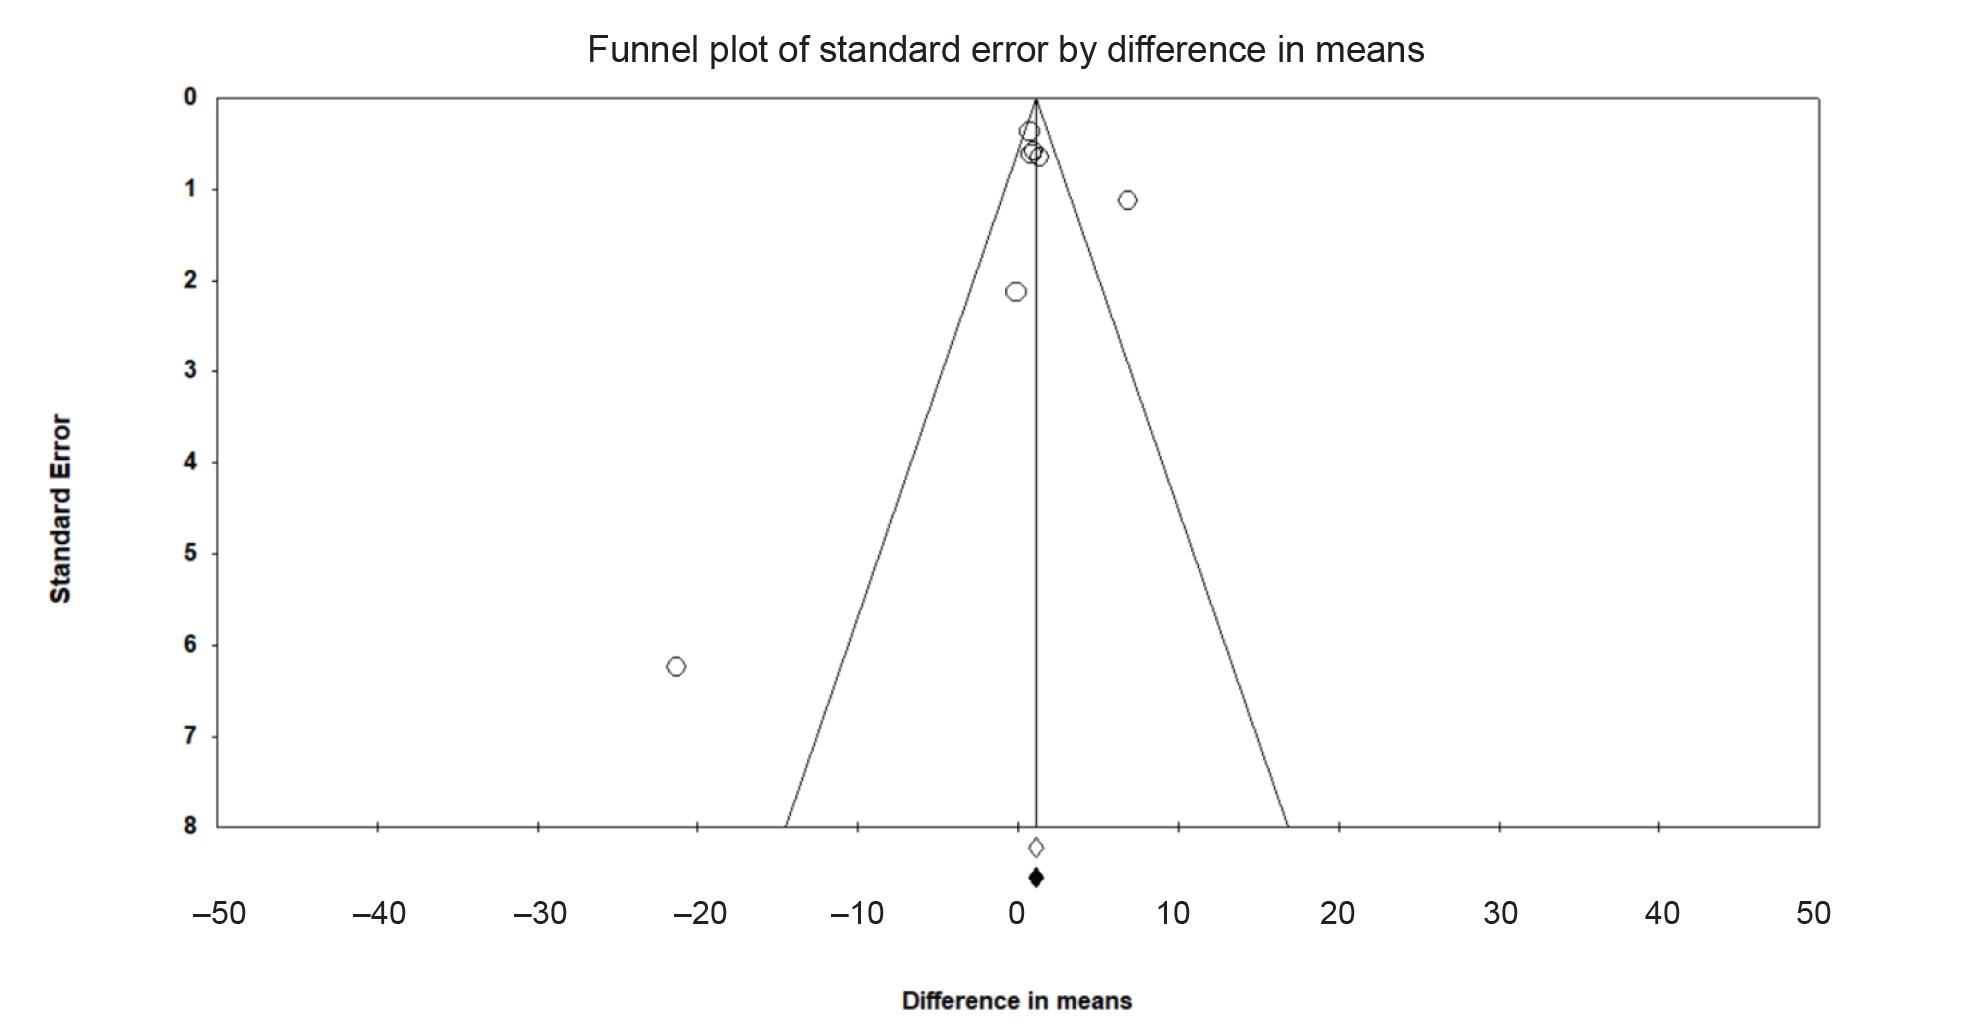
Table S2). Our funnel plot showed no evidence of asymmetry among the included studies (
Fig. 5). For adiponectin, neither Begg’s test (P=0.88) nor Egger’s test (P=0.89) identified the presence of publication bias. The corrected WMD, calculated using the trim-and-fill method, is displayed in both the funnel plot (
Fig. 5) and
Table 2. We found no significant differences between most subgroup types in the effect of melatonin on adiponectin. However, when intervention durations were >10 weeks, melatonin supplementation was associated with a significant increase in circulating adiponectin levels. Details of the subgroup findings are presented in
Table 3.
Our GRADE analysis found the quality of evidence to be moderate in all studies, including those evaluating the effect of melatonin supplementation on serum leptin and those evaluating its effect on serum adiponectin. Details of this quality assessment are provided in
Table 4.
DISCUSSION
This systematic literature review and GRADE-based meta-analysis of RCTs assessed whether melatonin supplementation has measurable effects on circulating levels of leptin and adiponectin in adults. Combining the data from nine studies (total participants=467), we found no statistically significant changes from baseline in either the overall mean leptin (WMD=0.172 ng/mL; 95% CI, −2.158 to +2.501; I²=38.6%) or overall mean adiponectin (WMD=1.432 µg/mL; 95% CI, −0.112 to +2.976) levels. However, we noted considerable heterogeneity in the reported adiponectin levels (I²=85.3%), which caused a large variation in sensitivity to the removal of one study [
13]. Based on these findings, we conclude that, despite some biological plausibility [
6], there is moderately certain evidence, according to GRADE, that melatonin does not cause population-level changes in leptin or adiponectin levels in adults.
Our pooled analyses found that melatonin does not appear to affect leptin [
24]. Hyperleptinemia and leptin resistance are commonly found in those with obesity and/or cardiometabolic disease [
25,
26]. This suggests that any effect that melatonin might exert on appetite or adipose tissue signaling may differ between phenotypes. If this is the case, such effects would be difficult to recognize across pooled study results. Although melatonin’s effects on leptin displayed moderate heterogeneity between studies, the results of our leave-one-out sensitivity analyses were consistent, with none of the studies disproportionately influencing the overall results.
Our subgroup analyses found the duration and dosage of the melatonin treatment to correlate with its effects on leptin levels. However, the low statistical power in the subgroups and the variability due to multiple comparisons mean these were hypothesis-generating results only. Further studies are needed to test their validity and reliability.
The effects of melatonin on adiponectin produced a modestly favorable pooled average estimate, but there was no significant overall intervention-induced increase in adiponectin due to the very high level of heterogeneity between the results of the different studies (I²=85.33%). This raises concerns about the accuracy of any individual average effect. Also, the Mesri Alamdari et al. [
13] results had a particularly large impact on the precision of the pooled estimates. Removing the study resulted in statistically significant pooled estimates, suggesting that the effect of melatonin on adiponectin is likely context-dependent. Our subgroup analyses showed an association between higher adiponectin levels and longer intervention periods (>10 weeks; I²=0%), but no consistent effects in shorter trials. This suggests that prolonged or chronic exposure to melatonin may be necessary to produce changes in this hormone.
The existing literature did not support broad population-wide effects. Nevertheless, adiponectin has an established ability to enhance insulin sensitivity and reduce the risk of cardiovascular disease [
27]. Therefore, melatonin-induced increases in adiponectin could be beneficial in insulin-resistant individuals.
Our exploratory subgroup analyses suggested potential effect modifications based on the duration and dose of melatonin treatment, but these results must be interpreted with caution. In trials lasting <10 weeks (WMD=3.51 ng/mL; P=0.044), leptin levels significantly increased. In trials lasting >10 weeks, they significantly decreased (WMD=−2.17 ng/mL; P=0.010). After duration-based grouping of the leptin results, there was no remaining heterogeneity (I²=0% for both). Our subanalysis by dose found a significant change in leptin levels in those receiving 10 mg/day of melatonin (WMD=4.84 ng/mL; P=0.023) but BMI subgroups (less than or more than 30 kg/m²) showed no substantial difference. The majority of our subgroup analyses found no statistical differences in adiponectin changes. However, interventions with longer durations (>10 weeks) produced significant increases (WMD=1.02 µg/mL; P=0.003; I²=0%), indicating potential time-dependent melatonin effects on adiponectin levels.
The mechanisms by which melatonin affects adipokines are not well understood. Rather than directly inducing the release of leptin and adiponectin by adipose tissue through their receptors on peripheral tissue, melatonin appears to act as a chronobiotic, synchronizing the body’s central (suprachiasmatic nucleus) and peripheral (including adipose) biological clocks [
6]. Melatonin also has antioxidant and anti-inflammatory functions that can offset the effects of chronic inflammation associated with obesity. This may explain the improvements in adiponectin levels and insulin sensitivity it produces over time [
9,
11]. Additionally, the signaling pathways for melatonin receptor activation regulate the metabolism of glucose and overall energy. This suggests the possibility that melatonin modulates adipokines more indirectly through the regulation of metabolic processes [
12].
Heterogeneous clinical practices and methodologies likely contributed to the inconsistent responses of adipokines, particularly adiponectin, to melatonin observed in the present study. The populations in this review ranged from healthy postmenopausal women to patients with metabolic syndrome, nonalcoholic fatty liver disease, nonalcoholic steatohepatitis, polycystic ovary syndrome, type 2 diabetes mellitus, and obesity. There was also high variability in BMI, which ranged between 23.6 kg/m
2 and 40.24 kg/m
2. This is noteworthy as BMI is known to affect baseline adipokine levels and the responsiveness of adipokines to melatonin supplementation [
28]. The protocols for the studies also varied greatly in the durations (4–48 weeks) and dosages (3–10 mg/day) of the interventions and, in some cases, included co-intervention groups (e.g., melatonin + metformin) or non-placebo comparators (e.g., magnesium). Methodological variations included parallel, crossover, and multi-arm designs. These differences impeded direct comparisons between studies. Furthermore, melatonin’s chronobiotic regulation of circadian rhythms depends on dosage phase and timing. Yet, this information was not consistently reported by all included studies, which may have masked or nullified the true effects of melatonin supplementation on adipose tissue endocrine functions [
29,
30].
Our adiponectin findings should be interpreted with caution due to the substantial heterogeneity in the levels of the hormone between studies (I²=85.33%). Differences in participants’ baseline metabolic characteristics, including BMI, body fat distribution, insulin resistance, and underlying metabolic disorders, may explain this variability. Moreover, our sensitivity analysis revealed that the overall results were highly influenced by the Mesri Alamdari et al . [
13] study, as its exclusion changed the statistical significance of the pooled effect. This suggests that the findings were not sufficiently robust. Therefore, the results of our subgroup analyses should be considered exploratory rather than conclusive. Further well-designed RCTs are needed to clarify the effects of melatonin supplementation on adiponectin levels.
The methodological strengths of this review include adherence to the PRISMA guidelines, comprehensive literature searches of three large databases (PubMed, Scopus, and Web of Science) with additional manual searches, independent selection and extraction methods based on PICOS criteria; a rigorous Cochrane Risk-of-Bias assessment supported by a range of pre-specified quantitative methods (i.e., random-effects modeling; heterogeneity testing; leave-one-out sensitivity analyses; subgroup analyses by BMI, intervention duration, and intervention dose; and various analyses of small-study effects) and the application of GRADE. The GRADE approach provides objective contextualization of the overall null findings.
The key limitations of this review included the relatively small body of evidence (only nine studies, with 467 total participants), the small number of adiponectin studies, and the very high heterogeneity (I²=85.33%) of the latter. These shortcomings limit both the precision and the generalizability of our findings. Further, the adiponectin estimates were sensitive to the exclusion of individual studies (in particular, that of Mesri Alamdari et al. [
13]). There was substantial clinical and methodological diversity in the study populations, countries of origin, study designs, intervention dosages and durations, and the use of a single or multiple arms. In addition, the imputation of SDs, conversion of median (IQR), extraction of data from figures, publication bias, and small-study analyses all increase the need for cautious interpretation of this small, heterogeneous meta-analysis. The results of our subgroup analyses should be considered hypothesis-generating.
CONCLUSION
This meta-analysis suggests that melatonin supplementation does not produce meaningful changes in the circulating leptin or adiponectin levels of adults. The currently available evidence indicates that such supplements exert little or no effect on either hormone. However, we found considerable between-study variability in these results, particularly for adiponectin. Therefore, the pooled findings should be interpreted cautiously. Although exploratory analyses suggested potential differences in effects according to the durations and dosages of the intervention, these findings are hypothesis-generating rather than conclusive. Further well-designed RCTs are needed, with adequate sample sizes, standardized supplementation protocols and adipokine assessment methods, and careful consideration of participants’ baseline metabolic status and the timing and duration of melatonin administration. Such research may clarify whether melatonin supplementation may benefit specific patient populations or participant subgroups.
NOTES
-
Author Contributions
Conceptualization: MM. Data curation: MM, SH, VH, RAK, MZ. Validation of results: MM. Data analysis: MM. Writing - original draft: MM, RAK. Writing - review & editing: MM, RAK. All authors read and approved the final manuscript.
-
Conflict of Interest
None.
-
Funding
None.
-
Data availability
The datasets analyzed in the current study are available from the corresponding author upon reasonable request.
Supplementary materials
Table S3.
Quality assessment of clinical trials (according to the Cochrane guideline) investigating the impact of melatonin supplementation on adiponectin and leptin
cnr-2026-0022-Supplementary-Table-S3.pdf
Fig. 1.Flowchart of the literature search process in this systematic review.
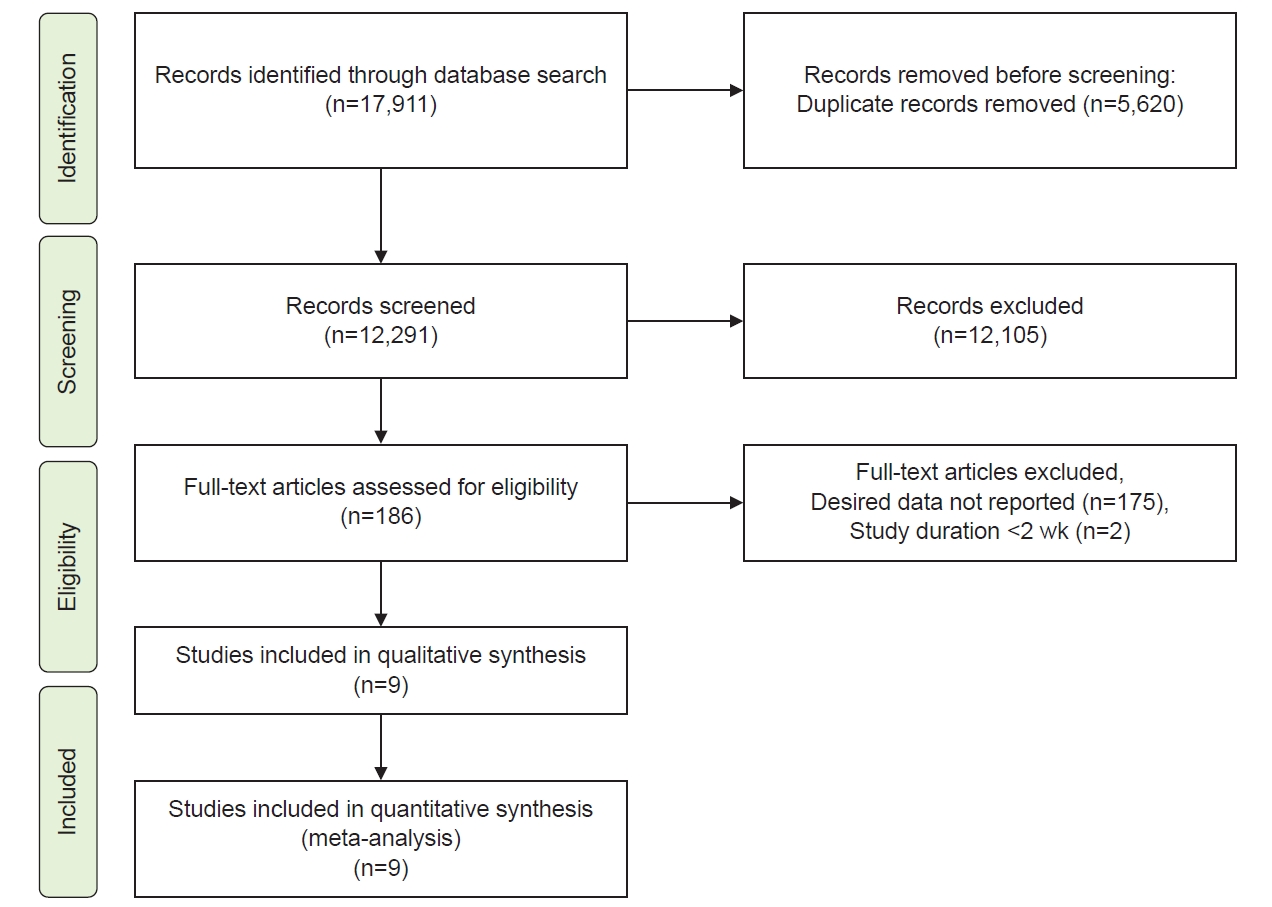
Fig. 2.Forest plot detailing the weighted mean differences and 95% confidence intervals (CIs) for the effect of melatonin supplementation on leptin levels in the reviewed studies.
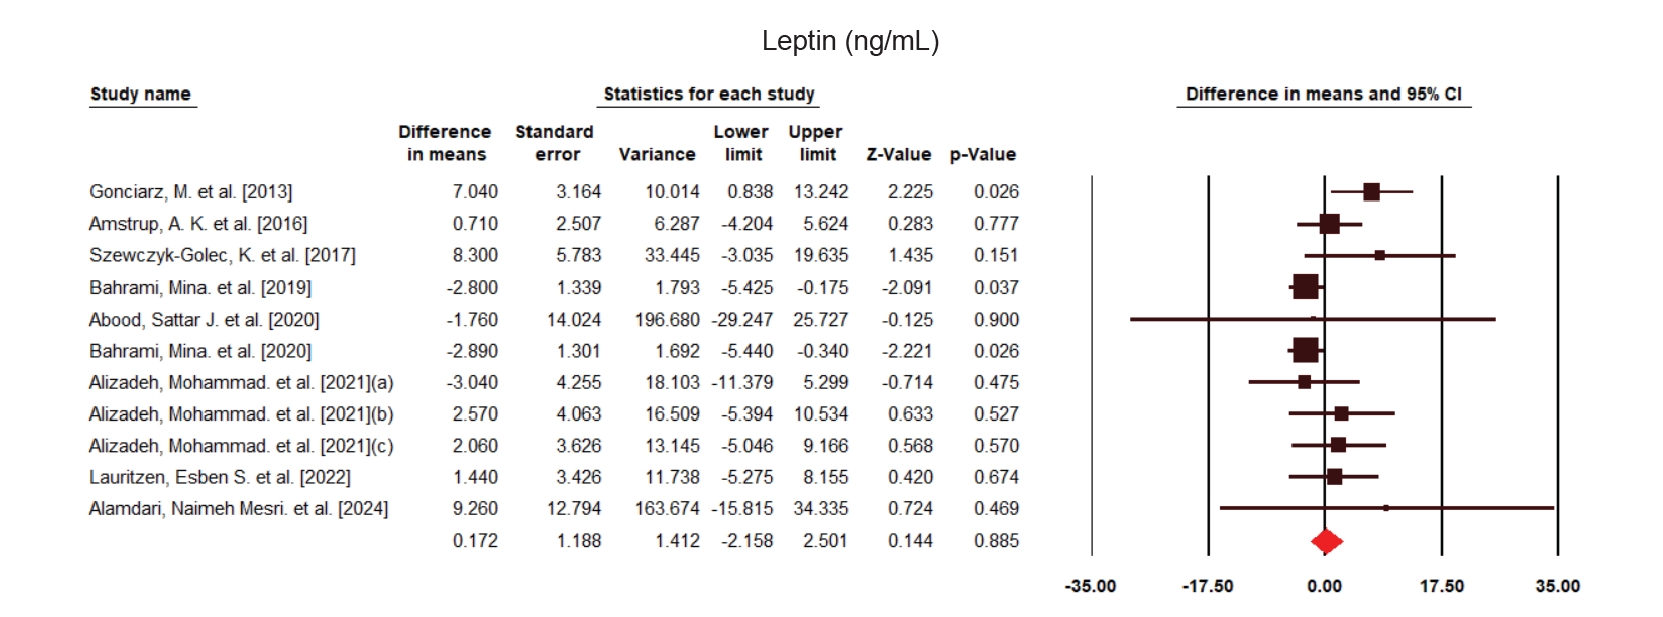
Fig. 3.Funnel plot showing the effect of melatonin supplementation on leptin levels (ng/mL).
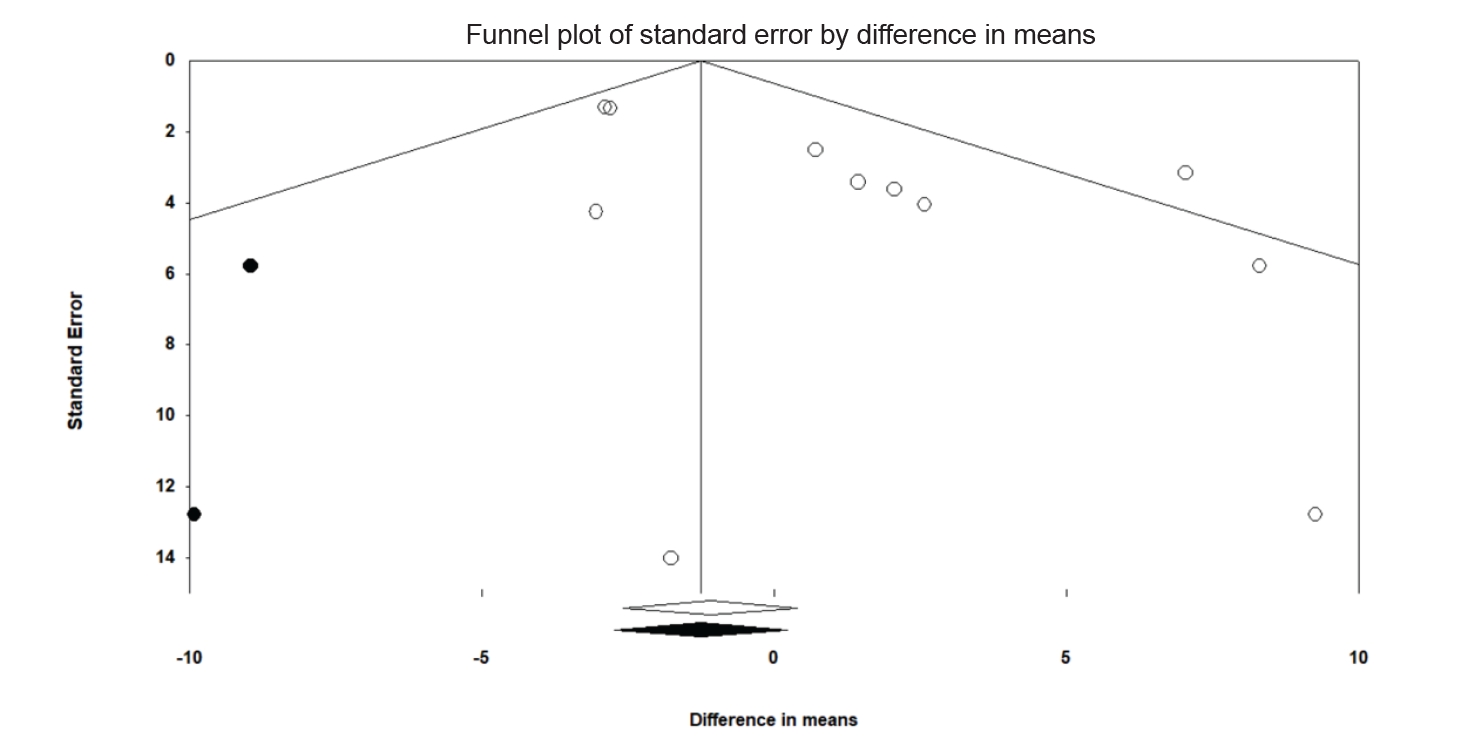
Fig. 4.Forest plot detailing the weighted mean differences and 95% confidence intervals (CIs) for the effect of melatonin supplementation on adiponectin levels in the reviewed studies.
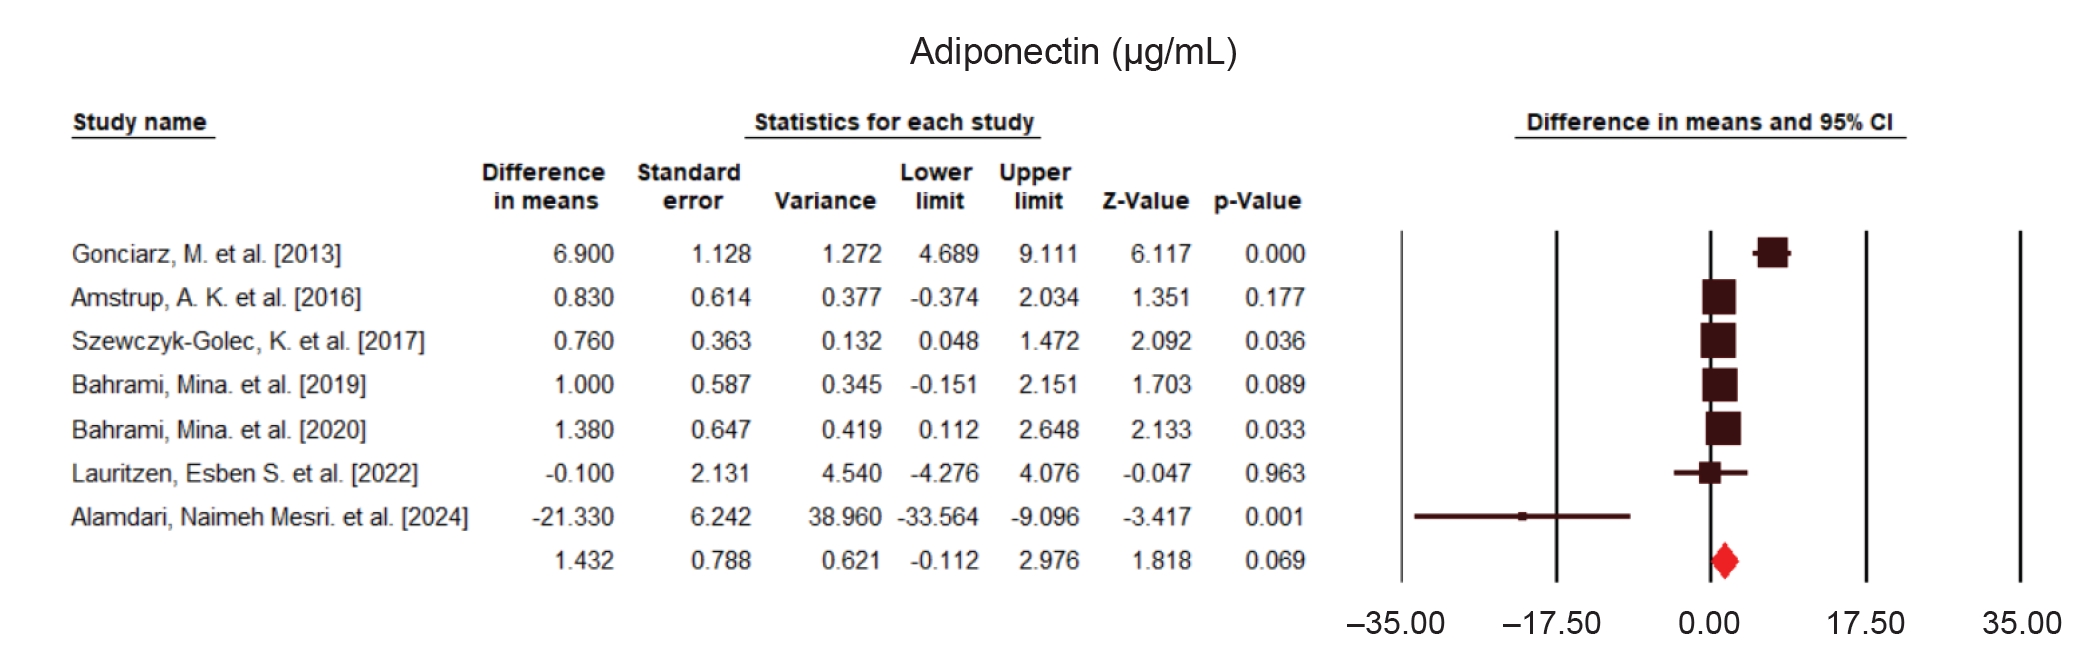
Fig. 5.Funnel plots for the effect of melatonin supplementation on adiponectin levels (µg/mL).
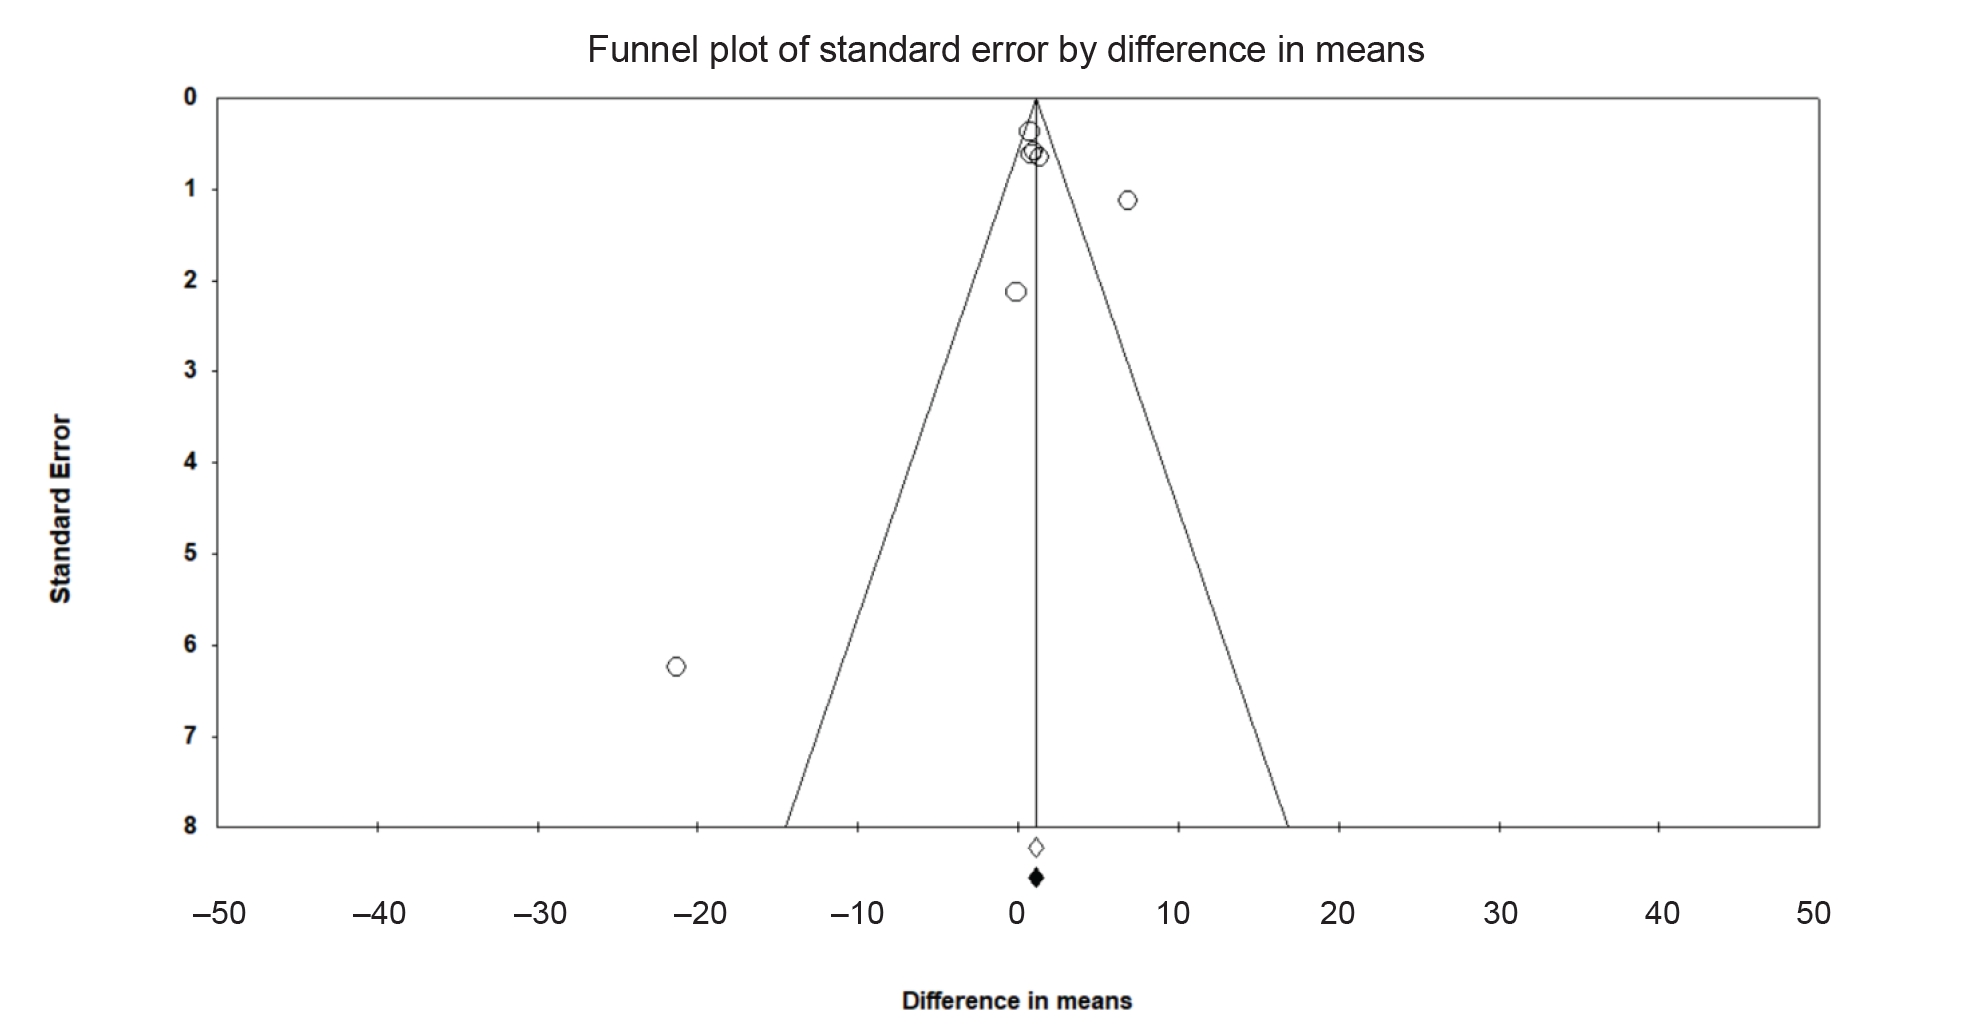
Table 1.Characteristics of studies on the effects of melatonin supplementation on leptin and adiponectin levels
Table 1.
|
Author (year) |
Location |
Design |
Sex (n) |
Duration (wk) |
Enrolled (n) |
IN (n) |
CL (n) |
Mean age (yr) |
Intervention |
Placebo type |
Dose (mg/day) |
Population |
Mean BMI (kg/m2) |
|
Gonciarz et al. (2013) [17] |
Poland |
RP |
F: 13 |
4 |
31 |
16 |
15 |
IN: 42.1 CL: 40.5 |
Melatonin |
Placebo |
10 |
NASH |
28.6 |
|
M: 18 |
|
Amstrup et al. (2016) [18] |
Denmark |
RP |
F: 72 |
48 |
72 |
37 |
35 |
IN: 62.4 CL: 62.9 |
Melatonin |
Placebo |
3 |
Postmenopausal women |
23.6 |
|
Szewczyk-Golec et al. (2017) [7] |
Poland |
RP |
F: 20 |
4 |
30 |
15 |
15 |
IN: 37.7 CL: 36.3 |
Melatonin |
Placebo |
10 |
Obese patients |
37.8 |
|
M: 10 |
|
Bahrami et al. (2019) [19] |
Iran |
RP |
F: 24 |
12 |
70 |
36 |
34 |
IN: 42.5 CL: 42.6 |
Melatonin |
Placebo |
6 |
MetS |
31 |
|
M: 46 |
|
Abood et al. (2020) [20] |
Iraq |
RP |
F: 32 |
13 |
32 |
19 |
13 |
IN: 45.8 CL: 48.07 |
Melatonin + Metformin |
Metformin + Placebo |
10 |
MetS |
40.24 |
|
Bahrami et al. (2020) [21] |
Iran |
RP |
F: 14 |
12 |
45 |
24 |
21 |
IN: 44 |
Melatonin |
Placebo |
6 |
NAFLD |
29.46 |
|
M: 31 |
CL: 37.71 |
|
Alizadeh et al. (2021) (a) [22] |
Iran |
RP |
F: 41 |
8 |
41 |
21 |
20 |
IN: 25.5 CL: 26.20 |
Melatonin |
Placebo |
3 |
PCOS |
28.4 |
|
Alizadeh et al. (2021) (b) [22] |
Iran |
RP |
F: 42 |
8 |
42 |
21 |
21 |
IN: 25.5 CL: 25.57 |
Melatonin |
Magnesium |
3 |
PCOS |
28.4 |
|
Alizadeh et al. (2021) (c) [22] |
Iran |
RP |
F: 43 |
8 |
43 |
22 |
21 |
IN: 28.22 CL: 25.57 |
Melatonin + Magnesium |
Magnesium |
3 |
PCOS |
29.64 |
|
Lauritzen et al. (2022) [23] |
Denmark |
RC |
M: 17 |
12 |
17 |
9 |
8 |
IN: 65 |
Melatonin |
Placebo |
10 |
T2DM |
29 |
|
CL: 62 |
|
Mesri Alamdari et al. (2024) [13] |
Iran |
RP |
F: 44 |
6 |
44 |
22 |
22 |
IN: 33.8 CL: 34.86 |
Melatonin |
Placebo |
6 |
Obese women |
>30 |
Table 2.Assessment of publication bias in studies on the impact of melatonin on adiponectin and leptin levels
Table 2.
|
Corrected effect size |
Begg’s rank correlation test |
Egger’s linear regression test |
Fail-safe N test (n) |
|
WMD |
95% CI |
Kendall’s Tau |
z-value |
P-value |
Intercept |
95% CI |
t-value |
df |
P-value |
|
Leptin (ng/mL) |
–0.22 |
−2.51 to 2.05 |
0.25 |
1.08 |
0.275 |
1.45 |
0.25 to 2.66 |
2.74 |
9 |
0.022 |
0 |
|
Adiponectin (µg/mL) |
1.43 |
−0.11 to 2.97 |
0.00 |
0.00 |
1.000 |
−0.29 |
–5.55 to 4.96 |
0.14 |
5 |
0.891 |
19 |
Table 3.Subgroup analyses of randomized controlled trials in a meta-analysis of the effects of melatonin on adiponectin and leptin levels
Table 3.
|
Outcome |
Subgroup |
No. of studies |
WMD (95% CI) |
P-value |
I² (%) |
P for heterogeneity |
|
Leptin (ng/mL) |
BMI <30 kg/m2
|
7 |
0.67 (−2.25 to 3.59) |
0.653 |
45.59 |
0.087 |
|
BMI ≥30 kg/m2
|
4 |
0.67 (−6.07 to 7.42) |
0.844 |
30.17 |
0.231 |
|
Duration <10 wk |
6 |
3.51 (0.09 to 6.93) |
0.044 |
0.000 |
0.452 |
|
Duration >10 wk |
5 |
−2.17 (−3.83 to −0.51) |
0.010 |
0.000 |
0.565 |
|
Dose <10 mg |
7 |
−1.96 (−3.56 to –0.36) |
0.016 |
0.000 |
0.500 |
|
Dose=10 mg |
4 |
4.84 (0.66 to 9.01) |
0.023 |
0.000 |
0.563 |
|
Adiponectin (µg/mL) |
BMI <30 kg/m2
|
4 |
2.35 (−0.20 to 4.92) |
0.071 |
87.57 |
<0.001 |
|
BMI ≥30 kg/m2
|
3 |
0.16 (−2.10 to 4.92) |
0.88 |
84.24 |
0.002 |
|
Duration <10 wk |
3 |
−0.49 (−7.00 to 6.00) |
0.88 |
94.99 |
<0.001 |
|
Duration >10 wk |
4 |
1.02 (0.34 to 1.71) |
0.003 |
0.00 |
0.877 |
|
Dose <10 mg |
4 |
0.65 (−1.04 to 2.35) |
0.451 |
77.30 |
0.004 |
|
Dose=10 mg |
3 |
2.63 (−1.85 to 7.11) |
0.250 |
92.67 |
<0.001 |
Table 4.GRADE profile of melatonin supplementation on adiponectin and leptin concentration
Table 4.
|
Quality assessment |
Summary of findings |
Quality of evidence |
|
Outcomes |
Risk of bias |
Inconsistency |
Indirectness |
Imprecision |
Publication bias |
No. of intervention/control |
WMD (95% CI) |
|
Leptin (ng/mL) |
No serious limitation |
No serious limitation |
No serious limitation |
Serious limitationb)
|
No serious limitation |
242/225 |
0.17 (–2.16 to 2.50) |
⊕⊕⊕◯ |
|
Moderate |
|
Adiponectin (µg/mL) |
No serious limitation |
Very serious limitationa)
|
No serious limitation |
Serious limitationb)
|
No serious limitation |
242/225 |
1.43 (–0.11 to 2.98) |
⊕⊕⊕◯ |
|
Moderate |
REFERENCES
- 1. Ha E, Yim SV, Chung JH, et al. Melatonin stimulates glucose transport via insulin receptor substrate-1/phosphatidylinositol 3-kinase pathway in C2C12 murine skeletal muscle cells. J Pineal Res 2006;41:67-72.
- 2. Yang W, Tang K, Wang Y, Zhang Y, Zan L. Melatonin promotes triacylglycerol accumulation via MT2 receptor during differentiation in bovine intramuscular preadipocytes. Sci Rep 2017;7:15080.
- 3. Picinato MC, Haber EP, Carpinelli AR, Cipolla-Neto J. Daily rhythm of glucose-induced insulin secretion by isolated islets from intact and pinealectomized rat. J Pineal Res 2002;33:172-7.
- 4. Borges-Silva Cd, Takada J, Alonso-Vale MI, et al. Pinealectomy reduces hepatic and muscular glycogen content and attenuates aerobic power adaptability in trained rats. J Pineal Res 2007;43:96-103.
- 5. Lima FB, Matsushita DH, Hell NS, Dolnikoff MS, Okamoto MM, Cipolla Neto J. The regulation of insulin action in isolated adipocytes. role of the periodicity of food intake, time of day and melatonin. Braz J Med Biol Res 1994;27:995-1000.
- 6. Szewczyk-Golec K, Wozniak A, Reiter RJ. Inter-relationships of the chronobiotic, melatonin, with leptin and adiponectin: implications for obesity. J Pineal Res 2015;59:277-91.
- 7. Szewczyk-Golec K, Rajewski P, Gackowski M, et al. Melatonin supplementation lowers oxidative stress and regulates adipokines in obese patients on a calorie-restricted diet. Oxid Med Cell Longev 2017;2017:8494107.
- 8. Hadi S, Hadi V, Mohammadzadeh M, Jahangirfard B. Effects of melatonin supplementation on blood glycemic indices in adults: a GRADE-assessed systematic review and dose-response meta-analysis of randomized controlled trials. Nutr Metab (Lond) 2026;23:27.
- 9. Guan Q, Wang Z, Cao J, Dong Y, Chen Y. Mechanisms of melatonin in obesity: a review. Int J Mol Sci 2021;23:218.
- 10. Favero G, Stacchiotti A, Castrezzati S, et al. Melatonin reduces obesity and restores adipokine patterns and metabolism in obese (ob/ob) mice. Nutr Res 2015;35:891-900.
- 11. Pivonello C, Negri M, Patalano R, et al. The role of melatonin in the molecular mechanisms underlying metaflammation and infections in obesity: a narrative review. Obes Rev 2022;23:e13390.
- 12. Owino S, Buonfiglio DDC, Tchio C, Tosini G. Melatonin signaling a key regulator of glucose homeostasis and energy metabolism. Front Endocrinol (Lausanne) 2019;10:488.
- 13. Mesri Alamdari N, Namazi Shabestari A, Najafipour F, Mirmazhari A. Melatonin supplementation improves glycemic hemostasis, lipid profile, and adipokine concentrations of obese women: a double-blind randomized clinical trial. Biomed adv 2024;1:27-33.
- 14. Higgins JPT. Cochrane handbook for systematic reviews of interventions. Version 5.1.0. The Cochrane Collaboration; 2011.
- 15. Higgins JPT. Cochrane handbook for systematic reviews of interventions. Version 5.0. The Cochrane Collaboration; 2008.
- 16. Hozo SP, Djulbegovic B, Hozo I. Estimating the mean and variance from the median, range, and the size of a sample. BMC Med Res Methodol 2005;5:13.
- 17. Gonciarz M, Bielanski W, Partyka R, et al. Plasma insulin, leptin, adiponectin, resistin, ghrelin, and melatonin in nonalcoholic steatohepatitis patients treated with melatonin. J Pineal Res 2013;54:154-61.
- 18. Amstrup AK, Sikjaer T, Pedersen SB, Heickendorff L, Mosekilde L, Rejnmark L. Reduced fat mass and increased lean mass in response to 1 year of melatonin treatment in postmenopausal women: a randomized placebo-controlled trial. Clin Endocrinol (Oxf) 2016;84:342-7.
- 19. Bahrami M, Cheraghpour M, Jafarirad S, Alavinejad P, Cheraghian B. The role of melatonin supplement in metabolic syndrome: a randomized double blind clinical trial. Nutr Food Sci 2019;49:965-77.
- 20. Abood SJ, Abdulsahib WK, Hussain SA, Ismail SH. Melatonin potentiates the therapeutic effects of metformin in women with metabolic syndrome. Sci Pharm 2020;88:28.
- 21. Bahrami M, Cheraghpour M, Jafarirad S, et al. The effect of melatonin on treatment of patients with non-alcoholic fatty liver disease: a randomized double blind clinical trial. Complement Ther Med 2020;52:102452.
- 22. Alizadeh M, Karandish M, Asghari Jafarabadi M, et al. Metabolic and hormonal effects of melatonin and/or magnesium supplementation in women with polycystic ovary syndrome: a randomized, double-blind, placebo-controlled trial. Nutr Metab (Lond) 2021;18:57.
- 23. Lauritzen ES, Kampmann U, Pedersen MGB, et al. Three months of melatonin treatment reduces insulin sensitivity in patients with type 2 diabetes: a randomized placebo-controlled crossover trial. J Pineal Res 2022;73:e12809.
- 24. Friedman J. The long road to leptin. J Clin Invest 2016;126:4727-34.
- 25. Cui H, Lopez M, Rahmouni K. The cellular and molecular bases of leptin and ghrelin resistance in obesity. Nat Rev Endocrinol 2017;13:338-51.
- 26. Martin SS, Qasim A, Reilly MP. Leptin resistance: a possible interface of inflammation and metabolism in obesity-related cardiovascular disease. J Am Coll Cardiol 2008;52:1201-10.
- 27. Kadowaki T, Yamauchi T, Kubota N, Hara K, Ueki K, Tobe K. Adiponectin and adiponectin receptors in insulin resistance, diabetes, and the metabolic syndrome. J Clin Invest 2006;116:1784-92.
- 28. Guenther M, James R, Marks J, Zhao S, Szabo A, Kidambi S. Adiposity distribution influences circulating adiponectin levels. Transl Res 2014;164:270-7.
- 29. Cruz-Sanabria F, Carmassi C, Bruno S, et al. Melatonin as a chronobiotic with sleep-promoting properties. Curr Neuropharmacol 2023;21:951-87.
- 30. Arendt J, Skene DJ. Melatonin as a chronobiotic. Sleep Med Rev 2005;9:25-39.


 , Milad Mohammadzadeh1,3,*