ABSTRACT
-
Objective
This study aimed to identify dietary patterns and examine their associations with sociodemographic and lifestyle characteristics among South Korean primary school–aged children.
-
Methods
Data from 10,173 children aged 6–12 years who participated in the 2007–2022 Korea National Health and Nutrition Examination Survey were analyzed. Their dietary intake was assessed using a 24-hour dietary recall, and dietary patterns were derived from the energy contributions of 26 food groups through cluster analysis.
-
Results
Three patterns were identified: rice-based pattern (47.3%), flour-based pattern (17.7%), and diversified type (35.1%). From 2007 to 2022, the prevalence of the rice-based pattern declined substantially (56.6% to 32.6%), whereas that of the diversified type markedly increased (27.3% to 47.0%). Survey-weighted analyses revealed that the dietary patterns were significantly associated with age, household income, vigorous physical activity, meal-skipping, eating-out frequency, and dietary supplement use (all, P<0.05). Children following the flour-based pattern tended to be older, skip breakfast more often, and engage in less vigorous physical activities. The rice-based pattern included a higher proportion of children from low-income households, whereas the diversified type showed more favorable socioeconomic characteristics and family breakfast practices. Overall, the rice-based and flour-based patterns were associated with less favorable lifestyle behaviors than the diversified type.
-
Conclusion
Dietary patterns among South Korean primary school–aged children appear to be closely related to socioeconomic status and daily health behaviors. Nutrition education and public health interventions promoting balanced diets, reduced meal skipping, and healthier lifestyles during childhood are needed.
-
Keywords: Primary school–aged children; Dietary patterns; Secular trends; Cluster analysis; Korea National Health and Nutrition Examination Survey
INTRODUCTION
Dietary habits established during childhood considerably impact physical growth, cognitive development, and long-term health outcomes [
1]. Childhood is a sensitive period during which food preferences and eating behaviors are formed, and these behaviors often persist into adolescence and adulthood [
2]. Unhealthy dietary habits developed during childhood are associated with increased risks of obesity and other chronic health problems later in life [
1,
2]. Therefore, understanding childhood dietary behaviors is essential for developing effective nutrition policies and early-life interventions aimed at promoting lifelong health.
In recent decades, rapid socioeconomic development and food environment changes have substantially altered dietary behaviors worldwide, including in South Korea [
3]. Traditional South Korean diets comprising rice, vegetables, legumes, and fermented foods have gradually shifted toward more Westernized dietary patterns commonly involving processed and convenience foods, particularly among children and adolescents [
3,
4]. Recent studies based on the Korea National Health and Nutrition Examination Survey (KNHANES) have also reported changes in dietary behaviors among South Korean youth [
4]. These dietary transitions have raised public health concerns, considering that Westernized dietary patterns have been linked to poorer dietary quality and undesirable health effects among children and adolescents [
5].
Traditional nutritional epidemiology often focuses on individual nutrients or specific food items [
6]. However, given that foods are consumed in combination rather than independently, analyses focusing solely on single nutrients may not adequately reflect overall eating behaviors [
7]. Thus, dietary pattern analysis has been widely used to evaluate overall dietary intake by considering food combinations that are habitually consumed within populations [
7,
8]. Empirical methods, including factor and cluster analyses, have been extensively applied to identify major dietary patterns and examine their associations with nutritional status, obesity, and socioeconomic characteristics [
8].
KNHANES is a nationally representative cross-sectional survey that provides comprehensive information on the South Korean population’s dietary intake, health behaviors, and socioeconomic characteristics [
9]. Previous KNHANES-based studies have identified distinct dietary patterns, including traditional and Westernized dietary patterns, among South Korean children and adolescents [
4]. However, the Westernized dietary patterns have been associated with poorer dietary quality and unfavorable health outcomes among younger populations [
5]. Additionally, socioeconomic disparities in dietary behaviors have consistently been observed, suggesting the substantial influence of household income, parental environment, and lifestyle behaviors on children’s dietary patterns [
10,
11].
Although dietary patterns among South Korean children and adolescents have already been widely studied, less attention has been given to primary school–aged children. This age period may be crucial because children gradually become more independent in food selection while still remaining influenced by family environments and parental dietary practices. Furthermore, dietary behaviors established during the early school-age may be applied into later stages of life and contribute to future health inequalities [
2]. Therefore, dietary patterns and related socioeconomic and lifestyle factors during this developmental stage must be identified to establish effective early nutritional interventions.
Accordingly, this study aimed to identify major dietary patterns among South Korean primary school–aged children included in the 2007–2022 KNHANES database and to examine differences in nutrient intake, sociodemographic characteristics, and lifestyle behaviors according to dietary patterns.
METHODS
Ethics statement
All participants provided written informed consent. The Institutional Review Board (IRB) of the Korea Disease Control and Prevention Agency reviewed and approved the protocols of KNHANES. This study was exempted from additional IRB approval, given the use of de-identified, publicly available KNHANES data.
Study design and participants
This study used data from KNHANES, which is conducted annually by the Korea Disease Control and Prevention Agency. This survey targets the noninstitutionalized civilian population of South Korea, with informed consent obtained from all participants. Although KNHANES was initially conducted in 1998, 2001, and 2005, it has been conducted annually since 2007. To evaluate long-term, continuous secular trends in dietary patterns among primary school–aged children in South Korea, this study used data collected between 2007 and 2022.
The initial sample included 10,233 children aged 6–12 years who completed all three KNHANES components, namely, the health interview/health behavior survey, health examination, and nutrition survey. Of these participants, 60 were excluded because of having implausible total daily energy intake (≤500 kcal or >5,000 kcal). Ultimately, 10,173 primary school–aged children (5,286 boys and 4,887 girls) were included in the analysis.
Dietary assessment
Dietary intake was assessed using a standardized 24-hour dietary recall method. In this method, information on the time, type, and quantity of all foods and beverages consumed by participants during the previous 24 hours was collected by trained interviewers. Visual aids, including food models and photographs, were also used to enhance recall accuracy. Between 2007 and 2021, dietary data were obtained at participants’ homes, and the day before the survey served as the reference day. From 2022 onward, the reference day was defined as 2 days before the survey, and interviews were conducted in mobile examination units, in accordance with the procedures specified by KNHANES.
Dietary pattern analysis
Dietary patterns were identified by classifying food items into 26 groups according to the KNHANES food classification system. Grouping was mainly based on similarities in nutrient composition, as well as culinary use and the food processing level [
8].
Grain and grain-based foods contribute substantially to total daily energy intake; hence, staple foods were further divided into six subgroups: whole grains, refined white rice, refined grains, wheat flour and bread, processed white rice, and flour-based foods.
Salted vegetables, including kimchi, contribute substantially to sodium intake; thus, they were classified separately from fresh vegetables. Furthermore, meat products were subdivided into red meat, poultry, and processed meat, while beverages were categorized as fruit juices, tea and coffee, and sugar-sweetened beverages.
In total, 26 food groups were defined: whole grains, refined white rice, refined grains, wheat flour and bread, processed white rice, flour-based foods, potatoes, sweets, legumes and tofu (including soymilk), nuts, unsalted vegetables, kimchi and salted vegetables, seasonings, fruits, red meat, poultry, processed meat, eggs, fish and seafood, seaweed, milk and dairy products, plant oils, animal oils, fruit juices, tea and coffee, and sugar-sweetened beverages.
Moreover, the proportion of energy derived from each group was calculated to evaluate each food group’s contribution to total energy intake while standardizing intake across individuals with differing total energy consumption and accounting for weight and volume differences between solid and liquid items. This energy-based approach is widely used in dietary pattern analysis because it expresses each food group’s contribution relative to an individual’s overall diet rather than in absolute terms, enabling comparison across participants with different total intake levels. However, given that energy-dense food groups inherently contribute a larger share of total energy, high-energy food groups (e.g., grains, meat, and oils) may be given a proportionally greater weight by this approach than low-energy but nutritionally relevant food groups (e.g., vegetables and seaweed), indicating a limitation of this study. Subsequently, dietary patterns were identified using K-means cluster analysis based on these proportions across the 26 food groups. The optimal number of clusters, determined using Ward’s method, was three. These clusters were selected according to the dendrogram structure and the clinical interpretability of the resulting dietary patterns. Each dietary pattern was assigned a descriptive name that reflected the dominant food groups consumed within each cluster. The clustering procedures (PROC CLUSTER and PROC FASTCLUS) do not support complex survey sampling weights; hence, sampling weights were not applied during the clustering procedure itself.
Nutrient intake
Total daily energy intake was calculated from all reported foods and beverages. To calculate the percentage of energy derived from carbohydrates and protein, we multiplied carbohydrate or protein intake (g) by 4 kcal, divided by total energy intake (kcal), and then multiplied by 100. For the percentage of energy derived from fat, we multiplied fat intake (g) by 9 kcal, divided by total energy intake (kcal), and multiplied by 100.
Nutrient intake was evaluated using 14 components: total energy (kcal), protein (g), fat (g), carbohydrate (g), calcium (mg), phosphorus (mg), iron (mg), potassium (mg), vitamin A (retinol activity equivalents [RAE]), carotene (μg), thiamin (mg), riboflavin (mg), niacin (mg), and vitamin C (mg).
All values were standardized to a single metric, considering that the unit used for vitamin A intake changed following revisions to the Korean Dietary Reference Intakes (KDRI). Vitamin A intake was calculated as retinol equivalents (retinol+1/6×β-carotene) until 2015, and since 2016, it has been calculated as RAE (retinol +1/12×β-carotene). Accordingly, data from 2007 to 2015 were recalculated using the RAE standard and included in the final analysis.
Demographic and lifestyle information
Data on age, residential area, household income, and vigorous physical activity were collected by trained interviewers through face-to-face interviews. Residential areas were classified into urban and rural. Household income was calculated as equivalized monthly income by dividing the total household income by the number of household members and then categorized into four levels: low, lower-middle, upper-middle, and high. Vigorous physical activity, which referred to participation in high-intensity physical activity for at least 10 minutes per week, was classified as yes or no.
Weight status was determined using age- and sex-specific body mass index (BMI) percentiles based on the 2017 Korean National Growth Charts and then categorized into the following: underweight (BMI <5th percentile), normal weight (BMI 5th to <95th percentile), and obesity (BMI ≥95th percentile).
To assess dietary behaviors, we determined the frequency of skipping breakfast, lunch, and dinner and whether meals were consumed with family members. In addition, eating-out frequency was classified into three: none, 1 to 6 times per week, and at least once per day. Criteria for dietary supplement use varied according to the survey year; therefore, participants were classified as supplement users according to the corresponding survey definitions.
Statistical analysis
KNHANES employs a complex, multistage, stratified, and clustered sampling design. To obtain nationally representative estimates and appropriate variance estimates, we considered the survey design in all statistical analyses by incorporating sampling weights, stratification variables, and primary sampling units. Furthermore, all analyses were conducted separately for boys and girls, reflecting sex-related differences in dietary and behavioral characteristics.
Hierarchical cluster analysis based on Ward’s method, followed by K-means clustering, was applied for identifying dietary patterns. We present continuous variables as weighted means and standard errors, and categorical variables as weighted percentages and standard errors. For evaluating group differences, the Rao-Scott chi-square test and survey-weighted linear regression models were employed. As mentioned, sampling weights were not applied during the clustering procedure itself; nonetheless, all subsequent descriptive and inferential analyses incorporated the complex survey design, which included the sampling weights, stratification, and primary sampling units, to obtain nationally representative estimates. Moreover, we conducted post hoc pairwise comparisons among the three dietary patterns through unadjusted pairwise t-tests (linear contrasts) derived from the survey-weighted linear regression models for each nutrient variable, without correction for multiple comparisons. The following three pairs of dietary patterns were compared: rice-based vs. flour-based, rice-based vs. diversified-type, and flour-based vs. diversified type.
To examine the associations between dietary patterns and nutrient intake, we used survey-weighted linear regression models adjusted for age, total energy intake, household income level, and BMI category. Meanwhile, weighted Rao-Scott chi-square tests were applied for assessing sex-specific secular trends in dietary pattern distribution. All statistical data were analyzed using SAS ver. 9.4 (SAS Institute Inc.), and a P-value below 0.05 was considered statistically significant.
RESULTS
Dietary pattern characteristics
Cluster analysis revealed three distinct dietary patterns (
Table 1). Participants were grouped according to similarities in dominant food group consumption. The largest group (n=4,807, 47.3%) showed a markedly higher proportion of energy derived from refined white rice relative to the other groups, thereby labeled as the rice-based pattern. The second group (n=1,800, 17.7%) displayed a distinctly higher proportion of energy derived from flour-based foods, thereby designated as the flour-based pattern. The remaining group (n=3,566, 35.1%) exhibited a more even distribution of energy intake across food groups without a single dominant source, thereby classified as the diversified type.
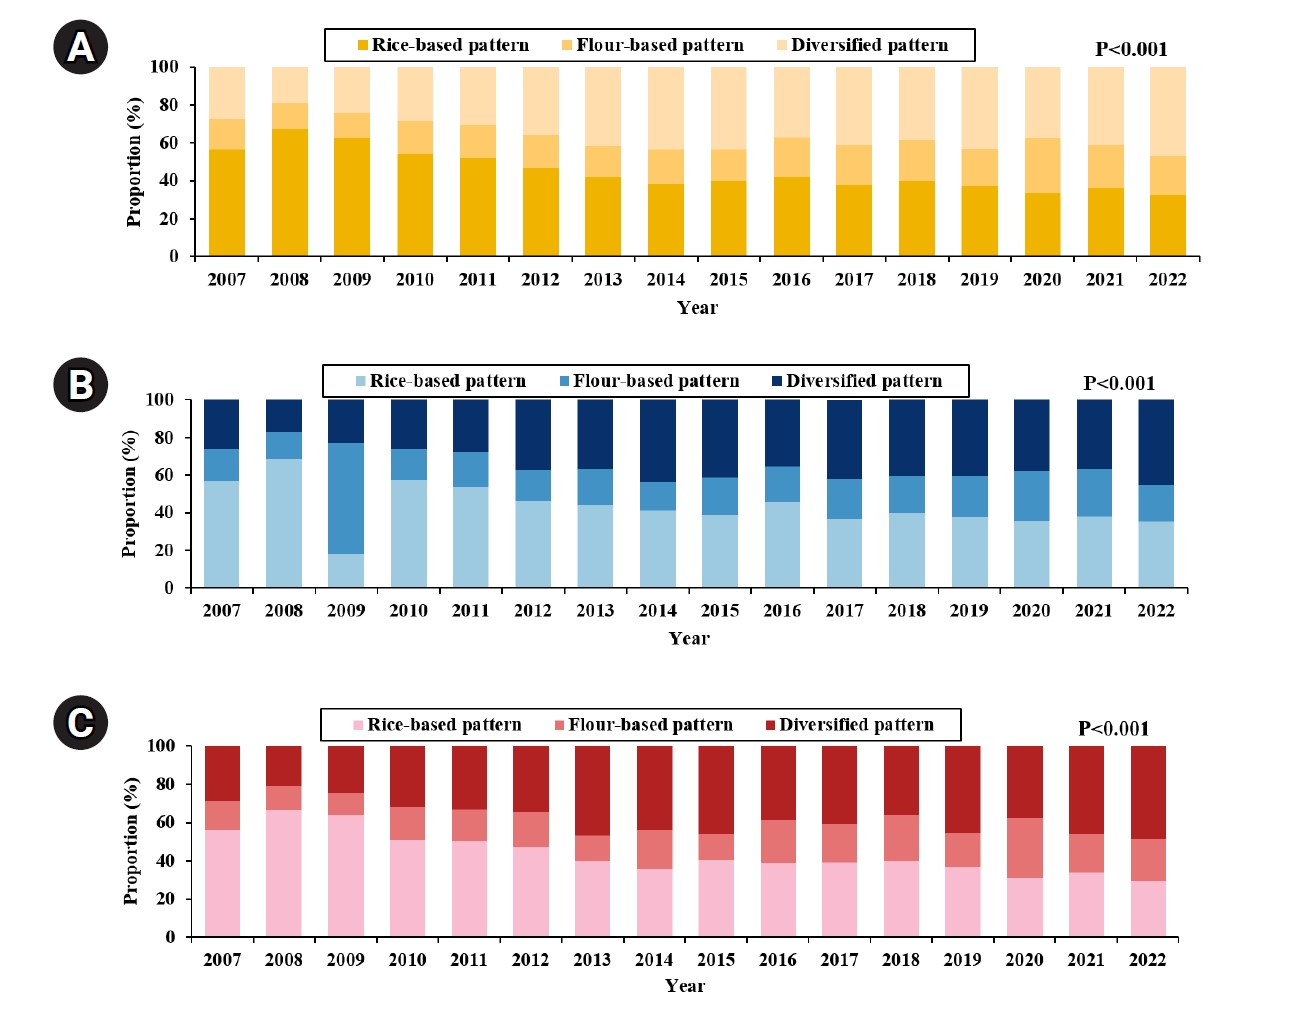
Secular trends in the distribution of the three dietary patterns (rice-based pattern, flour-based pattern, and diversified type) from 2007 to 2022 were examined overall and by sex (
Fig. 1). The proportion of children classified into the rice-based pattern steadily declined from 56.6% in 2007 to 32.6% in 2022. Conversely, the diversified type showed a marked increase, rising from 27.3% to 47.0%, suggesting that the participants gradually shifted toward a more diversified dietary pattern. Meanwhile, the flour-based pattern increased modestly over time, from 16.1% to 20.4%, with 2020 showing the highest proportion.
When stratified by sex, similar trends were observed. Among boys, the proportion of those classified into the rice-based pattern decreased from 56.8% to 35.4%, whereas the diversified type demonstrated an increase, from 25.9% to 45.5% between 2007 and 2022. The proportion of those displaying the flour-based pattern varied yearly but remained higher in the later survey years than at baseline.
Among girls, the rice-based pattern showed a more pronounced decline, from 56.4% in 2007 to 29.7% in 2022. Meanwhile, the diversified-type demonstrated a substantial increase, from 28.7% to 48.5%. The flour-based pattern also exhibited an increase, from 14.9% to 21.8%, although fluctuations were observed across survey years. These findings indicate a long-term reduction in rice-based dietary habits accompanied by an increase in diversified-type, with distinct trajectories observed between sexes.
Sociodemographic characteristics by dietary pattern
Tables 2 and
3 list the sociodemographic characteristics of dietary pattern groups among boys and girls, respectively. In boys, the mean age was highest in the flour-based pattern group (9.46 years) and lowest in the diversified-type group (8.90 years), demonstrating a significant difference across the dietary pattern groups (P<0.001). Household income also differed according to dietary pattern. The proportion of low-income participants was highest in the rice-based pattern group (28.0%), whereas the proportion of high-income participants was relatively higher in the flour-based pattern and diversified-type groups (24.2% and 24.8%, respectively).
Regarding BMI percentile classification, obesity was most prevalent in the flour-based pattern group (12.28%). Breakfast and dinner skipping was most common in the flour-based pattern group (18.34% and 3.13%, respectively). Daily eating out was most frequent in the diversified-type group (29.74%). Moreover, the rice-based pattern group had the highest proportion of supplement users (16.47%).
Among girls, the mean age was highest in the flour-based pattern group (9.42 years) and lowest in the rice-based pattern group (9.05 years). Household income patterns differed across dietary patterns. The diversified-type group had the highest proportion of high-income participants (26.7%), whereas the rice-based pattern group had the highest proportion of low-income participants (28.0%).
BMI percentile classification revealed that obesity was most prevalent in the diversified-type group (10.12%). Breakfast skipping was most frequent in the flour-based pattern group (20.5%), whereas dinner skipping was most prevalent in the diversified-type group (4.15%). Daily eating out was most common in the flour-based pattern group (33.42%). Moreover, the diversified-type group had the highest proportion of dietary supplement users (17.92%).
Nutrient intake by dietary pattern
Tables 4 and
5 present nutrient intakes across dietary patterns among boys and girls according to multivariable-adjusted models, respectively. Daily energy intake was 1,828.52 to 2,098.61 kcal among boys and 1,567.25 to 1,813.09 kcal among girls, indicating differences across dietary patterns.
In boys, the intake of all nutrients, except for carbohydrate, iron, vitamin A, and carotene, differed significantly according to dietary pattern. The diversified type was associated with relatively higher intakes of both macronutrients and micronutrients. Regarding macronutrient energy distribution, the rice-based pattern group had the highest proportion of energy derived from carbohydrates (65.5%), whereas the diversified-type group had the highest proportions derived from fat (27.0%) and protein (14.7%). A similar trend was observed among girls. The intake of all nutrients, except for vitamin A and thiamin, differed significantly across dietary patterns.
Post hoc pairwise comparisons (
Tables 4 and
5) further indicated that for most nutrients (e.g., energy, protein, fat, and calcium intake, and the percentage of energy from carbohydrate, fat, and protein), all three dietary patterns differed significantly. For phosphorus, potassium, and niacin, the diversified type differed significantly from both the rice-based and flour-based patterns, which did not differ significantly from each other. Conversely, for carbohydrate, riboflavin, and vitamin C, differences were less consistent between sexes, with the rice-based pattern generally differing from at least one of the other two patterns.
To assess whether the associations between sociodemographic/lifestyle characteristics and dietary patterns remained consistent in more recent years, we reanalyzed such associations in the 2018–2022 survey subsample (n=2,416) (
Table S1). Most variables (household income status, physical activity, and pediatric BMI percentile) showing significant associations in the full 2007–2022 sample were no longer statistically significant in the smaller, more recent subsample. Skipping dinner remained significantly associated with dietary pattern in boys and girls (P=0.025 and P=0.014, respectively). Meanwhile, taking dietary supplements remained significantly associated with dietary pattern among girls only (P=0.016). In the recent subsample, associations for household education and vigorous physical activity could not be estimated because of insufficient cell variation. Overall, while the association between meal-skipping behavior and dietary pattern appeared more robust throughout the entire study period, most of the sociodemographic associations observed over time should be interpreted with some caution when applying them to the current dietary and socioeconomic context.
DISCUSSION
This study identified three distinct dietary patterns among South Korean primary school–aged children: rice-based, flour-based, and diversified-type patterns. Factors such as age, household income, meal-skipping behaviors, physical activity, eating-out frequency, dietary supplement use, and nutrient intake significantly differed between these three dietary patterns. Overall, children following the diversified type tended to demonstrate more favorable nutritional profiles and healthier lifestyle behaviors; in contrast, those in the rice-based and flour-based patterns showed relatively less healthy dietary and behavioral characteristics. In secular trend analyses, the rice-based pattern showed a gradual decline, whereas the diversified type exhibited an increase between 2007 and 2022; however, sex-specific differences were observed.
These renamed patterns help clarify the secular trends observed in this study. The rice-based and diversified-type patterns were defined according to the dominant source of dietary energy rather than a broad East-West dietary orientation. Thus, the steady decline in the rice-based pattern and the corresponding rise in the diversified type most plausibly reflect that the dominance of refined white rice gradually declined in children’s diets and that energy intake tended to be distributed more evenly across food groups rather than shifting away from “Western” foods per se. This interpretation aligns with broader secular changes in the South Korean food environment. For example, dietary variety and food availability increased in relation to continued socioeconomic development over the study period. At each survey wave, the dietary patterns were derived independently using the same clustering approach; correspondingly, the consistent direction of this trend across 16 years and across both sexes further supports the interpretation that it represents not an artifact of cluster labeling but a genuine shift in children’s dietary behavior.
Age differed significantly across dietary pattern groups, with children in the flour-based pattern being the oldest. This finding may reflect developmental changes during late childhood, when children gradually become more independent in food selection and increasingly exposed to food environments outside the home [
2]. Given that independent eating behaviors increase with age, older school-aged children and adolescents are more likely to consume convenience foods and commercially prepared meals than the younger ones [
3,
11].
Household income level was also significantly associated with dietary patterns. Children belonging to higher-income households were more frequently found in the diversified-type group, whereas those belonging to low-income households were more often noted in the rice-based pattern group. Consistent with our findings, previous studies demonstrated that socioeconomic status influences dietary quality and meal environments among children [
10,
11]. In addition, children from higher-income households are more likely to consume breakfast regularly and maintain healthier dietary habits than those from lower-income households [
12,
13].
Likewise, meal-skipping behaviors differed significantly across the dietary patterns. Breakfast skipping was most prevalent in both sexes in the flour-based pattern group. Among school-aged children and adolescents, breakfast skipping has been consistently associated with poorer dietary quality, irregular eating patterns, and inadequate micronutrient intake [
14,
15]. Regular breakfast consumption has also been linked to improved cognitive performance and academic achievement among children [
15,
16]. Therefore, the risk of unfavorable nutritional and behavioral outcomes during childhood may increase in the flour-based pattern group, who skipped breakfast the most.
Eating-out frequency also varied across dietary patterns. The flour-based pattern and diversified-type groups reported higher frequencies of daily eating out than the rice-based pattern group. Frequent eating out among children is associated with increased consumption of energy-dense and commercially prepared foods [
3,
5]. In South Korea, eating-out behaviors among children may also reflect broader family lifestyle patterns and food environment changes.
Dietary supplement use differed substantially across dietary patterns, with lower use observed mostly in the flour-based pattern group. In children, dietary supplement use has been associated with parental health awareness, socioeconomic status, and overall dietary quality [
17]. Therefore, children without taking dietary supplements in the flour-based pattern group may have parents who paid less attention to balanced nutritional intake or who prioritized protein-rich food intake rather than overall dietary quality.
In addition, significant differences in vigorous physical activity were observed only among boys. Participation in vigorous physical activity was highest among boys in the rice-based pattern group and lowest among those in the flour-based pattern group. Physical activity levels among children have been associated with dietary behaviors, energy intake, and body weight status [
18]. Given that regular physical activity during childhood is important for healthy growth and obesity prevention, these findings suggest that dietary interventions should consider not only food intake but also lifestyle behaviors.
Regarding weight status, pediatric BMI percentile differed significantly according to dietary patterns among boys only. Meanwhile, girls in the flour-based pattern group demonstrated relatively higher levels of perceived overweight status than their actual obesity prevalence. These findings suggest that body weight awareness increased during late childhood and that body image concerns began to emerge before adolescence [
19,
20]. Distorted body image perception during childhood may contribute to unhealthy eating behaviors and inappropriate weight-control practices [
20].
Nutrient intake also significantly differed across dietary patterns. The diversified-type group showed relatively higher intakes of protein, calcium, potassium, riboflavin, niacin, and vitamin C than the other dietary pattern groups. Conversely, the rice-based pattern exhibited a higher proportion of energy intake derived from carbohydrates. Similar to our findings, previous studies showed that Westernized dietary patterns are associated with poorer dietary quality and imbalanced nutrient intake among children and adolescents [
3,
5]. Although the diversified type demonstrated relatively favorable nutrient profiles, calcium intake remained below the recommended levels, consistent with previous reports indicating insufficient calcium intake among South Korean youth [
21].
Regarding the overall characteristics of each dietary pattern in this study, the diversified type represented the most nutritionally balanced dietary behavior, whereas the flour-based pattern represented a nutritionally vulnerable group characterized by frequent meal-skipping, lower micronutrient intake, and less favorable lifestyle behaviors. Dietary habits established during childhood have been associated with future obesity risk and long-term health outcomes; therefore, early nutritional interventions targeting school-aged children are essential [
1,
2].
This study has several limitations. First, the KNHANES exhibits a cross-sectional design; consequently, causal relationships between dietary patterns and health-related factors could not be established. Second, dietary intake was assessed using a single 24-hour dietary recall, which may not accurately reflect participants’ usual dietary intake, thereby subjected to recall bias. This limitation may be particularly relevant in children because their day-to-day dietary intake tends to fluctuate more than that of adults; thus, estimates of individual dietary patterns may be less stable. Third, dietary pattern analysis using cluster analysis involves subjective decisions regarding food grouping and the number of clusters selected; both may influence the resulting patterns. Additionally, dietary patterns were derived from the percentage of energy contributed by each food group; this approach may disproportionately reflect high-energy food groups and underrepresent low-energy but nutritionally important food groups such as vegetables and seaweed. This limitation should be considered when interpreting the nutritional adequacy of the identified patterns. Furthermore, residual confounding factors that were not fully controlled may have affected the observed associations. Nevertheless, this study also has several strengths. For example, we utilized nationally representative KNHANES data that were collected over a long-term period. We also comprehensively evaluated dietary patterns alongside sociodemographic and lifestyle characteristics among South Korean primary school–aged children.
Conclusion
Three distinct dietary patterns were identified among South Korean primary school–aged children, each showing unique sociodemographic, lifestyle, and nutritional characteristics. The diversified type demonstrated relatively balanced nutritional profiles, closely aligning with KDRI recommendations. Meanwhile, the rice-based pattern exhibited a higher proportion of energy intake derived from carbohydrates, as well as relatively inadequate energy intake among older girls. In contrast, the flour-based pattern may represent a nutritionally vulnerable group characterized by older age, frequent meal-skipping, lower dietary supplement use, relatively lower micronutrient intake, and greater body weight awareness. Furthermore, the rice-based pattern showed a marked secular decline, while the diversified type demonstrated an increase between 2007 and 2022, suggesting that South Korean primary school–aged children have gradually shifted toward more diversified dietary habits. Accordingly, age- and time-sensitive nutrition policies are needed.
When developing nutritional recommendations and intervention programs for school-aged children, healthcare providers should consider not only dietary patterns but also the socioeconomic status, lifestyle behaviors, sex, age, and nutritional needs of this population. By receiving early nutritional interventions and establishing healthy eating habits during childhood, these children may experience better long-term health outcomes.
NOTES
-
Author Contributions
Conceptualization: AD, MK. Methodology: all authors. Formal analysis: AD. Data curation: AD, DS. Supervision: MK. Writing - original draft: AD. Writing - review & editing: all authors. All authors read and approved the final manuscript.
-
Conflict of Interest
None.
-
Funding
This work was supported by Duksung Women’s University Research Grant (No. 3000011284).
-
Data availability
The data that support the findings of this study are publicly available and can be accessed from the Korea Disease Control and Prevention Agency (http://www.kdca.go.kr).
Supplementary materials
Table S1.
Sensitivity analysis of associations between sociodemographic/lifestyle characteristics and dietary patterns, restricted to the most recent KNHANES survey years (2018–2022)
cnr-2026-0018-Supplementary-Table-S1.pdf
Fig. 1.Secular trends in dietary patterns by sex among South Korean primary school–aged children: (A) total, (B) boys, and (C) girls.
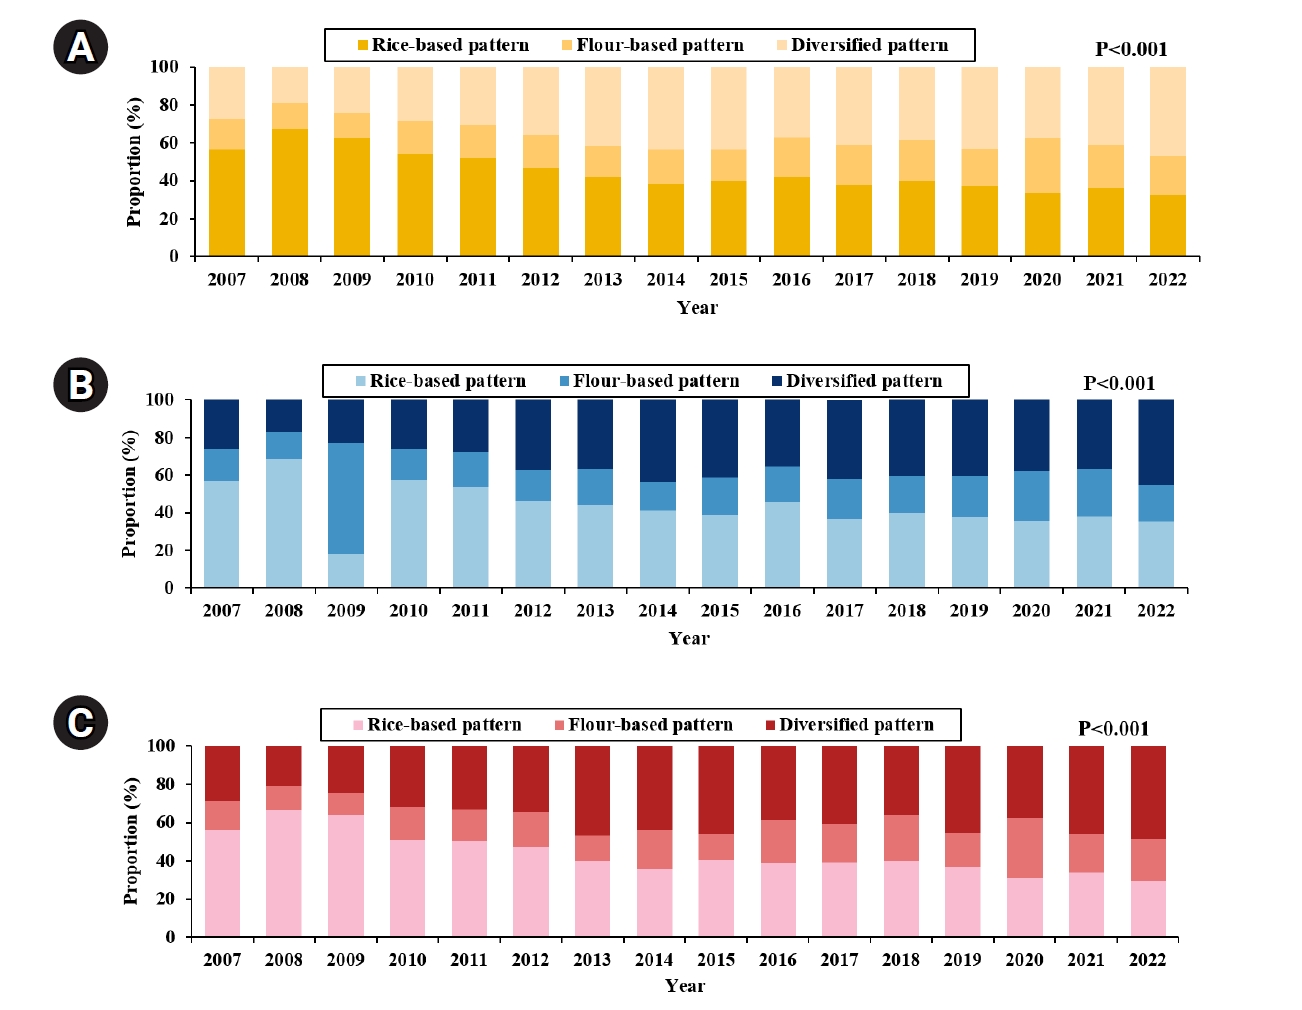
Table 1.Mean percentage of energy intake from food groups according to dietary patterns among South Korean primary school–aged children
Table 1.
|
Food group (% energy) |
Rice-based pattern |
Flour-based pattern |
Diversified type |
P-value |
|
Whole grains |
2.4±4.0 |
2.4±5.1 |
3.8±7.2 |
<0.001 |
|
Refined white rice |
45.6±10.0 |
21.2±10.4 |
22.1±8.2 |
<0.001 |
|
Refined grains |
1.9±3.2 |
1.7±3.2 |
2.3±4.4 |
<0.001 |
|
Wheat flour and bread |
4.2±5.9 |
5.1±6.8 |
14.0±12.3 |
<0.001 |
|
Processed white rice |
0.2±1.5 |
0.4±2.5 |
0.5±3.1 |
<0.001 |
|
Flour-based foods |
2.4±5.1 |
26.8±10.6 |
2.8±4.7 |
<0.001 |
|
Potatoes |
1.1±2.7 |
1.4±3.4 |
1.2±3.4 |
0.0012 |
|
Sweets |
2.5±4.6 |
3.0±6.0 |
4.6±8.0 |
<0.001 |
|
Legumes and tofu, soymilk |
1.7±2.7 |
1.1±2.3 |
1.4±2.4 |
<0.001 |
|
Nuts |
0.5±1.5 |
0.4±1.8 |
0.5±1.8 |
0.059 |
|
Unsalted vegetables |
2.3±3.1 |
1.9±3.1 |
2.3±3.9 |
<0.001 |
|
Kimchi and salted vegetables |
0.9±1.1 |
0.7±0.9 |
0.7±0.9 |
<0.001 |
|
Seasonings |
2.3±2.9 |
2.4±2.6 |
2.5±2.8 |
0.009 |
|
Fruits |
3.7±5.5 |
3.6±5.4 |
4.2±6.0 |
<0.001 |
|
Red meat |
6.2±7.3 |
5.5±7.2 |
8.7±10.2 |
<0.001 |
|
Poultry |
1.8±4.4 |
2.1±5.0 |
3.3±7.2 |
<0.001 |
|
Processed meat |
1.1±2.9 |
1.0±3.2 |
1.3±3.3 |
0.002 |
|
Eggs |
2.8±3.7 |
2.5±3.4 |
2.6±3.6 |
<0.001 |
|
Fish and seafood |
2.8±3.7 |
2.0±3.5 |
2.4±3.7 |
<0.001 |
|
Seaweed |
0.4±0.8 |
0.2±0.5 |
0.3±0.5 |
<0.001 |
|
Milk and dairy products |
8.8±7.9 |
8.6±8.5 |
12.0±10.1 |
<0.001 |
|
Plant oils |
2.8±2.7 |
3.0±3.2 |
3.3±3.4 |
<0.001 |
|
Animal oils |
0.1±0.4 |
0.1±0.4 |
0.2±0.7 |
<0.001 |
|
Fruit juices |
0.4±1.7 |
0.5±1.9 |
0.8±2.4 |
<0.001 |
|
Tea and coffee |
0.0±0.0 |
0.0±0.1 |
0.0±0.0 |
0.037 |
|
Sugar-sweetened beverages |
1.2±2.9 |
2.5±4.4 |
2.4±4.4 |
<0.001 |
Table 2.Sociodemographic and lifestyle characteristics of South Korean primary school–aged boys based on dietary patterns
Table 2.
|
Characteristic |
All (n=5,286) |
Rice-based pattern (n=2,535) |
Flour-based pattern (n=969) |
Diversified type (n=1,782) |
P-value |
|
Age (y) |
9.14±0.03 |
9.19±0.04 |
9.46±0.06 |
8.90±0.05 |
<0.001 |
|
Region of residence |
|
|
|
|
0.423 |
|
City |
44.5 (0.79) |
43.8 (1.14) |
46.6 (1.86) |
44.3 (1.35) |
|
|
Rural |
55.5 (0.79) |
56.2 (1.14) |
53.4 (1.86) |
55.7 (1.35) |
|
|
Household income status |
|
|
|
|
0.005 |
|
Low |
25.5 (0.70) |
28.0 (1.05) |
26.3 (1.64) |
21.7 (1.14) |
|
|
Lower-middle |
25.74 (0.70) |
25.9 (1.03) |
24.2 (1.67) |
26.4 (1.21) |
|
|
Upper-middle |
25.32 (0.68) |
24.1 (0.98) |
25.3 (1.63) |
27.1 (1.19) |
|
|
High |
23.44 (0.66) |
22.1 (0.93) |
24.2 (1.57) |
24.8 (1.15) |
|
|
Vigorous physical activitya)
|
|
|
|
|
0.015 |
|
No |
14.6 (1.20) |
11.75 (1.38) |
20.5 (3.32) |
17.2 (2.75) |
|
|
Yes |
85.4 (1.20) |
88.3 (1.38) |
79.5 (3.32) |
82.8 (2.75) |
|
|
Pediatric BMI percentile |
|
|
|
|
0.020 |
|
Underweight (<5th percentile) |
7.72 (0.49) |
9.16 (0.85) |
4.76 (0.76) |
7.57 (0.77) |
|
|
Normal weight (5th to <95th percentile) |
81.35 (0.74) |
78.78 (1.18) |
82.96 (1.53) |
80.82 (1.19) |
|
|
Obesity (≥95th percentile) |
11.39 (0.68) |
12.06 (0.93) |
12.28 (1.38) |
11.60 (0.99) |
|
|
Perceived weight status |
|
|
|
|
0.320 |
|
Underweight |
35.29 (0.76) |
35.56 (1.09) |
32.55 (1.72) |
36.43 (1.30) |
|
|
Normal weight |
35.70 (0.76) |
35.58 (1.09) |
35.75 (1.81) |
35.87 (1.30) |
|
|
Overweight |
29.0 (0.74) |
28.86 (1.07) |
31.70 (1.75) |
27.70 (1.23) |
|
|
Skipping breakfast |
13.11 (0.55) |
10.78 (0.73) |
18.34 (1.47) |
13.47 (0.97) |
<0.001 |
|
Skipping dinner |
2.15 (0.23) |
1.55 (0.28) |
3.13 (0.66) |
2.44 (0.40) |
0.027 |
|
Having breakfast with family |
89.64 (0.57) |
88.56 (0.84) |
90.06 (1.36) |
91.05 (0.95) |
0.150 |
|
Having dinner with family |
95.89 (0.33) |
95.81 (0.47) |
95.45 (0.81) |
96.23 (0.57) |
0.709 |
|
Eating-out frequency |
|
|
|
|
0.007 |
|
None |
0.72 (0.11) |
0.71 (0.16) |
0.41 (0.26) |
0.58 (0.15) |
|
|
1–6 times/wk |
70.39 (0.72) |
74.80 (1.03) |
70.86 (1.72) |
69.68 (1.26) |
|
|
Daily |
27.23 (0.72) |
24.49 (1.02) |
28.73 (1.71) |
29.74 (1.25) |
|
|
Taking dietary supplement |
39.11 (0.78) |
16.47 (0.59) |
7.70 (0.45) |
14.94 (0.56) |
<0.001 |
Table 3.Sociodemographic and lifestyle characteristics of South Korean primary school–aged girls based on dietary patterns
Table 3.
|
Characteristic |
All (n=4,887) |
Rice-based pattern (n=2,272) |
Flour-based pattern (n=831) |
Diversified type (n=1,784) |
P-value |
|
Age (yr) |
9.12±0.03 |
9.05±0.04 |
9.42±0.07 |
9.06±0.05 |
<0.001 |
|
Region of residence |
|
|
|
|
0.912 |
|
City |
46.1 (0.82) |
46.2 (1.22) |
45.5 (2.01) |
46.5 (1.35) |
|
|
Rural |
53.9 (0.82) |
53.8 (1.22) |
54.5 (2.01) |
53.5 (1.35) |
|
|
Household income status |
|
|
|
|
0.005 |
|
Low |
24.94 (0.73) |
28.0 (1.13) |
23.9 (1.77) |
21.8 (1.12) |
|
|
Lower-middle |
25.8 (0.73) |
25.6 (1.07) |
25.9 (1.79) |
26.0 (1.20) |
|
|
Upper-middle |
24.6 (0.71) |
24.2 (1.04) |
24.1 (1.73) |
25.5 (1.18) |
|
|
High |
24.66 (0.70) |
22.2 (0.98) |
26.1 (1.74) |
26.7 (1.20) |
|
|
Vigorous physical activitya)
|
|
|
|
|
0.240 |
|
No |
22.12 (1.46) |
20.79 (1.95) |
19.76 (3.57) |
25.95 (2.82) |
|
|
Yes |
77.88 (1.46) |
79.21 (1.95) |
80.24 (3.57) |
74.05 (2.82) |
|
|
Pediatric BMI percentile |
|
|
|
|
0.649 |
|
Underweight (<5th percentile) |
9.59 (0.60) |
9.40 (0.90) |
9.65 (1.39) |
9.76 (0.96) |
|
|
Normal weight (5th to <95th percentile) |
81.35 (0.77) |
82.21 (1.18) |
82.09 (1.76) |
80.12 (1.25) |
|
|
Obesity (≥95th percentile) |
8.99 (0.56) |
8.39 (0.86) |
8.25 (1.23) |
10.12 (0.93) |
|
|
Perceived weight status |
|
|
|
|
0.920 |
|
Underweight |
32.67 (0.77) |
32.55 (1.14) |
32.36 (1.88) |
32.99 (1.27) |
|
|
Normal weight |
44.02 (0.82) |
44.77 (1.22) |
43.78 (2.01) |
43.24 (1.34) |
|
|
Overweight |
23.31 (0.70) |
22.68 (1.03) |
23.86 (1.73) |
23.77 (1.15) |
|
|
Skipping breakfast |
14.80 (0.61) |
10.95 (0.79) |
20.5 (1.67) |
16.67 (1.05) |
<0.001 |
|
Skipping dinner |
2.90 (0.27) |
1.58 (0.31) |
3.67 (0.67) |
4.15 (0.54) |
<0.001 |
|
Having breakfast with family |
90.15 (0.55) |
89.21 (0.84) |
89.98 (1.34) |
91.50 (0.88) |
0.178 |
|
Having dinner with family |
96.18 (0.33) |
96.29 (0.50) |
95.15 (4.84) |
96.53 (3.47) |
0.318 |
|
Eating-out frequency |
|
|
|
|
0.002 |
|
None |
0.72 (0.15) |
0.85 (0.23) |
0.62 (0.42) |
0.52 (0.21) |
|
|
1–6 times/wk |
70.94 (0.76) |
74.12 (1.09) |
65.96 (1.91) |
69.57 (1.25) |
|
|
Daily |
28.33 (0.75) |
25.03 (1.08) |
33.42 (1.89) |
29.91 (1.24) |
|
|
Taking dietary supplement |
25.7 (0.9) |
15.25 (0.60) |
7.71 (0.46) |
17.92 (0.64) |
<0.001 |
Table 4.Least-square means and 95% confidence intervals for nutrient intake and energy distribution according to dietary patterns among South Korean primary school–aged boys
Table 4.
|
Nutrient |
Rice-based pattern (n=2,535) |
Flour-based pattern (n=969) |
Diversified type (n=1,782) |
P-value |
|
Energy (kcal) |
1,828.52a (1,799.66–1,857.38) |
1,985.29b (1,933.99–2,036.59) |
2,098.61c (2,059.81–2,137.42) |
<0.001 |
|
Protein (g) |
64.84a (63.60–66.89) |
69.20b (66.91–71.48) |
77.21c (75.30–79.12) |
<0.001 |
|
Fat (g) |
40.64a (39.66–41.63) |
56.44b (54.36–58.52) |
64.81c (63.03–66.59) |
<0.001 |
|
Carbohydrate (g) |
297.53a (292.75–302.30) |
298.51a (290.86–306.16) |
300.29a (294.24–306.33) |
0.761 |
|
Calcium (mg) |
477.71a (464.74–490.68) |
456.69b (437.53–475.86) |
599.97c (580.93–619.01) |
<0.001 |
|
Phosphorus (mg) |
1,052.18b (1,032.25–1,071.11) |
883.24b (854.03–912.45) |
1,169.13a (1,145.73–1,192.53) |
<0.001 |
|
Iron (mg) |
11.20a (10.12–12.29) |
11.19a (10.50–11.88) |
12.01a (11.53–12.50) |
0.070 |
|
Potassium (mg) |
2,281.59b (2,237.39–2,327.39) |
2,301.61b (2,214.13–2,389.09) |
2,552.74a (2,495.25–2,610.23) |
<0.001 |
|
Vitamin A (RAE) |
603.99a (564.77–643.71) |
559.74a (501.13–618.36) |
687.90a (625.03–750.77) |
0.587 |
|
Carotene (μg) |
2,644.22a (2,420.44–2,868.00) |
2,322.10a (1,980.06–2,664.13) |
2,697.49a (2,325.60–3,069.39) |
0.211 |
|
Thiamin (mg) |
1.286a (1.253–1.319) |
1.40b (1.34–1.45) |
1.49c (1.45–1.54) |
<0.001 |
|
Riboflavin (mg) |
1.272a (1.242–1.301) |
1.61b (1.54–1.67) |
1.63b (1.59–1.67) |
<0.001 |
|
Niacin (mg) |
12.69b (12.38–12.99) |
12.52b (12.02–13.01) |
14.50a (14.10–14.88) |
<0.001 |
|
Vitamin C (mg) |
70.46a (67.46–73.45) |
70.74ab (64.69–76.79) |
76.34b (72.32–80.35) |
0.050 |
|
Carbohydrate (%EN) |
65.51a (65.13–65.89) |
60.64b (60.04–61.24) |
57.78c (57.22–58.33) |
<0.001 |
|
Fat (%EN) |
19.37a (18.93–19.81) |
24.85b (24.25–25.45) |
27.01c (26.47–27.54) |
<0.001 |
|
Protein (%EN) |
14.17a (14.01–14.32) |
13.84b (13.59–14.10) |
14.72c (14.48–14.95) |
<0.001 |
Table 5.Least-square means and 95% confidence intervals for nutrient intake and energy distribution according to dietary patterns among South Korean primary school–aged girls
Table 5.
|
Nutrient |
Rice-based pattern (n=2,272) |
Flour-based pattern (n=831) |
Diversified type (n=1,784) |
P-value |
|
Energy (kcal) |
1,567.25a (1,541.41–1,593.09) |
1,731.29b (1,685.28–1,777.31) |
1,813.09c (1,776.65–1,849.53) |
<0.001 |
|
Protein (g) |
54.83a (53.77–55.88) |
58.83b (56.83–60.83) |
65.14c (63.26–67.01) |
0.003 |
|
Fat (g) |
34.30a (33.41–35.20) |
47.77b (45.91–49.63) |
54.36c (52.81–55.91) |
<0.001 |
|
Carbohydrate (g) |
258.11a (253.78–262.45) |
265.81ab (258.46–273.17) |
265.60b (260.15–271.06) |
<0.001 |
|
Calcium (mg) |
414.78a (401.59–427.97) |
456.69b (437.53–475.86) |
520.30c (505.34–535.26) |
<0.001 |
|
Phosphorus (mg) |
896.53b (880.11–912.95) |
883.24b (854.03–912.45) |
1,001.15a (979.39–1,022.92) |
<0.001 |
|
Iron (mg) |
9.31b (8.99–9.63) |
9.59b (8.97–10.21) |
10.38a (10.00–10.77) |
<0.001 |
|
Potassium (mg) |
2,032.27b (1,986.93–2,077.62) |
2,093.05b (2,018.58–2,167.53) |
2,272.22a (2,214.39–2,330.06) |
<0.001 |
|
Vitamin A (RAE) |
508.26a (484.15–532.38) |
471.89a (438.66–505.12) |
610.21a (558.87–661.55) |
0.993 |
|
Carotene (μg) |
2,251.76b (2,108.77–2,394.74) |
1,928.22a (1,749.81–2,106.62) |
2,417.85b (2,116.51–2,719.20) |
<0.001 |
|
Thiamin (mg) |
1.09a (1.06–1.11) |
1.19b (1.14–1.24) |
1.29c (1.25–1.33) |
0.269 |
|
Riboflavin (mg) |
1.08a (1.05–1.11) |
1.39b (1.33–1.45) |
1.41b (1.37–1.45) |
<0.001 |
|
Niacin (mg) |
10.66b (10.42–10.90) |
10.67b (10.26–11.08) |
12.42a (12.03–12.82) |
<0.001 |
|
Vitamin C (mg) |
69.30b (66.04–72.57) |
69.24b (62.09–76.40) |
79.54a (74.72–84.35) |
0.004 |
|
Carbohydrate (%EN) |
66.22a (65.82–66.63) |
61.85b (61.13–62.56) |
59.05c (58.53–59.58) |
<0.001 |
|
Fat (%EN) |
19.61a (19.29–19.93) |
24.39b (23.80–24.99) |
26.29c (25.88–26.70) |
<0.001 |
|
Protein (%EN) |
14.01a (13.85–14.17) |
13.56b (13.29–13.82) |
14.36c (14.14–14.58) |
<0.001 |
REFERENCES
- 1. World Health Organization. Diet, nutrition and the prevention of chronic diseases. World Health Organization; 2003.
- 2. Craigie AM, Lake AA, Kelly SA, Adamson AJ, Mathers JC. Tracking of obesity-related behaviours from childhood to adulthood: a systematic review. Maturitas 2011;70:266-84.
- 3. Liberali R, Kupek E, Assis MA. Dietary patterns and childhood obesity risk: a systematic review. Child Obes 2020;16:70-85.
- 4. Hu FB. Dietary pattern analysis: a new direction in nutritional epidemiology. Curr Opin Lipidol 2002;13:3-9.
- 5. Newby PK, Tucker KL. Empirically derived eating patterns using factor or cluster analysis: a review. Nutr Rev 2004;62:177-203.
- 6. Kweon S, Kim Y, Jang MJ, et al. Data resource profile: the Korea National Health and Nutrition Examination Survey (KNHANES). Int J Epidemiol 2014;43:69-77.
- 7. Jeon JH, Seo MY, Kim SH, Park MJ. Dietary supplement use in Korean children and adolescents, KNHANES 2015-2017. Public Health Nutr 2021;24:957-64.
- 8. Tak E, Kim J, Lee H, Kang M. Secular trends in dietary patterns among Korean adults: using data from the 2007-2022 Korea National health and nutrition examination survey. Nutr J 2025;24:163.
- 9. Lee JS, Kim H, Shin S. Socioeconomic disparities in dietary patterns among Korean children and adolescents. Public Health Nutr 2021;24:3721-30.
- 10. Darmon N, Drewnowski A. Does social class predict diet quality? Am J Clin Nutr 2008;87:1107-17.
- 11. Eicher-Miller HA, Boushey CJ, Bailey RL, Yang YJ. A scoping review of household factors contributing to dietary quality and food security in low-income households with school-age children. Adv Nutr 2023;14:1135-53.
- 12. Rampersaud GC, Pereira MA, Girard BL, Adams J, Metzl JD. Breakfast habits, nutritional status, body weight, and academic performance in children and adolescents. J Am Diet Assoc 2005;105:743-60.
- 13. Hartline-Grafton H, Levin M. Breakfast and school-related outcomes in children and adolescents in the US: a literature review and its implications for school nutrition policy. Curr Nutr Rep 2022;11:653-64.
- 14. Deshmukh-Taskar PR, Nicklas TA, O'Neil CE, Keast DR, Radcliffe JD, Cho S. The relationship of breakfast skipping and type of breakfast consumption with nutrient intake and weight status in children and adolescents: the National Health and Nutrition Examination Survey 1999-2006. J Am Diet Assoc 2010;110:869-78.
- 15. Seura T, Nagai R, Yamazaki S, Bando K, Sogawa M. The impact of skipping breakfast on academic performance in youths: a meta-analysis of observational studies. J Nutr Sci Vitaminol (Tokyo) 2025;71:339-48.
- 16. World Health Organization. Global recommendations on physical activity for health. World Health Organization; 2010.
- 17. Revranche M, Biscond M, Husky MM. Investigating the relationship between social media use and body image among adolescents: a systematic review. Encephale 2022;48:206-18.
- 18. Lunde C, Gattario KH. Performance or appearance?: young female sport participants’ body negotiations. Body Image 2017;21:81-9.
- 19. Ministry of Health and Welfare; The Korean Nutrition Society. 2020 Dietary Reference Intakes for Koreans. Ministry of Health and Welfare; 2020.
- 20. Ambrosini GL. Childhood dietary patterns and later obesity: a review of the evidence. Proc Nutr Soc 2014;73:137-46.
- 21. Boushey C, Ard J, Bazzano L, et al. Dietary patterns and growth, size, body composition, and/or risk of overweight or obesity: a systematic review. USDA Nutrition Evidence Systematic Review; 2020.