ABSTRACT
-
Objective
This study aimed to adapt a systematic methodology for estimating the added sugars content of South Korean foods and to assess added sugars intake among South Koreans using data from the 2023 Korea National Health and Nutrition Examination Survey.
-
Methods
The estimation procedure developed for Australian foods was modified and applied to South Korean foods. Added sugars content was estimated for 2,314 food items using the modified 7-step estimation procedure, and these estimates were applied to dietary intake data. Mean contents of total sugars and estimated added sugars were summarized by food group. Mean intakes of total sugars and added sugars, the percentage of energy from added sugars, and the prevalence of excessive added sugars intake were estimated.
-
Results
According to the modified estimation procedure, 53.0% of food items were assigned to step 1 (total sugars=0) or step 2 (non-added sugars food groups) and therefore assigned added sugars content of zero, while 20.9% were assigned to step 3, in which all total sugars were classified as added sugars. Mean added sugars intake was 30.7 g/day, accounting for about half of total sugars intake (58.3 g/day). Overall, 21.2% of the population had energy intake from added sugars exceeding 10% of total energy intake, with the highest proportion observed among adolescent girls (37.9%).
-
Conclusion
This study provides the first nationally representative estimates of added sugars intake among South Koreans by adapting a systematic methodology. These findings provide a robust foundation for monitoring population-level added sugars intake and informing the development of targeted policies and interventions to reduce added sugars intake.
-
Keywords: Sugars; Dietary sugars; Nutrition surveys; Republic of Korea
INTRODUCTION
Added sugars are associated with an increased risk of various adverse health outcomes, including obesity [
1], hypertension [
2], cardiovascular disease [
3], and dental caries [
4]. Thus, overconsumption of added sugars is a significant global public health concern that has prompted initiatives to reduce their intake. The 2025–2030 Dietary Guidelines for Americans state that no amount of added sugars is recommended and advise that each meal contain no more than 10 g of added sugars [
5]. The 2025 Korean Dietary Reference Intakes (KDRIs) recommend limiting added sugars to no more than 10% of total energy intake [
6]. Added sugars include sugars that are added during the processing of foods, foods packaged as sweeteners, sugars from syrups and honey, and sugars from concentrated fruit or vegetable juices [
7].
Reliable and current data on added sugars intake are essential for informing evidence-based public health policy decisions. However, monitoring population-level intake remains challenging despite recommendations to limit added sugars intake. In South Korea, as in many other countries, added sugars content is not declared on food labels. Therefore, added sugars content is not included in the publicly available South Korean food composition database. Although the Ministry of Food and Drug Safety (MFDS) reports sugars intake from processed foods [
8], the reported intake does not directly correspond to added sugars intake. The Korea National Health and Nutrition Examination Survey (KNHANES) reports only total sugars intake without distinguishing added sugars.
Various methods have been developed to estimate added sugars content of foods, most of which involve subtracting natural sugars from total sugars to derive estimates of added sugars. In 2015, Louie et al. [
9] proposed a systematic methodology for estimating added sugars content of foods. This methodology consists of a 10-step procedure for estimating added sugars from the total sugars content of Australian foods. The approach demonstrated good replicability and has since been widely adopted in the Australian Food and Nutrient Database (AUSNUT) and in studies adapting the methodology for other countries, enabling the estimation of both food-level added sugars content and population-level added sugars intake [
10-
14].
This study aimed to adapt a systematic methodology to estimate the added sugars content of South Korean foods and to estimate added sugars intake among South Koreans using data from the 2023 KNHANES. The estimation procedure proposed by Louie et al. [
9], which was not directly applicable to South Korean foods, was modified to estimate the added sugars content of food items reported in KNHANES. These estimates were then applied to the dietary intake data to estimate population-level added sugars intake.
METHODS
Ethics statement
The Institutional Review Board of the Korea Disease Control and Prevention Agency (KDCA) approved the KNHANES protocol (No. 2022-11-16-R-A), and written informed consent was obtained from all participants. As this study used publicly available KNHANES data, it qualified for exemption from additional Institutional Review Board approval. All procedures were conducted in accordance with the principles of the Declaration of Helsinki.
Definition of added sugars
Despite the consistent public health guidance to limit sugar intake, recommendations differ in the type of sugars they address. The World Health Organization (WHO) focuses on free sugars, whereas many national dietary guidelines emphasize added sugars or total sugars [
15]. Some countries, including the United States and Brazil, also require added sugars to be declared separately on food labels [
7,
16]. WHO defines free sugars as all monosaccharides and disaccharides added to foods and beverages by the manufacturer, cook, or consumer, as well as sugars naturally present in honey, syrups, fruit juices, and fruit juice concentrates [
17]. Within this framework, added sugars are a subset of free sugars and exclude naturally occurring sugars. The 2025 KDRIs describe added sugars as sugars that are added during food processing and preparation [
6], aligning conceptually with the subset of free sugars.
However, several limitations have been identified when sugars are classified from a health perspective [
15,
18,
19]. The distinction between added sugars and free sugars is primarily determined by whether sugars in juiced or pureed fruits and vegetables are included in the definition [
18,
20]. Added sugars are defined based on whether sugars are intentionally added during food processing or preparation [
6,
7,
21], whereas free sugars are defined according to whether they are present outside the cellular matrix [
21]. As a result, sugars naturally occurring in a food may be classified as added sugars when extracted or concentrated and used as sweetening ingredients in other foods, such as syrups, honey, or fruit juice concentrates [
15]. Processing methods such as blending and pureeing may partially disrupt the cellular structure of fruits and vegetables, producing intermediate forms in which intrinsic sugars and free sugars coexist [
18,
19]. Consequently, in foods such as fruit and vegetable juices, purées, and smoothies, distinguishing intrinsic sugars from free sugars can be difficult [
15,
22]. In this study, added sugars were defined as sugars intentionally incorporated during food processing or preparation, consistent with the common definitions used by the WHO [
21], United States Food and Drug Administration (FDA) [
7], and KDRIs [
6].
The added sugars content of foods was estimated based on this definition. Honey, sugar, and syrups were considered added sugars because they are generally used as sweetening ingredients added to foods or beverages. In contrast, unsweetened 100% fruit or vegetable juices, purées, and smoothies were considered to contain no added sugars. For sweetened versions of these products, added sugars content was estimated by subtracting the total sugars content of the corresponding unsweetened product from that of the sweetened product. Thus, the definition used in this study was consistent with the concept of added sugars as sugars intentionally incorporated during food processing or preparation, while remaining distinct from the broader concept of free sugars.
Data source and participants
This study analyzed data from the 2023 KNHANES, an annual nationwide survey that provides nationally representative information on the health and nutritional status of the South Korean population. A total of 6,786 participants aged ≥1 year who completed a 24-hour dietary recall were included in the analysis.
Estimation of added sugars content of foods
The methodology proposed by Louie et al. [
9] was the first systematic approach developed to estimate added sugars content, using a structured protocol that assesses reliability and transferability [
23]. In South Korea, a database on the added sugars content of processed foods was developed in 2015 using manufacturer-provided information and ingredient formulation data [
20]; however, this database has not been made publicly available. In this study, Louie’s methodology was adapted to estimate the added sugars content of South Korean food items reported in the 2023 KNHANES. This approach enables added sugars content to be estimated in the absence of preexisting data on added sugars content or ingredient formulation information.
Louie’s methodology consists of a 10-step procedure for estimating the added sugars content of individual food items, comprising six objective decision steps (steps 1–6) and four subjective decision steps (steps 7–10) [
9]. The procedure operates in a stepwise manner, with each step defining specific food groups. Food items move sequentially to the next step if the criteria of the previous step are not met. In the final step, for food items whose added sugars content cannot be estimated through the preceding steps (steps 1–9), 50% of the total sugars content is assigned as added sugars. As each step uses a different estimation method, the resulting added sugars content may differ depending on the step used [
23].
Because the original procedure was developed for Australian foods, it was modified in this study to fit the KNHANES data and to estimate the added sugars content of South Korean foods. This adaptation of the original procedure is consistent with previous studies that adapted the 10-step procedure according to country-specific food characteristics and data availability [
10-
14]. In the present study, steps requiring detailed recipe information and ingredient formulation data (steps 4, 8, and 9) were excluded because of data limitations. As a result, a modified 7-step procedure was used, with the original stepwise logic retained. The modified procedure comprised five objective decision steps (steps 1–5) and two subjective decision steps (steps 6–7).
The modified procedure was subsequently applied to all 2,314 food items reported in the 2023 KNHANES to systematically estimate the added sugars content of each item according to the stepwise procedure. Food items were assigned to the appropriate step according to the food groups defined at each step of the procedure. For each item, the ingredient information and the total sugars content of its main ingredients were reviewed where available to support step assignment. Food items not explicitly covered in the original procedure, mainly traditional South Korean foods, were assigned to the most appropriate steps based on their characteristics.
For example, unsweetened rice cakes, such as garaetteok and jeolpyeon, were assigned to step 2, which includes food groups considered to contain no added sugars. In contrast, foods were assigned to step 3, in which total sugars were assumed to be 100% added sugars, when they did not contain ingredients generally containing naturally occurring sugars—such as fruits, chocolate, dairy products, or milk solids—and when their main ingredients contained less than 1 g of total sugars per 100 g. Accordingly, powdered sweetened tea products, such as ginger tea and red ginseng tea, and fishery processed products, such as fish sausage and jeotgal, were assigned to step 3 because their main ingredients contain little or no naturally occurring sugars. This approach was applied to minimize potential overestimation due to naturally occurring sugars.
After the added sugars content had been estimated for all food items by one researcher, the initial step assignments were independently reviewed by a second researcher. When discrepancies in step assignments were identified, the ingredient information of the food item and the total sugars content of its main ingredients were re-examined, and the final step assignment was determined by consensus between the two researchers. Details of each step in the modified 7-step procedure are provided in
Table 1.
The added sugars content of individual food items was applied to 24-hour dietary recall data from the 2023 KNHANES to estimate added sugars intake. The mean intakes of total sugars and estimated added sugars were presented by sex and age group. The percentage of total energy intake contributed by added sugars was derived using an energy conversion factor of 4 kcal/g. In addition, based on the 2025 KDRIs recommendation to limit added sugars intake to no more than 10% of total energy intake, the prevalence of added sugars intake exceeding 10% of total energy intake was estimated.
Statistical analysis
Mean contents of total sugars and estimated added sugars in foods were presented by food group as means with standard deviations, along with estimated added sugars as a percentage of total sugars. The energy, total sugar, and added sugars intakes were presented as the weighted means with standard errors. The percentage of energy intake from added sugars and the prevalence of excessive intakes were presented as the weighted percentages with standard errors. Sampling weights were applied to account for the complex sampling design of the 2023 KNHANES. All data analyses were conducted using SAS ver. 9.4 (SAS Institute Inc.).
RESULTS
Application of the added sugars content estimation procedure
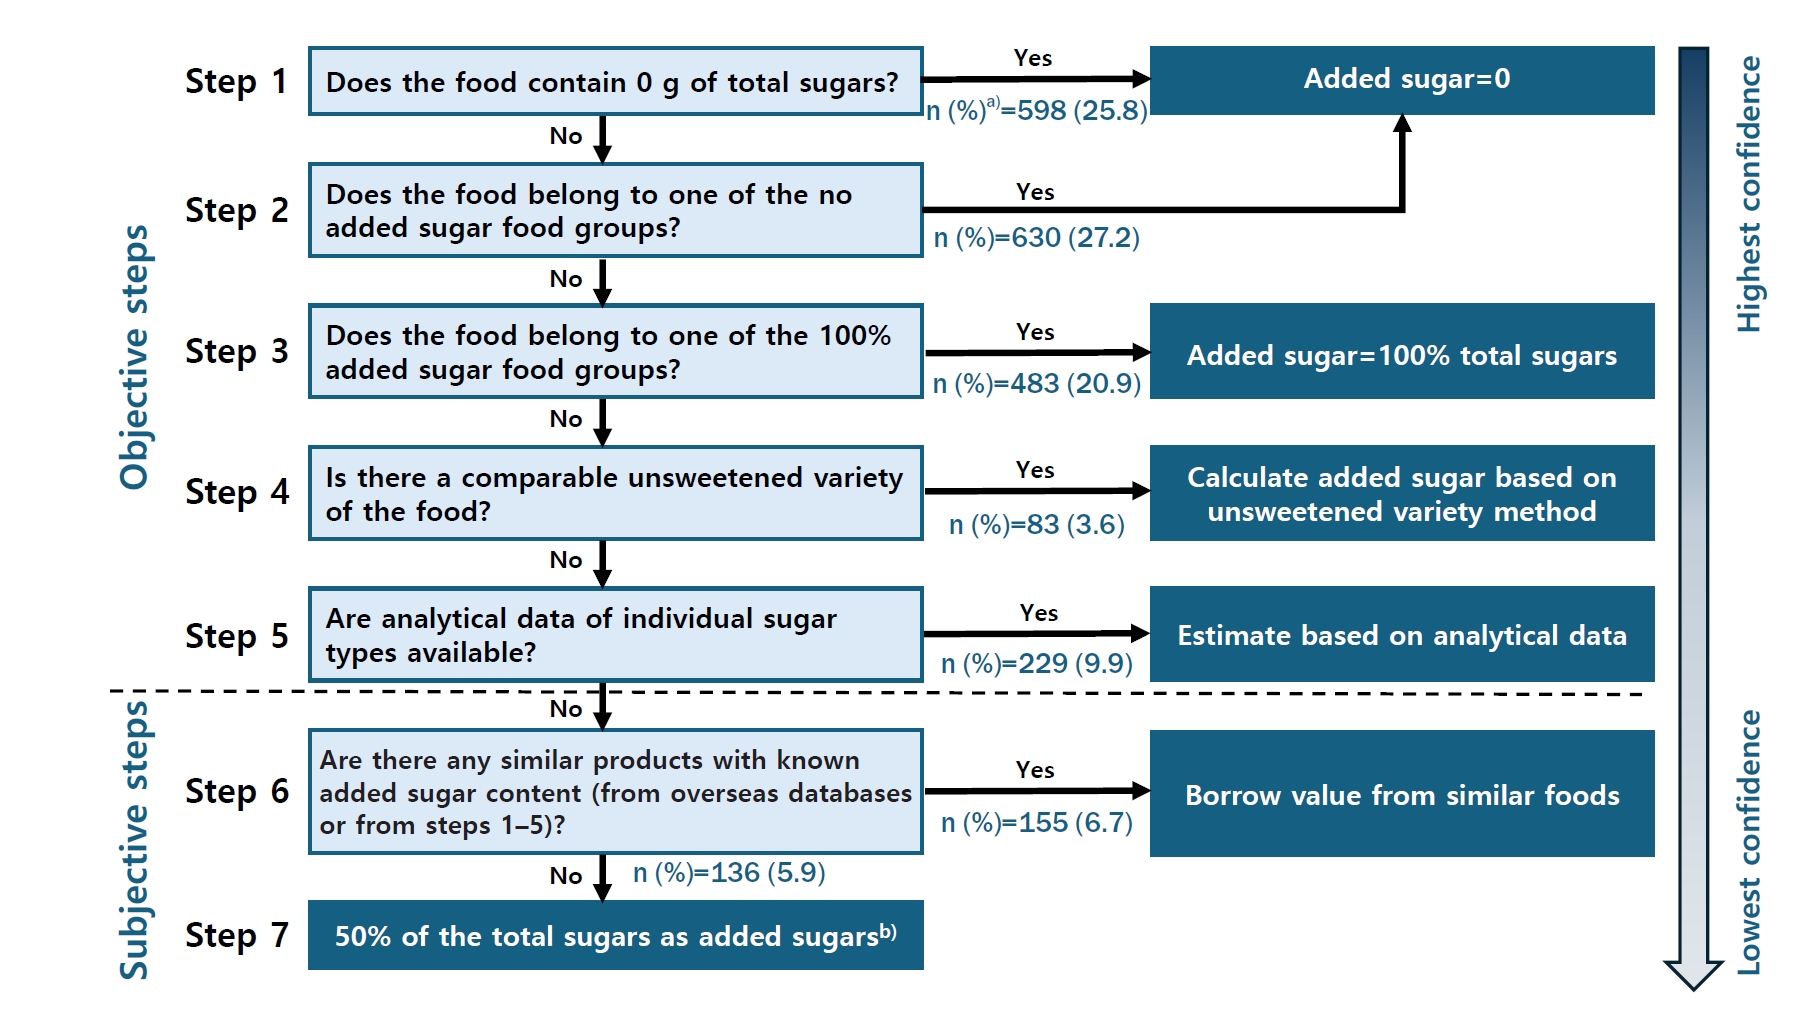
Fig. 1 illustrates the distribution of food items according to the modified 7-step procedure. Of the total food items, 87.4% were assigned to objective steps (steps 1–5), while 12.6% were assigned to subjective steps (steps 6–7). Added sugars were estimated for 73.9% of food items using the most straightforward steps (steps 1–3). Of all food items, 53.0% were assigned to step 1 (total sugars content=0) or step 2 (non-added sugars food groups) and were therefore estimated to contain no added sugars. In contrast, 20.9% were assigned to step 3 as foods in which 100% of total sugars were considered added sugars.
Added sugars content of the South Korean foods
Table 2 shows the mean contents of total sugars and estimated added sugars by food group, based on estimates for individual food items obtained using the modified procedure presented in
Table 1. Food groups were classified according to the Korean Food Code classification system for processed foods established by the MFDS [
24]. Excluding ‘Saccharides’ (68.3 g/100 g) and ‘Honey and Pollen Products’ (63.5 g/100 g), the food groups with the highest mean added sugars content were ‘Cocoa Products or Chocolates’ (44.6 g/100 g) and ‘Jams’ (43.8 g/100 g), with added sugars accounting for 88.1% and 86.9% of total sugars, respectively. ‘Confectioneries, Breads or Rice Cakes’ contain 20.7 g/100 g of added sugars, corresponding to 91.7% of total sugars. ‘Frozen Confectioneries’ (13.4 g/100 g), ‘Processed Agricultural Foods’ (10.9 g/100 g), and ‘Beverages’ (10.5 g/100 g) also contained more than 10 g/100 g of added sugars.
Added sugars intake among the South Korean population
Table 3 presents the mean daily intakes of total sugars and added sugars by sex and age group. In the overall population, mean total sugars intake was 58.3 g/day, while mean estimated added sugars intake was 30.7 g/day, accounting for more than half of total sugars intake. Total sugars intake was consistent with the intake reported by the MFDS using the same 2023 KNHANES data [
8], but it differed from that reported by the KDCA, which applied standardization in its analysis [
25].
The mean intake of added sugars was higher in men (34.3 g/day) than in women (27.2 g/day). The highest mean intake of added sugars was observed among adolescents aged 12–18 years (45.3 g/day), followed by young adults aged 19–29 years (40.7 g/day). Across all sex and age subgroups, the highest mean intakes of both total sugars and added sugars were observed in adolescent boys aged 12–18 years, at 73.9 g/day and 49.3 g/day, respectively.
Table 4 shows the percentage of total energy intake from added sugars and the prevalence of excessive added sugars intake by sex and age group. Added sugars contributed 6.8% of total energy intake in the overall population. The percentage of total energy intake from added sugars was comparable between men (6.7%) and women (6.8%). The percentage of total energy intake from added sugars exceeded 8% among children, adolescents, and young adults, specifically those aged 6–11 years (8.6%), 12–18 years (9.1%), and 19–29 years (8.7%). Notably, the percentage of energy intake from added sugars was highest among adolescent girls aged 12–18 years (9.7%), approaching the 10% limit recommended by the 2025 KDRIs [
6].
Excessive added sugars intake was defined as consuming more than 10% of total energy from added sugars, in accordance with the 2025 KDRIs recommendation [
6]. In the overall population, 21.2% of participants consumed more than 10% of their total energy from added sugars. More than one-third of adolescents aged 12-18 years (34.5%) and young adults aged 19-29 years (33.8%) exceeded the recommended limit. Within these age groups, women had a higher prevalence of excessive added sugars intake than men, with a prevalence greater than 37.0% among women aged 12-18 years (37.9%) and 19-29 years (37.0%).
DISCUSSION
In the present study, the methodology proposed by Louie et al. [
9] was applied to estimate added sugars intake among South Koreans using data from the 2023 KNHANES. Because nationally representative estimates of added sugars intake in the South Korean population have never been reported before, the sugars intake from processed foods reported by the MFDS [
8] was used as a reference for comparison. However, the sugars content of processed foods is inherently higher than their added sugars content, as processed foods contain both added and naturally occurring sugars. For example, flavored strawberry yogurt contains lactose from milk, sugars derived from strawberries, most of which are present as free sugars because of cellular disruption during processing, and sugars added during processing; therefore, its total sugars content exceeds its added sugars content. Accordingly, the estimated added sugars intake in this study was lower than the total sugars intake from processed foods reported by the MFDS [
8]. In the overall population, the mean estimated added sugars intake was 30.7 g/day, which was somewhat lower than the reported sugars intake from processed foods (35.5 g/day).
This study revealed that the prevalence of excessive added sugars intake was 21.2%, indicating that one in five South Koreans exceeds the recommended upper limit of 10% of total energy intake from added sugars. Excessive intake was particularly prevalent among school-aged children (6–11 years), adolescents (12–18 years), and young adults (19–29 years), among whom approximately one-third were classified as excessive consumers of added sugars. The highest prevalence was observed in adolescent girls (37.9%). A previous study using data from the 2019–2024 KNHANES examined the proportion of the population whose sugar intake from processed foods exceeded the WHO recommendation of less than 10% of total energy intake [
26]. The study reported higher proportions of excessive sugar intake from processed foods among children, adolescents, and young adults, with the highest proportion observed among school-aged girls (41.4%), consistent with the findings of the present study. In the United States and the United Kingdom, adolescents and young adults also exhibit higher added sugars intake than other age groups [
27,
28].
The primary sources of sugar intake from processed foods among the South Korean population are beverages, confectionery, and bakery products [
8,
26], which likely contribute to the high intake of added sugars among children and adolescents. In particular, beverages are a major source of added sugars, with the highest intake observed among adolescents and young adults [
29,
30]. In the present study, the estimated added sugars content was relatively high in these food groups, and added sugars accounted for a substantial proportion of total sugars. Therefore, these food groups may contribute considerably to added sugars intake, reflecting both their high added sugars content and their larger consumption among children and adolescents.
These findings indicate the need for targeted nutrition strategies for population subgroups with high added sugars intake, particularly adolescent girls. For these groups, nutrition education should focus on identifying the major dietary sources of added sugars, including sugar-sweetened beverages, confectionery, and bakery products, rather than simply emphasizing the reduction of total sugar intake. Practical strategies may include replacing sugar-sweetened beverages with water or unsweetened beverages and substituting sweetened snacks with healthier alternatives, such as fresh fruits. School-based nutrition education programs tailored to adolescents may also help promote healthier food choices and reduce the habitual consumption of snacks and beverages high in added sugars. These approaches may support more effective clinical nutrition guidance and targeted strategies to reduce added sugars intake among high-risk groups.
In the present study, a modified 7-step procedure based on the methodology proposed by Louie et al. [
9] was applied to estimate added sugars intake among South Koreans. Several studies have examined Louie’s methodology, and it has been demonstrated to be reliable and valid [
10-
14]. When Louie’s methodology was applied by two independent researchers to estimate the added sugars content of foods, a high level of inter-rater agreement was observed [
23]. Furthermore, the estimated values derived using Louie’s methodology demonstrated excellent agreement with the added sugars values declared on food labels [
13]. However, selecting the most appropriate step for each food item inherently involves a degree of subjective judgment [
23].
This issue may be particularly relevant when adapting the original Australian procedure to South Korean food items, because some South Korean foods are not covered in the original procedure and require contextual interpretation based on their ingredients and processing methods. For example, unsweetened rice cakes were assigned to step 2, which includes non-added sugars food groups, because they are considered to contain no added sugars. In contrast, fishery processed products, such as fish sausage and jeotgal, were assigned to step 3, in which total sugars are assumed to be 100% added sugars, because their main ingredients contain little or no naturally occurring sugars.
To reduce potential bias in assigning food items to certain steps, assignments were based on available ingredient information and the total sugars content of the main ingredients, and were systematically reviewed. Nevertheless, because the procedure was modified to reflect both data availability and South Korean dietary culture, further validation is needed to assess its reliability. In particular, inter-rater reliability was not quantitatively assessed in the present study, although discrepancies were resolved by consensus between the two researchers. Therefore, future studies should evaluate the reliability, reproducibility, and validity of the modified procedure.
It should be noted that added sugars intake in the present study was estimated using data from a single 24-hour dietary recall and therefore may not reflect individuals’ usual intake. Although the 24-hour dietary recall method is widely used in national dietary surveys, it captures dietary intake for only one day and may be subject to recall bias. In particular, for items that are frequently consumed but may be easily omitted during recall, such as snacks and beverages, the amounts consumed may be systematically under- or over-reported. If added sugars intake was under- or overestimated, the proportion of individuals exceeding 10% of total energy intake from added sugars, which was calculated based on these estimates, may also have been affected. Considering these limitations, the estimates presented in this study should be interpreted as daily intake estimates based on 1-day dietary data, and the prevalence of excessive added sugars intake should be interpreted with caution.
To the best of our knowledge, this is the first study to estimate added sugars intake among South Koreans using nationally representative data from the KNHANES. Unlike previous studies that focused on total sugars or sugars derived from processed foods, this study specifically estimated added sugars intake, which constitutes the primary target of sugar reduction policies. This distinction is significant because evidence-based policies for sugar reduction require population-level monitoring of added sugars intake. The mandatory declaration of added sugars on food labels, as implemented in the United States [
7], could provide a foundation for effective sugar reduction policies, including regulatory measures targeting the added sugars content of processed foods. Moreover, further research identifying the major dietary sources of added sugars across population subgroups would contribute to the development of targeted sugar reduction strategies. At a time when the introduction of a sugar tax is being actively debated in South Korea, the findings of this study provide timely, policy-relevant evidence on the current status of added sugars intake in the South Korean population, offering an important scientific basis for public health decision-making.
NOTES
-
Author Contributions
Conceptualization: JY. Data curation: YN, LH. Formal analysis: YN, LH. Funding acquisition: JY. Investigation: YN, LH. Methodology: JY, CK. Project administration: JY. Visualization: YN. Writing - original draft: YN, LH. Writing - review & editing: JY, CK. All authors read and approved the final manuscript.
-
Conflict of Interest
None.
-
Funding
This research was supported by grants from the SNU Health Culture Initiative.
-
Data availability
The datasets analyzed in this study are available in the Korea National Health and Nutrition Examination Survey (KNHANES) repository, https://knhanes.kdca.go.kr/knhanes.
Fig. 1.Decision-making flowchart for estimating added sugars content in food items. a)Number (%) of food items assigned to each step according to the National Food Code in the food intake data from 2023 Korea National Health and Nutrition Examination Survey. b)The proportion of total energy intake contributed by food items classified in step 7 was 1.7% from all food items.
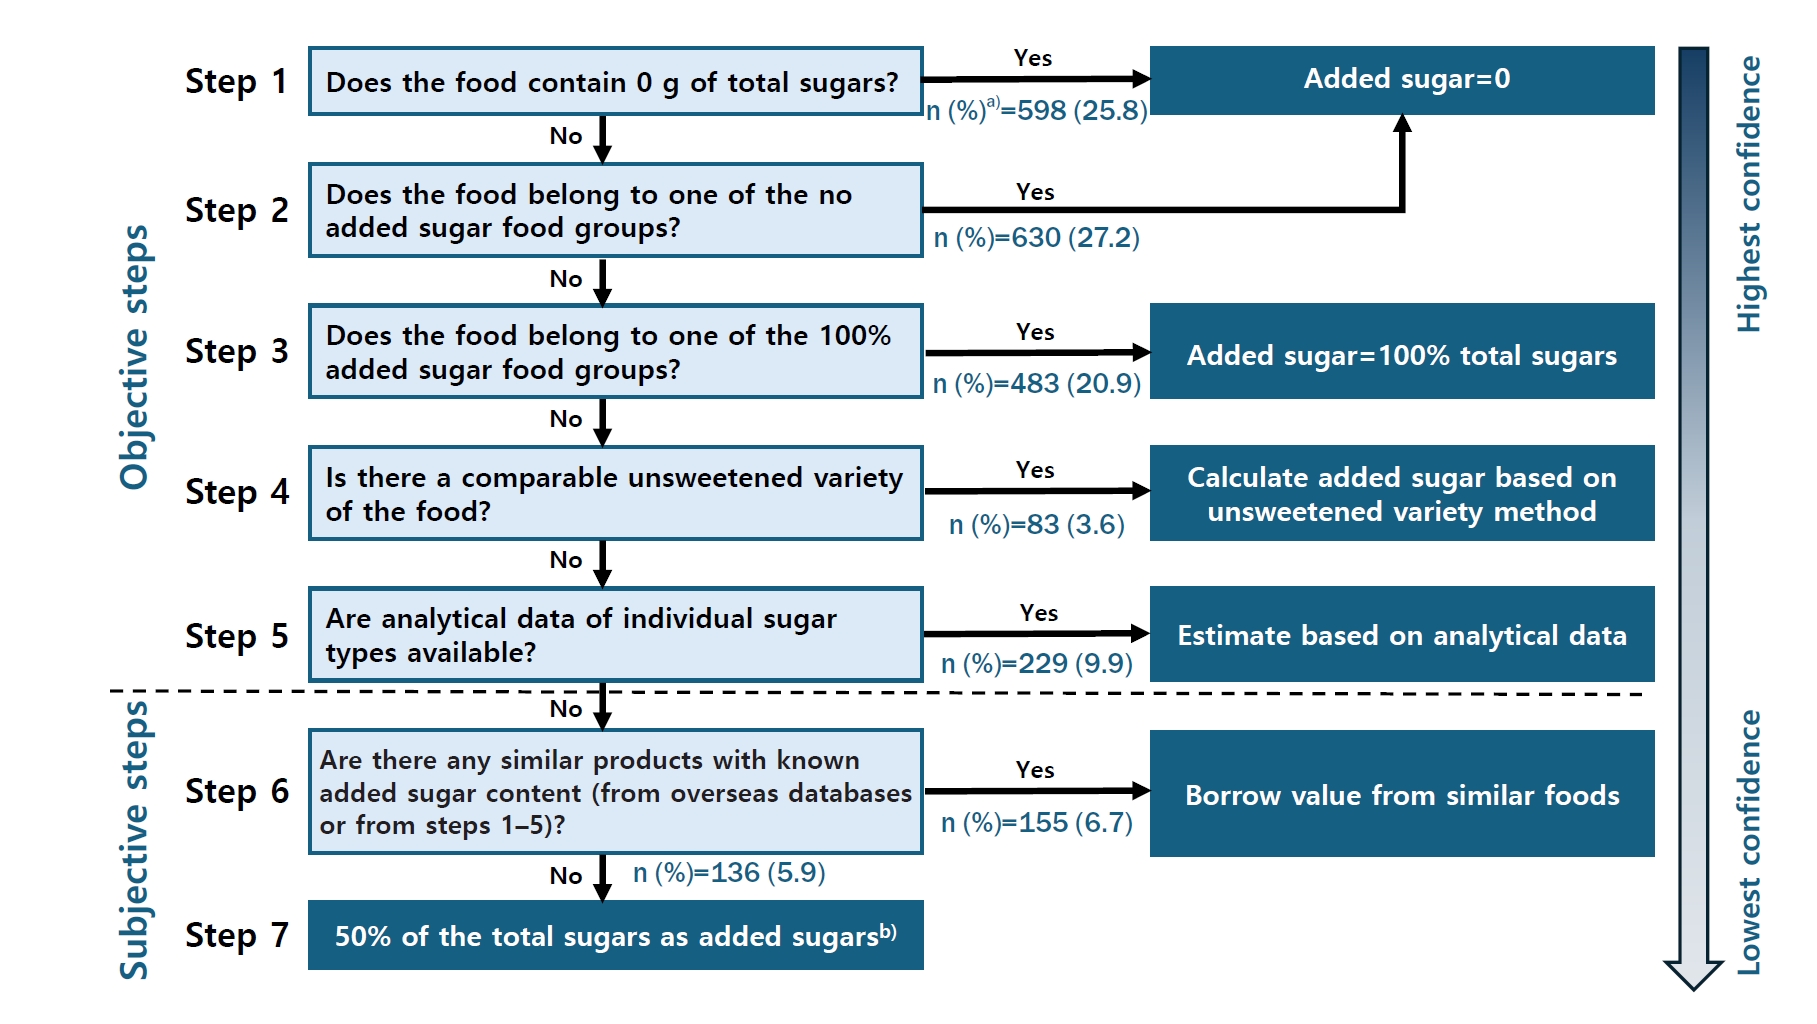
Table 1.Modified procedure for estimating added sugars content in food items reported in 2023 KNHANES
Table 1.
|
Procedurea)
|
|
|
|
Step 1. Assign 0 g added sugars to foods with 0 g total sugars. |
|
|
|
Step 2. Assign 0 g added sugars to foods in the following food groups: |
|
|
|
(a) Fresh or minimally processed fruits, vegetables, legumes, nuts, and seeds (including boiled, blanched, dried, or frozen forms). |
|
|
|
(b) Fresh or minimally processed meat and seafood (including boiled, blanched, dried, or frozen forms). |
|
|
|
(c) All plain cereal grains, rice, flours, noodles, and pasta. |
|
|
|
(d) All spices and herbs. |
|
|
|
(e) All fats and oils. |
|
|
|
(f) Eggs and egg products (except egg-based desserts). |
|
|
|
(g) Plain breads (such as English muffins, bagels, pizza bases, and naan). |
|
|
|
(h) Plain pastries without filling. |
|
|
|
(i) Plain rice cake (such as Garaetteok and Jeolpyeon). |
|
|
|
(j) 100% fruit/vegetable juice and juice/cordial base sweetened with artificial sweeteners only. |
|
|
|
(k) Non-sweetened alcoholic beverages, coffee, and tea. |
|
|
|
(l) Non-sugar-sweetened milk and dairy products. |
|
|
|
(m) Intensely sweetened jam and beverage base (without added sugar). |
|
|
|
Step 3. Assign 100% of total sugars as added sugars for foods in the following food groups: |
|
|
|
(a) Breakfast cereals and cereal bars that do not contain fruit, chocolate, or dairy products. |
|
|
|
(b) Savory biscuits, sweet biscuits, cakes and buns, donuts and batter-based products that do not contain fruit, chocolate or dairy products. |
|
|
|
(c) Processed meat (such as bacon and sausages) and seafood (such as fish sausages and fermented seafood including Jeotgal) |
|
|
|
(d) Crumbed/battered meat and seafood. |
|
|
|
(e) All confectionery except those containing dairy products such as fudge and chocolate. |
|
|
|
(f) Frozen desserts that do not contain fruit, chocolate, or dairy products. |
|
|
|
(g) Regular soft drinks, sports drinks, flavored water and non-fruit-based energy drinks. |
|
|
|
(h) Coffee and beverage base with no milk solids, dry or made up with water. |
|
|
|
(i) Soy beverages and soy yogurt without added fruits. |
|
|
|
(j) Honey, sugar and syrups. |
|
|
|
(k) Sauces, seasonings, dressings, stock powder and broths that do not contain fruit, chocolate, or dairy products. |
|
|
|
Step 4. Calculation based on comparison with values from the unsweetened variety. |
|
|
|
The amount of added sugars needed per 100 g (AS100 g) to sweeten the unsweetened product to achieve the final listed sugars content (STotal) is given by the following formula: |
|
|
|
AS100g=100(Sus-Stotal)Sus-100
|
|
|
|
where Sus is the total sugars content per 100 g of the unsweetened variety of the food. |
|
|
|
Step 5. Calculation based on analytical data from the KFCTb). |
|
|
|
When the target food item is available in the KFCT, its analytical values for total sugars, lactose, and maltose are used to estimate the added sugars content. If the target food item is not available in the KFCT, a similar food is selected for estimation. The added sugars content estimated using analytical data of the similar food must not exceed the total sugars content of the target food item. Based on the selected food (identical or similar), added sugars content was calculated as follows: |
|
|
|
(a) If analytical data for lactose are available and the ingredients do not include dried fruits or malted cereals, added sugars content is calculated as total sugars minus lactose. |
|
|
|
(b) If the food contains malted cereals and analytical data for both lactose and maltose are available, added sugars content is calculated as total sugars minus lactose and maltose. |
|
|
|
Step 6. Use borrowed values from similar products from steps 1–5 or from overseas databases. |
|
|
|
(a) The added sugars value is directly borrowed from a similar food identified in steps 1–5. |
|
|
|
(b) In the absence of a similar food from steps 1–5, the added sugars value is estimated using data from similar foods identified in the USDA Global Branded Food Products Database (GBFPD)c) and the Australian Food and Nutrient Database (AUSNUT)d). The added sugars content of the target food item is calculated as total sugars multiplied by the proportion of added sugars in a similar food. |
|
|
|
Step 7. Assign 50% of total sugars as added sugars. |
|
|
|
If estimation of added sugars content is impossible from Steps 1–6, then added sugars is assumed to be 50% of total sugars. |
|
|
Table 2.Mean contents of total sugars and added sugars by food group in this study
Table 2.
|
Food groupa)
|
No. of food itemsb)
|
Total sugars (g/100 g) |
Added sugars (g/100 g)c)
|
Added sugars as a percentage of total sugars (%) |
|
Saccharides |
21 |
68.3±32.9 |
68.3±32.9 |
100 |
|
Honey and pollen products |
7 |
63.5±21.3 |
63.5±21.3 |
100 |
|
Cocoa products or chocolates |
38 |
49.2±14.5 |
44.6±14.8 |
88.1 |
|
Jams |
11 |
50.5±6.8 |
43.8±10.5 |
86.9 |
|
Confectioneries, breads, or rice cakes |
302 |
21.9±18.3 |
20.7±18.2 |
91.7 |
|
Frozen confectioneries |
77 |
17.0±5.3 |
13.4±5.7 |
77.7 |
|
Processed agricultural foods |
92 |
13.6±13.2 |
10.9±12.9 |
61.3 |
|
Beverages |
263 |
13.9±17.6 |
10.5±15.6 |
73.7 |
|
Pickled foods or boiled foods |
42 |
9.8±14.8 |
8.9±14.7 |
73.1 |
|
Soy sauces and pastes |
37 |
8.0±11.0 |
7.7±11.1 |
88.8 |
|
Seasoning foods |
106 |
9.2±9.0 |
7.6±7.9 |
79.2 |
|
Milk products |
120 |
10.2±9.8 |
6.0±7.3 |
52.7 |
|
Prepared meals |
22 |
6.7±9.6 |
4.3±7.2 |
59.9 |
|
Processed fishery foods |
81 |
2.9±5.8 |
2.8±5.8 |
95.2 |
|
Processed meat products and packaged meats |
35 |
2.4±5.1 |
2.2±5.1 |
95.7 |
|
Alcoholic beverages |
56 |
1.4±3.5 |
0.8±2.0 |
43.6 |
|
Soybean curds or muk (starch jellies) |
14 |
0.2±0.3 |
0.0±0.1 |
12.5 |
|
Noodles |
31 |
0.9±1.7 |
0.0±0.0 |
0 |
|
Egg products |
10 |
0.1±0.1 |
0.0±0.0 |
0 |
|
Edible fats and oils |
30 |
0.0±0.0 |
0.0±0.0 |
NA |
Table 3.Mean intakes of total sugars and added sugars by sex and age group among South Koreans (2023 KNHANES)
Table 3.
|
Age group (yr) |
Number of participantsa)
|
Total sugars (g/day) |
Added sugars (g/day)b)
|
|
All |
Men |
Women |
All |
Men |
Women |
All |
Men |
Women |
|
All |
6,786 |
3,016 |
3,770 |
58.3±0.7 |
60.8±1.0 |
55.8±0.8 |
30.7±0.5 |
34.3±0.7 |
27.2±0.6 |
|
1–2 |
87 |
40 |
47 |
49.8±3.3 |
54.6±5.6 |
44.6±2.9 |
15.6±2.7 |
18.3±5.0 |
12.6±1.6 |
|
3–5 |
129 |
64 |
65 |
58.5±3.5 |
61.0±5.1 |
56.1±4.5 |
26.9±2.1 |
29.0±3.3 |
24.8±2.5 |
|
6–11 |
403 |
204 |
199 |
66.4±2.7 |
69.7±4.0 |
62.9±3.0 |
38.3±1.8 |
39.5±2.3 |
37.1±2.3 |
|
12–18 |
386 |
197 |
189 |
68.5±2.8 |
73.9±4.3 |
62.5±3.5 |
45.3±2.5 |
49.3±3.6 |
40.8±2.8 |
|
19–29 |
600 |
284 |
316 |
60.6±2.2 |
62.4±2.8 |
58.6±2.8 |
40.7±1.8 |
42.2±2.4 |
39.0±2.3 |
|
30–49 |
1,625 |
715 |
910 |
59.0±1.2 |
61.3±1.7 |
56.5±1.5 |
34.1±0.9 |
37.8±1.4 |
30.2±1.0 |
|
50–64 |
1,758 |
720 |
1,038 |
57.7±1.2 |
58.0±1.8 |
57.4±1.4 |
25.9±0.7 |
29.2±1.1 |
22.5±0.7 |
|
≥65 |
1,798 |
792 |
1,006 |
50.9±1.2 |
54.8±1.6 |
47.9±1.3 |
18.7±0.5 |
22.3±0.8 |
15.9±0.5 |
Table 4.Percentage of energy intake from added sugars and prevalence of excessive added sugars intake by sex and age group among South Koreans (2023 KNHANES)
Table 4.
|
Age group (yr) |
No. of participantsa)
|
Percentage of energy intake from added sugars (%)b)
|
Prevalence of excessive added sugars intake (%)c)
|
|
All |
Men |
Women |
All |
Men |
Women |
All |
Men |
Women |
|
All |
6,786 |
3,016 |
3,770 |
6.8±0.1 |
6.7±0.1 |
6.8±0.1 |
21.2±0.6 |
21.1±0.9 |
21.3±0.8 |
|
1–2 |
87 |
40 |
47 |
5.2±0.8 |
5.5±1.4 |
4.8±0.6 |
16.2±4.6 |
16.5±7.2 |
15.8±5.5 |
|
3–5 |
129 |
64 |
65 |
7.8±0.5 |
8.2±0.8 |
7.3±0.6 |
30.0±4.7 |
33.1±7.2 |
27.0±5.7 |
|
6–11 |
403 |
204 |
199 |
8.6±0.4 |
8.3±0.5 |
8.9±0.5 |
32.0±3.1 |
29.4±3.6 |
34.7±4.2 |
|
12–18 |
386 |
197 |
189 |
9.1±0.4 |
8.6±0.6 |
9.7±0.6 |
34.5±2.7 |
31.4±3.8 |
37.9±3.5 |
|
19–29 |
600 |
284 |
316 |
8.7±0.3 |
7.9±0.4 |
9.6±0.5 |
33.8±2.3 |
30.9±2.9 |
37.0±3.0 |
|
30–49 |
1,625 |
715 |
910 |
7.2±0.2 |
7.1±0.2 |
7.4±0.2 |
23.7±1.3 |
24.0±1.7 |
23.4±1.6 |
|
50–64 |
1,758 |
720 |
1,038 |
5.7±0.1 |
5.8±0.2 |
5.6±0.1 |
14.1±0.9 |
14.6±1.4 |
13.5±1.1 |
|
≥65 |
1,798 |
792 |
1,006 |
4.7±0.1 |
4.9±0.1 |
4.5±0.1 |
9.6±0.8 |
9.4±1.2 |
9.7±1.0 |
REFERENCES
- 1. Te Morenga L, Mallard S, Mann J. Dietary sugars and body weight: systematic review and meta-analyses of randomised controlled trials and cohort studies. BMJ 2012;346:e7492.
- 2. Te Morenga LA, Howatson AJ, Jones RM, Mann J. Dietary sugars and cardiometabolic risk: systematic review and meta-analyses of randomized controlled trials of the effects on blood pressure and lipids. Am J Clin Nutr 2014;100:65-79.
- 3. Vos MB, Kaar JL, Welsh JA, et al. Added sugars and cardiovascular disease risk in children: a scientific statement from the American Heart Association. Circulation 2017;135:e1017-34.
- 4. Moynihan PJ, Kelly SA. Effect on caries of restricting sugars intake: systematic review to inform WHO guidelines. J Dent Res 2014;93:8-18.
- 5. United States Department of Agriculture. Dietary guidelines for Americans, 2025-2030 [Internet]. United States Department of Agriculture; 2026 [cited 2026 Jun 9]. Available from: https://www.dietaryguidelines.gov/
- 6. Ministry of Health and Welfare; The Korean Nutrition Society. Dietary reference intakes for Koreans 2025. Ministry of Health and Welfare; 2025.
- 7. United States Food and Drug Administration. Added sugars on the nutrition facts label [Internet]. U.S. Food and Drug Administration; 2023 [cited 2026 Jun 9]. Available from: https://www.fda.gov/food/nutrition-facts-label/added-sugars-nutrition-facts-label
- 8. Ministry of Food and Drug Safety. 2025 Report on the intake status of health-sensitive nutrients: sodium and sugars. Ministry of Food and Drug Safety; 2025.
- 9. Louie JC, Moshtaghian H, Boylan S, et al. A systematic methodology to estimate added sugar content of foods. Eur J Clin Nutr 2015;69:154-61.
- 10. Kibblewhite R, Nettleton A, McLean R, et al. Estimating free and added sugar intakes in New Zealand. Nutrients 2017;9:1292.
- 11. Wanselius J, Axelsson C, Moraeus L, Berg C, Mattisson I, Larsson C. Procedure to estimate added and free sugars in food items from the Swedish food composition database used in the National Dietary Survey Riksmaten Adolescents 2016-17. Nutrients 2019;11:1342.
- 12. Liu S, Munasinghe LL, Ohinmaa A, Veugelers PJ. Added, free and total sugar content and consumption of foods and beverages in Canada. Health Rep 2020;31:14-24.
- 13. Scapin T, Louie JC, Pettigrew S, et al. The adaptation, validation, and application of a methodology for estimating the added sugar content of packaged food products when total and added sugar labels are not mandatory. Food Res Int 2021;144:110329.
- 14. Coyle DH, Davies T, Taylor F, Howes K, Pettigrew S, Jones A. Assessing the policy implications of different definitions for added sugars: an analysis across the Australian packaged food and beverage supply. Curr Dev Nutr 2024;8:102058.
- 15. Scapin T, Fernandes AC, Proenca RP. Added sugars: definitions, classifications, metabolism and health implications. Rev Nutr 2017;30:663-77.
- 16. Brazilian Health Regulatory Agency. Collegiate Board Resolution - RDC No. 429 of 8 October 2020: provides for the nutritional labeling of packaged foods. Brazilian Health Regulatory Agency; 2020.
- 17. World Health Organization. Guideline: sugars intake for adults and children [Internet]. World Health Organization; 2015 [cited 2026 Jun 9]. Available from: https://www.who.int/publications/i/item/9789241549028
- 18. Mela DJ, Woolner EM. Perspective: total, added, or free?: what kind of sugars should we be talking about? Adv Nutr 2018;9:63-9.
- 19. Swan GE, Powell NA, Knowles BL, Bush MT, Levy LB. A definition of free sugars for the UK. Public Health Nutr 2018;21:1636-8.
- 20. Korea Health Industry Development Institute. Sugar database compilation for commonly consumed foods. Korea Health Industry Development Institute; 2015.
- 21. World Health Organization. Sugars factsheet [Internet]. World Health Organization Regional Office for Europe; 2022 [cited 2026 Jun 15]. Available from: https://cdn.who.int/media/docs/librariesprovider2/euro-health-topics/obesity/sugars-factsheet.pdf
- 22. Padovan M, Ares G, Scapin T, et al. Declaration of free sugars from fruits on food labels: a scoping review. Br Food J 2024;126:4342-56.
- 23. Louie JC, Lei L, Rangan AM. Reliability of a systematic methodology to estimate added sugars content of foods when applied to a recent Australian food composition database. J Food Compos Anal 2016;46:36-42.
- 24. Ministry of Food and Drug Safety. Korean food code [Internet]. Ministry of Food and Drug Safety; [cited 2026 Jun 13]. Available from: https://www.foodsafetykorea.go.kr/foodcode/
- 25. Yeon S, Lee J, Yun S, Oh K. Intake of dietary sugar in the Republic of Korea: data from the Korea National Health and Nutrition Examination Survey. Jugan Geongang Gwa Jilbyeong 2026;19:253-67.
- 26. Kwon SO, Kim C. Sugar intake from processed foods among Koreans and levy on excessive sugar use: a cross-sectional study. Korean J Community Nutr 2026;31:287-96.
- 27. Park S, Zhao L, Lee SH, et al. Children and adolescents in the United States with usual high added sugars intake: characteristics, eating occasions, and top sources, 2015-2018. Nutrients 2023;15:274.
- 28. Whitton C, Nicholson SK, Roberts C, et al. National Diet and Nutrition Survey: UK food consumption and nutrient intakes from the first year of the rolling programme and comparisons with previous surveys. Br J Nutr 2011;106:1899-914.
- 29. Powell ES, Smith-Taillie LP, Popkin BM. Added sugars intake across the distribution of US children and adult consumers: 1977-2012. J Acad Nutr Diet 2016;116:1543-50.
- 30. Jeong Y, Lee H, Oh J, Kim Y. Major food groups and dishes contributing to sugar intake in Korea: Korea National Health and Nutrition Examination Survey 2016-2018. J Korean Soc Food Cult 2021;36:474-83.