ABSTRACT
-
Objective
Failure to achieve adequate caloric intake is common after percutaneous endoscopic gastrostomy (PEG) and may contribute to progressive malnutrition in older adults. This study aimed to identify factors associated with achieving adequate caloric delivery early after PEG placement.
-
Methods
This single-center retrospective observational study included patients aged ≥65 years who underwent PEG between January 2022 and December 2024. Target caloric intake was determined based on basal energy expenditure (BEE). The target nutritional intake achievement rate (TaNIAR) was defined as the ratio of final delivered calories to BEE. Patients were classified into an underfeeding group (TaNIAR <100%) and an appropriate-feeding group (TaNIAR ≥100%). Multivariable logistic regression analysis was performed to identify factors independently associated with achieving TaNIAR ≥100%.
-
Results
Fifty-nine patients were analyzed; 15 were classified as underfeeding and 44 as appropriate-feeding. The median final caloric intake, calculated in increments of 300 kcal corresponding to the packet size of the enteral formula, was 1,200 kcal (range, 600–1,200 kcal) in the underfeeding group and 1,200 kcal (range, 900–1,400 kcal) in the appropriate-feeding group. Multivariable analysis identified the use of a pectin-containing oligomeric formula (POF) (odds ratio [OR], 32.8; 95% confidence interval [CI], 3.7–292.9) and BEE ≤990 kcal/day (OR, 29.5; 95% CI, 3.1–277.7) as factors independently associated with achieving TaNIAR ≥100%. The final caloric intake clustered within a relatively narrow range in both groups.
-
Conclusion
Lower BEE and the use of POF were independently associated with achieving adequate caloric delivery after PEG placement. Optimization of enteral formula selection may represent a practical strategy to improve early nutritional adequacy in older patients. Further prospective studies are required to validate these findings.
-
Keywords: Gastrostomy; Enteral nutrition; Basal metabolism; Nutritional support; Aged
INTRODUCTION
For patients who rely on long-term enteral nutrition, persistent failure to achieve adequate caloric intake leads to progressive malnutrition with multisystem consequences. Inadequate delivery of calories and protein results in muscle wasting, weakness, impaired immune function, and deterioration of overall prognosis [
1].
One of the major reasons for insufficient caloric delivery in enteral nutrition–dependent patients is feeding intolerance, including vomiting, high gastric residual volume (GRV), diarrhea, and abdominal distension, which often leads clinicians to slow, interrupt, or discontinue feeding [
2-
4]. Although enteral nutrition via a nasogastric tube is commonly used during the initial phase, transition to a gastrostomy becomes necessary when long-term nutritional support is required. Percutaneous endoscopic gastrostomy (PEG) is widely used for this purpose and is superior to prolonged nasogastric feeding in terms of patient comfort and feasibility [
5-
7].
Even in older adults with low physical activity, resting and total energy expenditures remain substantial when adjusted for body weight [
8]. In Japan, basal energy expenditure (BEE) is commonly estimated using a population-specific predictive equation proposed by the National Institute of Health and Nutrition [
9]. However, despite standardized estimation of energy requirements, achieving adequate caloric intake immediately after PEG placement remains challenging in daily clinical practice.
Importantly, factors that facilitate or hinder the achievement of adequate nutritional intake during the early post-PEG period have not been sufficiently investigated. Therefore, this study aimed to identify factors associated with achieving adequate caloric delivery immediately after PEG placement in older adults.
METHODS
Ethics statement
The present study was approved by the Ethics Committee of Sonodakai and Sonoda Daiichi Hospital (approved March 22, 2023; No. 172). Due to the retrospective observational design of the study, the requirement for written informed consent was waived. Conversely, an opt-out approach was implemented, thereby affording eligible patients the opportunity to decline participation.
Study design and participants
This single-center retrospective observational study included patients aged 65 years or older who underwent PEG at Sonoda Daiichi Hospital between January 2022 and December 2024. Patients younger than 65 years of age and those who underwent PEG for indications unrelated to nutritional management were excluded from the study.
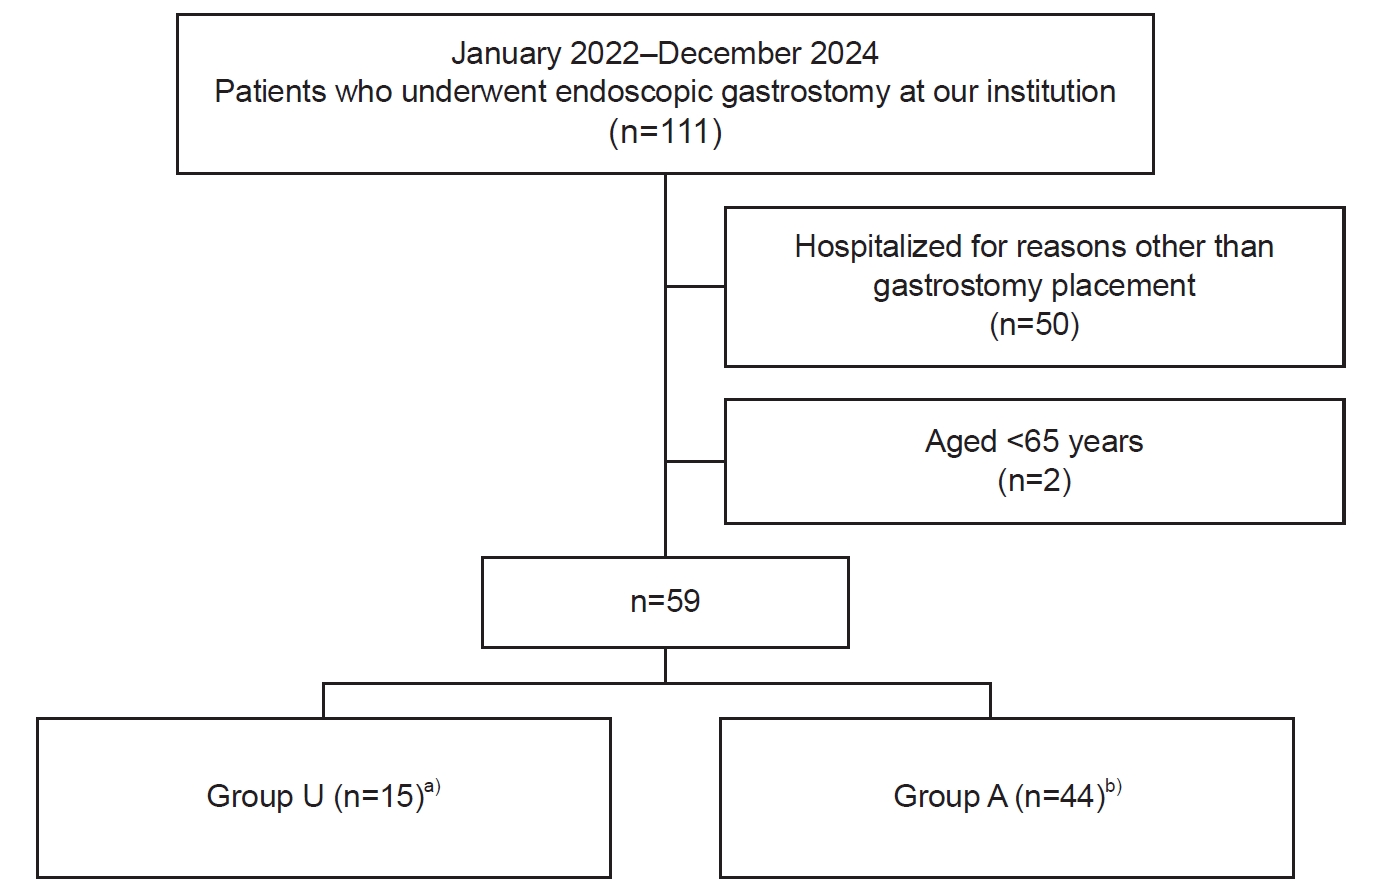
A total of 111 patients who underwent PEG during the study period were screened using the electronic medical record system. Following the application of the eligibility criteria, 59 patients were included in the final analysis. The target nutritional intake achievement rate (TaNIAR) was defined as the ratio of final delivered calories to BEE. According to this definition, patients were classified into two groups: an underfeeding group (TaNIAR <100%) and an appropriate-feeding group (TaNIAR ≥100%). All patients included in the study had received enteral nutrition via a nasogastric tube prior to PEG placement (
Fig. 1). This study has been reported in accordance with the Strengthening the Reporting of Observational Studies in Epidemiology (STROBE) guidelines.
Target daily caloric intake was determined for each patient using BEE, which was calculated with the predictive equation proposed by the National Institute of Health and Nutrition in Japan [
9]. The prescribed daily dose of enteral nutrition was calculated by dividing the target caloric intake by the caloric content per package of the selected formula and rounding to the nearest whole number. For patients with impaired glucose tolerance, blood glucose management during hospitalization was conducted in accordance with the treatment algorithm recommended by the Japan Diabetes Society [
10].
Enteral feeding was initiated on the day after PEG placement at approximately 25% to 30% of the target caloric requirement. Intermittent gastric feeding was used in all patients, and GRV was measured before each feeding. Feeding tolerance was assessed clinically. Intolerance was defined as the presence of excessive GRV (>100 mL/day), nausea, vomiting, abdominal distension, abdominal pain, or diarrhea. Signs suggestive of aspiration were also assessed, including cough during or after feeding, wet voice, respiratory distress, oxygen desaturation, increased sputum, and newly developed abnormal lung sounds.
Feeding volume was increased stepwise only when neither excessive GRV nor aspiration-related signs were present. Once the target intake was attained without adverse events, that level was maintained. When the target intake could not be achieved because of poor tolerance, the highest caloric intake that could be delivered without adverse events was defined as the final caloric intake.
Selection of enteral formula
Enteral formula type was included as a candidate explanatory variable because formula characteristics may influence gastrointestinal tolerance and thereby affect the amount of nutrition that can be delivered after PEG placement. During the study period, two enteral formulas were available at our institution: a pectin-containing oligomeric formula (POF) (HINEX E-Gel, Otsuka Pharmaceutical Co. Ltd.) and a standard polymeric formula (SPF) (Peptamen, Nestlé Health Science). Formula selection was left to the discretion of the attending physician, and no standardized institutional protocol or uniform selection criteria were used. Multiple physicians selected the formula independently on the basis of clinical judgment, taking into account each patient’s general condition, gastrointestinal tolerance, and prior feeding response. Thus, formula selection reflected routine clinical practice at our institution.
The POF used in this study has an energy density of 0.8 kcal/mL and contains low-molecular-weight peptides, including collagen peptides and soy peptides, together with free amino acids. It also contains soluble dietary fiber including pectin and has an osmolality of approximately 360 mOsm/L. The SPF used in this study has an energy density of 1.5 kcal/mL and is a peptide-based enteral formula without pectin supplementation.
Data collection
Clinical data were retrospectively extracted from electronic medical records. Candidate variables were selected on the basis of their clinical relevance to one of the following domains: estimated energy requirement, overall clinical condition, gastrointestinal tolerance, or upper gastrointestinal/swallowing-related findings that could influence enteral feeding after PEG.
Collected variables included age, sex, body mass index (BMI), BEE, Eastern Cooperative Oncology Group performance status, Glasgow Coma Scale (GCS), comorbidities, medication history, and the type of enteral formula used during hospitalization. Medication history was reviewed with particular attention to drugs that could affect bowel function, including those associated with constipation or diarrhea. Stool consistency was evaluated using the Bristol Stool Scale (BSS). Post-PEG clinical outcomes included post-PEG complications, the duration required to reach the final caloric intake (DuFiCI), and post-PEG hospital stay (PPhs). Endoscopic findings, including the presence of hiatal hernia and the Hyodo-Komagane score, were also recorded because they may be relevant to swallowing function, reflux risk, and feeding tolerance [
11,
12].
TaNIAR was calculated as the ratio of final delivered calories to BEE. Patients were then categorized into an underfeeding group (TaNIAR <100%) or an appropriate-feeding group (TaNIAR ≥100%). Continuous variables are presented as median (range) and were compared using the Mann-Whitney U test or the independent-samples t test, as appropriate. Categorical variables were compared using the chi-square test or Fisher exact test, as appropriate.
Receiver operating characteristic (ROC) curve analysis was performed for continuous variables, and cutoff values were determined using the Youden index. Variables that demonstrated significant associations in univariable analyses were entered into a multivariable logistic regression model to identify factors independently associated with achieving TaNIAR ≥100%. Due to the limited sample size, the multivariable analysis was conducted as an exploratory analysis with a restricted number of variables in the final model. Odds ratios (ORs) with 95% confidence intervals (CIs) were calculated. Model fit was assessed using the Hosmer-Lemeshow test. All statistical analyses were performed using IBM SPSS ver. 28 (IBM Corp.), and a two-sided P-value <0.05 was considered statistically significant.
RESULTS
Baseline characteristics
The final analysis included a total of 59 patients. Of these patients, 15 were classified into the underfeeding group (TaNIAR <100%), while 44 were classified into the appropriate-feeding group (TaNIAR ≥100%). The baseline characteristics of the study participants are enumerated in
Table 1. The feeding group that received adequate nourishment included a significantly higher proportion of female patients than the underfeeding group. Furthermore, BEE was found to be significantly lower in the appropriate-feeding group. Prior to PEG placement, all patients had received enteral nutrition via a nasogastric tube. No significant between-group differences were observed in age, BMI, comorbidities, medication history, or endoscopic findings, including hiatal hernia and Hyodo-Komagane score.
The post-PEG clinical outcomes are outlined in
Table 2. The type of enteral formula administered during hospitalization differed significantly between the two groups. In the underfeeding group, 11 patients (73.3%) received the SPF, while four patients (26.7%) received the POF. Conversely, in the appropriate-feeding group, six patients (13.6%) received SPF and 38 (86.4%) received POF. Consequently, POF utilization was found to be considerably more prevalent in the appropriate-feeding group.
Furthermore, a substantial variation in stool consistency was observed among the study groups. According to the BSS, the appropriate-feeding group exhibited a distribution that shifted toward more favorable stool consistency in comparison with the underfeeding group. The DuFiCI was significantly shorter in the appropriate-feeding group than in the underfeeding group. Furthermore, the duration of hospital stay following PEG was found to be significantly reduced in the group receiving appropriate-feeding.
The absolute final caloric intake achieved during hospitalization demonstrated a relatively narrow distribution in both groups. The median final caloric intake was 1,200 kcal (range, 600–1,200 kcal) in the underfeeding group and 1,200 kcal (range, 900–1,400 kcal) in the appropriate-feeding group. Despite the inherent differences in the definition of TaNIAR across groups, the absolute amount of calories delivered during hospitalization remained comparable.
ROC analysis and multivariable analysis
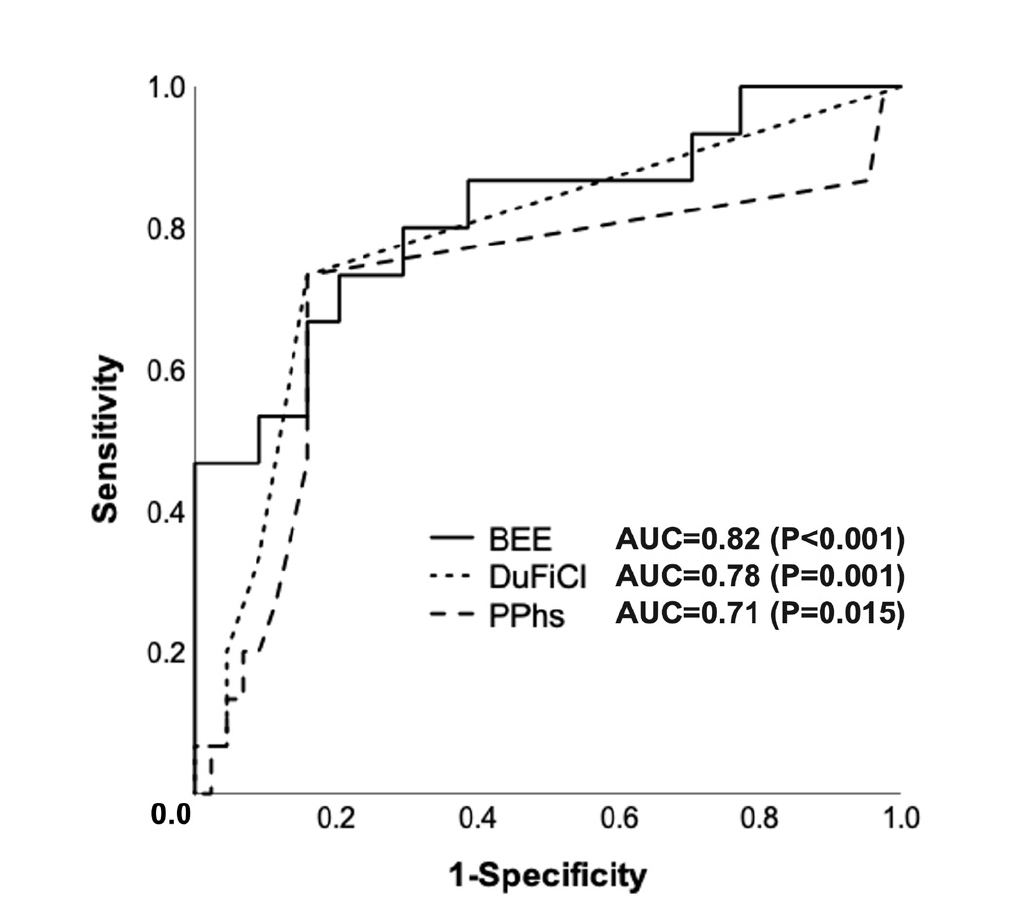
ROC curve analysis identified cutoff values of 990 kcal/day for BEE, 6 days for DuFiCI, and 7 days for PPhs (
Fig. 2). Variables that demonstrated significant associations in univariable analyses were subsequently entered into the multivariable logistic regression model. In the multivariable analysis, POF use and BEE ≤990 kcal/day were independently associated with achieving TaNIAR ≥100%. The utilization of POF was associated with an OR of 32.8 (95% CI, 3.7–292.9; P=0.002). Furthermore, BEE ≤990 kcal/day was associated with an OR of 29.5 (95% CI, 3.1–277.7; P=0.003) (
Table 3). Among patients with BEE >990 kcal/day, those who received POF achieved TaNIAR ≥100% more frequently than those who received SPF.
DISCUSSION
In this study, lower BEE and the use of a POF were found to be independently associated with achieving a TaNIAR of at least 100% immediately after PEG placement. Conversely, the absolute final caloric intake achieved during hospitalization was comparable between the two groups. The findings suggest that the attainment of TaNIAR was influenced not solely by the calculated energy requirement but also by the amount of enteral nutrition that could be tolerated and delivered.
In the present cohort, the median final caloric intake was 1,200 kcal in both groups, despite differences in BEE. This finding suggests that the delivered caloric intake tended to cluster within a relatively limited range in routine clinical practice. As TaNIAR was defined as the ratio of delivered calories to BEE, patients with lower BEE were more likely to reach 100% of their estimated requirement within that range. Conversely, patients with higher BEE were less likely to do so. This interpretation aligns with prior reports indicating that enteral feeding is often hindered, interrupted, or discontinued due to feeding intolerance, including elevated GRV, vomiting, and diarrhea. These occurrences can result in a reduction of the actual nutritional delivery, despite predefined caloric objectives [
2-
4]. Consequently, our findings align with the hypothesis that the early caloric adequacy after PEG is constrained by practical feeding tolerance as well as by estimated energy requirement. The concept of a strict physiological ceiling cannot be established from this retrospective study alone; however, the observed clustering of delivered calories suggests the presence of a practical upper boundary of tolerable gastric feeding in this clinical setting.
The association between POF use and achievement of TaNIAR ≥100% is also clinically meaningful. In this study, the use of POF remained independently associated with adequate caloric delivery even after adjustment in the multivariable model. Furthermore, patients with BEE >990 kcal/day who received POF more frequently achieved TaNIAR ≥100% than those who received the SPF. This finding suggests that the efficacy of nutritional delivery subsequent to PEG is influenced by patient-related factors as well as nutritional strategy. One potential explanation for this phenomenon is that pectin-containing formulas enhance gastrointestinal tolerance. Increased viscosity may reduce gastroesophageal reflux, and soluble fiber, such as pectin, may help stabilize stool consistency and improve intestinal handling of enteral nutrition. These effects may facilitate stepwise advancement of feeding and allow a greater amount of nutrition to be delivered without interruption. This interpretation aligns with the findings of previous studies that reported enhanced tolerance and a reduction in gastrointestinal adverse events with pectin-containing enteral formulas [
13,
14].
Concurrently, the observed association between POF utilization and caloric adequacy should be interpreted with caution. The selection of formula was not standardized and was left to the discretion of the attending physician. Therefore, the possibility of confounding by indication cannot be ruled out. It is plausible that physicians selected POF for patients whom they considered more likely to benefit from a better-tolerated formula. Furthermore, unmeasured clinical factors may have influenced both formula selection and feeding outcomes. Consequently, the present findings should not be interpreted as definitive evidence that POF is superior to standard formulas. Instead, they suggest that formula selection is a potentially modifiable factor that merits further prospective evaluation.
It is imperative to acknowledge the limitations of the present study. First, it should be noted that this was a retrospective single-center study. Therefore, the identified relationships should be interpreted as statistical associations rather than causal effects. Second, the sample size was limited, and the multivariable model yielded large ORs with wide CIs. These findings suggest possible model instability and limited precision of the estimated associations. Third, despite the final model’s restriction to a limited number of variables, residual confounding remains a possibility. This is due to the fact that clinically relevant factors such as baseline nutritional reserve, disease severity, and gastrointestinal functional status were not fully captured. Fourth, TaNIAR was defined using BEE as the reference value. As a component of the patient’s total energy expenditure, the BEE is an important metric in determining the patient’s basal metabolic demand. However, it is important to note that BEE does not fully represent total energy requirements in all hospitalized patients, particularly those with stress-related or disease-related metabolic changes. Consequently, classification based on TaNIAR may not accurately reflect the nutritional adequacy in every patient. It is imperative to acknowledge that the cutoff values derived from the ROC analysis should be regarded as exploratory in nature and necessitate external validation prior to their clinical implementation.
Notwithstanding these limitations, the present study offers clinically relevant information regarding early nutritional management after PEG placement in older adults. The findings suggest that the successful achievement of caloric intake relative to estimated requirements is contingent on both the magnitude of the requirement and the amount of nutrition that can be delivered. The findings also identify enteral formula selection as a potentially modifiable component of early PEG management. The necessity for prospective multicenter studies is evident in order to confirm these associations and to determine whether formula-based strategies can improve early nutritional delivery after PEG placement.
NOTES
-
Author Contributions
Conceptualization: EA. Data curation: EA. Formal analysis: EA. Investigation: EA. Methodology: all authors. Project administration: EA. Visualization: EA. Writing - original draft: EA. Writing - review & editing: all authors. All authors read and approved the final manuscript.
-
Conflict of Interest
None.
-
Funding
None.
-
Acknowledgments
The authors thank the physicians and medical staff of Sonoda Daiichi Hospital for their support and dedicated patient care, and Ryuichi Tamura for his invaluable encouragement.
-
Data availability
All data generated or analyzed during this study are included in this article, with additional data available from the corresponding author upon reasonable request.
Fig. 1.Patient screening flowchart. TaNIAR = Final actual calorie intake/basal energy expenditure × 100 (%). a)Underfeeding group (target nutritional intake achievement rate [TaNIAR] <100%); b)Appropriate-feeding group (TaNIAR ≥100%).
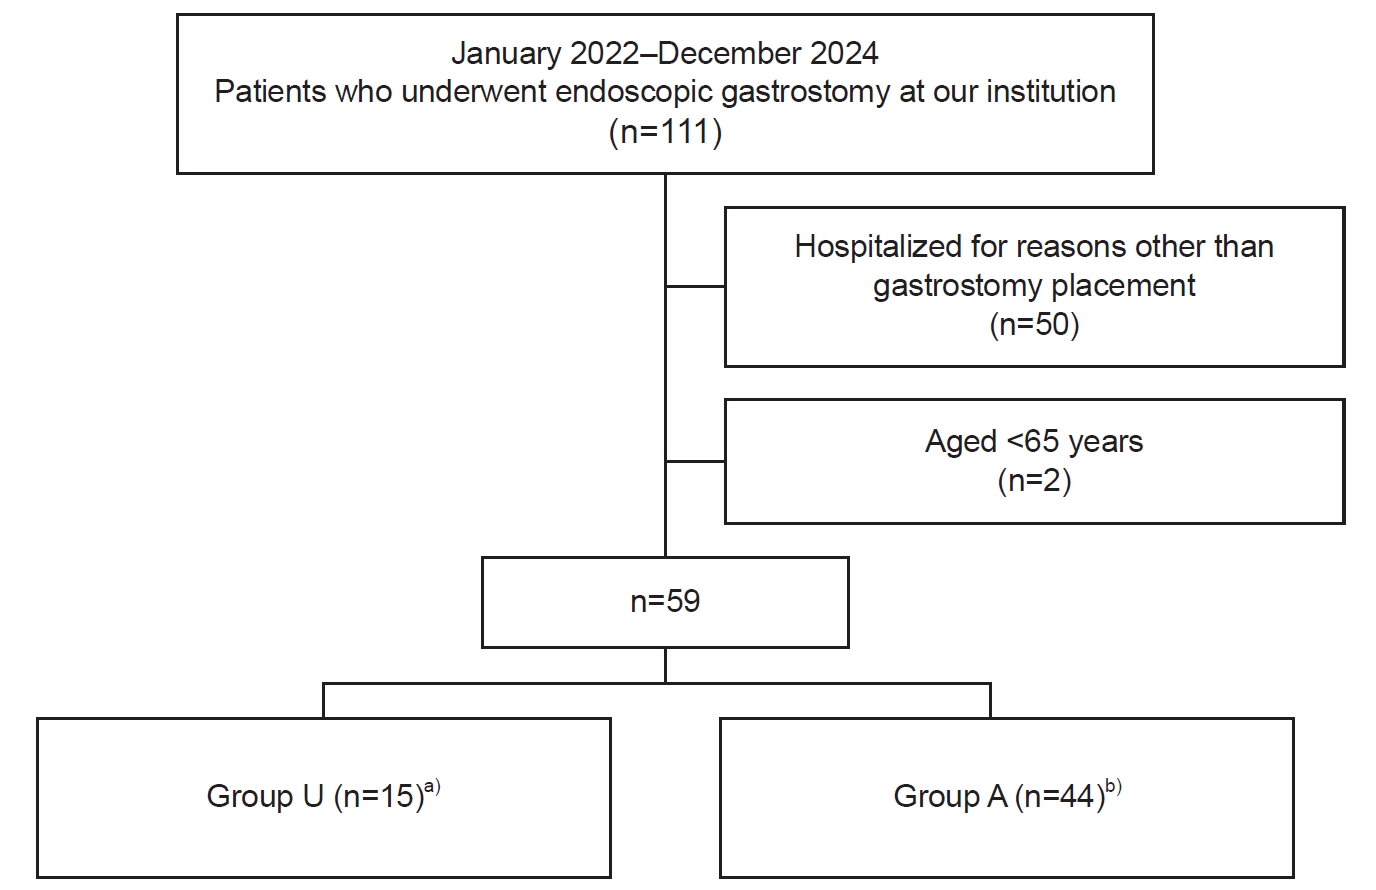
Fig. 2.Receiver operating characteristic curves for target nutritional intake achievement rate ≥100% occurrence and each factor. AUC, area under curve; BEE, Basal Energy Expenditure; DuFiCI, duration required to reach the final target calorie intake; PPhs, post-percutaneous endoscopic gastrostomy hospital stay.
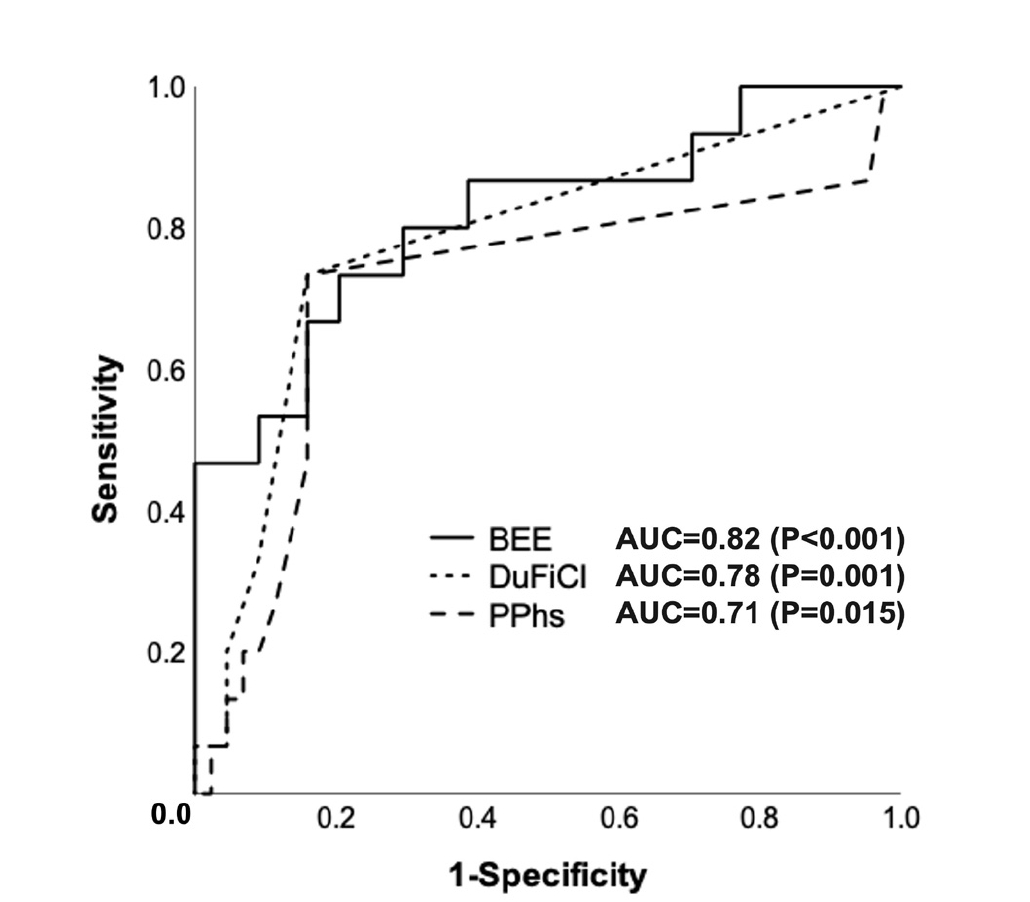
Table 1.Patients’ demographics, comorbidities, medication history, and endoscopic findings during percutaneous endoscopic gastrostomy
Table 1.
|
Characteristic |
Group U (n=15)a)
|
Group A (n=44)b)
|
P-value |
|
Sex |
|
|
0.003 |
|
Male |
12 (80.0) |
16 (36.4) |
|
|
Female |
3 (20.0) |
28 (63.6) |
|
|
Age (yr) |
82 (66–93) |
83 (65–97) |
0.628 |
|
BMI (kg/m2) |
19.40 (15.67–24.74) |
18.47 (12.29–24.96) |
0.317 |
|
BEE (kcal) |
1,126.73 (807.27–1,330.96) |
919.83 (702.16–1,202.68) |
<0.001 |
|
BEE ≤990 (kcal) |
3 (20.0) |
32 (72.7) |
<0.001 |
|
ECOG PS |
|
|
0.259 |
|
3 |
1 (6.7) |
9 (20.5) |
|
|
4 |
14 (93.3) |
35 (79.5) |
|
|
GCS |
|
|
|
|
Eye opening |
|
|
0.56 |
|
3 |
0 (0) |
3 (6.8) |
|
|
4 |
15 (100) |
41 (93.2) |
|
|
Verbal response |
|
|
0.882 |
|
1 |
0 (0) |
1 (2.2) |
|
|
2 |
8 (53.3) |
25 (56.8) |
|
|
3 |
2 (13.3) |
5 (11.4) |
|
|
4 |
5 (33.3) |
12 (27.3) |
|
|
5 |
0 (0) |
1 (2.2) |
|
|
Motor response |
|
|
0.349 |
|
3 |
5 (33.3) |
8 (18.2) |
|
|
4 |
6 (40.0) |
17 (38.6) |
|
|
5 |
4 (26.7) |
17 (38.6) |
|
|
6 |
0 (0) |
2 (4.5) |
|
|
History of enteral feeding via the nasogastric tube |
15 (100) |
44 (100) |
NA |
|
Comorbidity |
|
|
|
|
Neurological |
|
|
|
|
Cerebral hemorrhage |
3 (20.0) |
13 (29.5) |
0.74 |
|
Subarachnoid hemorrhage |
2 (13.3) |
5 (11.4) |
>0.999 |
|
Cardioembolic stroke |
3 (20.0) |
2 (4.5) |
0.1 |
|
Atherothrombotic stroke |
5 (33.3) |
18 (40.9) |
0.76 |
|
Alzheimer’s disease |
1 (6.7) |
2 (4.5) |
>0.999 |
|
Lewy body dementia |
0 (0) |
2 (4.5) |
>0.999 |
|
Vascular dementia |
0 (0) |
1 (2.3) |
>0.999 |
|
Frontotemporal dementia |
0 (0) |
4 (9.1) |
0.56 |
|
Parkinson’s disease |
2 (13.3) |
3 (6.8) |
0.59 |
|
Neurodegenerative disease |
1 (6.7) |
1 (2.3) |
0.46 |
|
Cardiovascular |
|
|
|
|
Coronary artery disease |
1 (6.7) |
4 (9.1) |
>0.999 |
|
Chronic heart failure |
2 (13.3) |
7 (15.9) |
>0.999 |
|
Arrhythmia |
3 (20.0) |
6 (13.6) |
0.68 |
|
Nephroendocrinological |
|
|
|
|
Type 2 diabetes mellitus |
3 (20.0) |
10 (22.7) |
>0.999 |
|
Chronic kidney failure |
1 (6.7) |
0 (0) |
0.25 |
|
Orthopedic |
|
|
|
|
Femoral neck fracture |
1 (6.7) |
4 (9.1) |
>0.999 |
|
Lumbar compression fracture |
0 (0) |
1 (2.3) |
>0.999 |
|
Medication history drugs likely to induce constipation |
5 (33.3) |
18 (40.9) |
0.76 |
|
Opioids |
0 (0) |
0 (0) |
NA |
|
Anticholinergics |
2 (13.3) |
7 (15.9) |
>0.999 |
|
Calcium channel blockers |
3 (20.0) |
8 (18.2) |
>0.999 |
|
Iron supplements |
1 (6.7) |
2 (4.5) |
>0.999 |
|
Calcium supplements |
0 (0) |
4 (9.1) |
0.56 |
|
Vitamin D supplements |
0 (0) |
4 (9.1) |
0.56 |
|
Drugs likely to induce diarrhea |
3 (20.0) |
9 (20.5) |
>0.999 |
|
Antiemetics |
0 (0) |
0 (0) |
NA |
|
Metformin |
0 (0) |
4 (9.1) |
0.56 |
|
Any laxative |
3 (20.0) |
5 (11.4) |
0.41 |
|
Alpha-glucosidase inhibitor |
0 (0) |
2 (4.5) |
>0.999 |
|
Endoscopic finding |
|
|
|
|
Hiatal hernia |
4 (26.7) |
15 (34.1) |
0.75 |
|
Hyodo-Komagane score |
|
|
|
|
9 |
5 (33.3) |
17 (38.6) |
0.68 |
|
10 |
3 (20.0) |
11 (25.0) |
|
|
11 |
5 (33.3) |
8 (18.2) |
|
|
12 |
2 (13.3) |
8 (18.2) |
|
Table 2.Patients’ outcomes after percutaneous endoscopic gastrostomy
Table 2.
|
Variable |
Group U (n=15)a)
|
Group A (n=44)b)
|
P-value |
|
Type of nutritional formula |
|
|
<0.001 |
|
SPF |
11 (73.3) |
6 (13.6) |
|
|
POF |
4 (26.7) |
38 (86.4) |
|
|
BSS |
|
|
0.011 |
|
4 |
0 (0) |
2 (4.5) |
|
|
5 |
5 (33.3) |
33 (75.0) |
|
|
6 |
4 (26.7) |
4 (9.1) |
|
|
7 |
6 (40.0) |
5 (11.4) |
|
|
≤5 |
5 (33.3) |
35 (79.5) |
0.003 |
|
Complication (any) |
3 (20.0) |
2 (4.5) |
0.10 |
|
DuFiCI (day) |
6 (4–20) |
4 (4–18) |
<0.001 |
|
DuFiCI ≤6 days |
4 (26.7) |
37 (84.1) |
<0.001 |
|
PPhs (day) |
8 (6–27) |
7 (2–31) |
0.005 |
|
PPhs ≤7 days |
4 (26.7) |
37 (84.1) |
<0.001 |
Table 3.Analysis of factors capable of achieving target nutritional intake achievement rate≥100% after percutaneous endoscopic gastrostomy
Table 3.
|
Variable |
Univariate |
Multivariate |
|
OR (95% CI) |
P-value |
OR (95% CI) |
P-value |
|
Type of enteral formula (POF) |
11.9 (3.2–45.1) |
<0.001 |
32.8 (3.7–292.9) |
0.002 |
|
Female sex |
7.9 (1.9–31.7) |
0.004 |
- |
0.190 |
|
BEE ≤990 kcal |
10.7 (2.6–43.7) |
0.001 |
29.5 (3.1–277.7) |
0.003 |
|
BSS ≤5 |
5.8 (1.7–20.0) |
0.005 |
-
|
0.900 |
|
DuFiCI ≤6 days |
10.2 (2.8–37.5) |
<0.001 |
- |
0.530 |
|
PPhs ≤7 days |
10.7 (2.7–37.1) |
<0.001 |
- |
0.280 |
REFERENCES
- 1. Li Q, Wang J. The application and mechanism analysis of enteral nutrition in clinical management of chronic diseases. Nutrients 2025;17:450.
- 2. Misirlioglu M, Yildizdas D, Ekinci F, et al. An assessment of intermittent and continuous enteral feeding in critically ill children. Nutrients 2025;17:301.
- 3. Kasti AN, Theodorakopoulou M, Katsas K, et al. Factors associated with interruptions of enteral nutrition and the impact on macro- and micronutrient deficits in ICU patients. Nutrients 2023;15:917.
- 4. Petros S, Engelmann L. Enteral nutrition delivery and energy expenditure in medical intensive care patients. Clin Nutr 2006;25:51-9.
- 5. Gauderer MW, Ponsky JL, Izant RJ Jr. Gastrostomy without laparotomy: a percutaneous endoscopic technique. J Pediatr Surg 1980;15:872-5.
- 6. Vanis N, Saray A, Gornjakovic S, Mesihovic R. Percutaneous endoscopic gastrostomy (PEG): retrospective analysis of a 7-year clinical experience. Acta Inform Med 2012;20:235-7.
- 7. Nicholson FB, Korman MG, Richardson MA. Percutaneous endoscopic gastrostomy: a review of indications, complications and outcome. J Gastroenterol Hepatol 2000;15:21-5.
- 8. Allepaerts S, Buckinx F, Bruyere O, Reginster JY, Paquot N, Gillain S. Clinical impact of nutritional status and energy balance in elderly hospitalized patients. J Nutr Health Aging 2020;24:1073-9.
- 9. Ganpule AA, Tanaka S, Ishikawa-Takata K, Tabata I. Interindividual variability in sleeping metabolic rate in Japanese subjects. Eur J Clin Nutr 2007;61:1256-61.
- 10. Bouchi R, Kondo T, Ohta Y, et al. A consensus statement from the Japan Diabetes Society: a proposed algorithm for pharmacotherapy in people with type 2 diabetes – 2nd edition (English version). J Diabetes Investig 2024;15:1326-42.
- 11. Hyodo M, Nishikubo K, Hirose K. New scoring proposed for endoscopic swallowing evaluation and clinical significance. Nihon Jibiinkoka Gakkai Kaiho 2010;113:670-8.
- 12. Chiba Y, Sano D, Ikui Y, et al. Predictive value of the Hyodo score in endoscopic evaluation of aspiration during swallowing. Auris Nasus Larynx 2018;45:1214-20.
- 13. Maruyama M, Goshi S, Kashima Y, Mizuhara A, Higashiguchi T. Clinical effects of a pectin-containing oligomeric formula in tube feeding patients: a multicenter randomized clinical trial. Nutr Clin Pract 2020;35:464-70.
- 14. Huang HB, Zhu YB, Yu DX. Use of pectin-supplemented enteral nutrition in intensive care: a systematic review and meta-analysis. Clin Nutr ESPEN 2025;68:62-70.