ABSTRACT
-
Objective
This study investigated the prevalence and factors of concurrent wasting and stunting (WaSt) in Cambodian children aged 6–59 months.
-
Methods
This cross-sectional analysis of the Cambodia Demographic and Health Survey from 2021 to 2022 included 3,420 children aged 6–59 months and a subsample of 1,237 aged 6–23 months for whom dietary indicators were available. WaSt was defined as height-for-age and weight-for-height z-scores below −2 standard deviations according to the World Health Organization (WHO) Growth Standards. Dietary indicators followed 2021 WHO/UNICEF infant and young child feeding definitions. Survey-weighted logistic regression was employed in Stata 18.0, with statistical significance set at P<0.05.
-
Results
The prevalence rates were 22.4% for stunting, 9.3% for wasting, and 2.1% for WaSt. The odds of WaSt were higher among children with low birth weight (adjusted odds ratio [AOR], 4.93; 95% confidence interval [CI], 1.92–12.63), those born to underweight mothers (AOR, 2.42; 95% CI, 1.06–5.56), and those from the poorest wealth tertile (AOR, 2.46; 95% CI, 1.14–5.31). Contrarily, the odds were lower among girls (AOR, 0.52; 95% CI, 0.28–0.97) and children of mothers who were overweight or obese (AOR, 0.25; 95% CI, 0.10–0.65). No dietary indicator was associated with WaSt, although power was limited by few cases (n=21).
-
Conclusion
WaSt was independently associated with low birth weight, maternal underweight, and household poverty, whereas no significant association with dietary indicators was observed. Integrated programs targeting maternal nutrition, birth outcomes, and poverty in vulnerable households are warranted.
-
Keywords: Wasting; Stunting; Cambodia Demographic and Health Survey; Child malnutrition
INTRODUCTION
To date, child undernutrition remains a major global public health concern. Progress toward achieving international nutrition targets has been slow, with an estimated 150.2 million children aged <5 years affected by stunting and 42.8 million by wasting [
1,
2]. Beyond these two conditions individually, researchers have increasingly focused on concurrent wasting and stunting (WaSt), defined as the coexistence of wasting (weight-for-height z-score [WHZ], <−2) and stunting (height-for-age z-score [HAZ], <−2) [
3,
4]. As it combines acute and chronic growth failure, WaSt represents one of the most severe forms of undernutrition.
Over the past two decades, Cambodia has achieved substantial reductions in stunting. The Cambodia Demographic and Health Survey (CDHS) 2021–2022 showed that the prevalence of stunting decreased from roughly 32% in 2014 to approximately 22% in 2021–2022. However, wasting has barely changed, remaining at around 10%, a level still considered high for the region [
5,
6]. Recent national and international reports present a similar picture, in which chronic undernutrition has improved over time while acute undernutrition continues to persist [
7]. In other words, many Cambodian children continue to face several nutritional risks at once.
Child growth is influenced by factors operating at several levels. At the individual level, age (particularly between 6 and 23 months), sex, birth weight, recent illness, and feeding practices can directly affect nutritional status. Household circumstances, such as poverty, food insecurity, limited access to clean water, and poor sanitation, further increase the risk of impaired growth. Maternal characteristics, including a mother’s nutritional status, education, and general health, also influence the child’s development [
8-
10]. Although WaSt are frequently studied as separate problems, a growing body of evidence indicates that they share common underlying causes and often occur together, particularly in younger children and those exposed to repeated infections [
8-
10].
Children affected by WaSt face a significantly higher risk of poor health. Compared with children who have only one form of undernutrition, those with WaSt have greater morbidity and a markedly higher risk of death [
3,
11]. Although wasting alone can rapidly fluctuate, its coexistence with stunting signals more prolonged deprivation and vulnerability. However, most nutrition programs and surveillance systems still treat WaSt as distinct conditions, which means children with WaSt may go unrecognized and untreated.
This gap in identification and management has practical consequences for prevention and treatment. Earlier studies have associated WaSt with numerous factors, including low birth weight, male sex, frequent infections, poor complementary feeding, short birth intervals, and low maternal educational level and household wealth [
8,
12]. Nevertheless, the evidence base for WaSt remains limited, and few studies in Cambodia have used recent nationally representative data.
Against this background, a clearer understanding of the burden and determinants of WaSt in Cambodia is needed. Drawing on the CDHS 2021–2022 data, this study aimed to investigate the factors associated with WaSt among children aged 6–59 months. The findings are intended to inform more integrated nutrition policies and interventions that address WaSt, with particular attention to vulnerable groups, such as children aged 6–23 months [
5,
7]. This period is also a critical window for growth faltering: linear growth steeply deteriorates over the first 24 months of life, the same interval in which complementary foods are introduced and infant feeding practices exert their greatest influence on growth [
13]. As WaSt incorporates a chronic (stunting) component, this is the window in which the association between diet and WaSt is most likely to be detectable.
This study aimed to examine the factors associated with WaSt among children aged 6–59 months in Cambodia using data from CDHS 2021–2022.
Specifically, this study aimed as follows: (1) to determine the prevalence of stunting, wasting, and WaSt among children aged 6–59 months in Cambodia; (2) to identify sociodemographic, maternal, child, and household environmental factors associated with WaSt among children aged 6–59 months in Cambodia; (3) to explore the association of dietary diversity and meal frequency with WaSt in children aged 6–23 months in Cambodia.
METHODS
Ethics statement
This study was approved by the Institutional Review Board of Sungshin Women’s University (No. SSWUIRB-2026-003). The study was a secondary analysis of publicly available data from the CDHS. Permission to use the dataset was obtained from the Demographic and Health Surveys (DHS) program. Informed consent was obtained by the original survey organizers from the participants. However, the requirement for additional informed consent was waived. All data were anonymized before access, and no identifiable information was available to the researchers. All procedures were performed in accordance with the principles of the Declaration of Helsinki. This study was reported in accordance with the STROBE (Strengthening the Reporting of Observational Studies in Epidemiology) guidelines.
Study design and setting
This study was a cross-sectional secondary analysis of data obtained from CDHS 2021–2022 [
5]. The CDHS is a nationally representative household survey conducted to obtain information on population health, nutrition, and demographic indicators. The survey was conducted across urban and rural areas in Cambodia using a stratified two-stage cluster sampling design. Data were collected between June 15, 2021, and January 30, 2022, by trained fieldworkers using standardized questionnaires. The present study used data on children aged <5 years and their mothers to evaluate the factors associated with WaSt among children aged 6–59 months in Cambodia.
The analytical sample was drawn from the Children’s Recode file of the CDHS 2021–2022, which contains records of all living children aged <5 years born to interviewed women. Anthropometric measurements in CDHS 2021–2022 were performed only among children aged 6–59 months. Younger infants were ineligible for anthropometric assessment and therefore excluded from the analysis. Children were eligible for inclusion if they (1) were aged 6–59 months at the time of the survey; (2) had valid anthropometric measurements; and (3) had HAZ and WHZ within the plausible range of −6 to +6 standard deviations (SDs) recommended by the World Health Organization (WHO). Children with missing or biologically implausible HAZ or WHZ were excluded. All children in the CDHS anthropometry subsample were living with their mothers; therefore, no further exclusion was required for linking maternal variables.
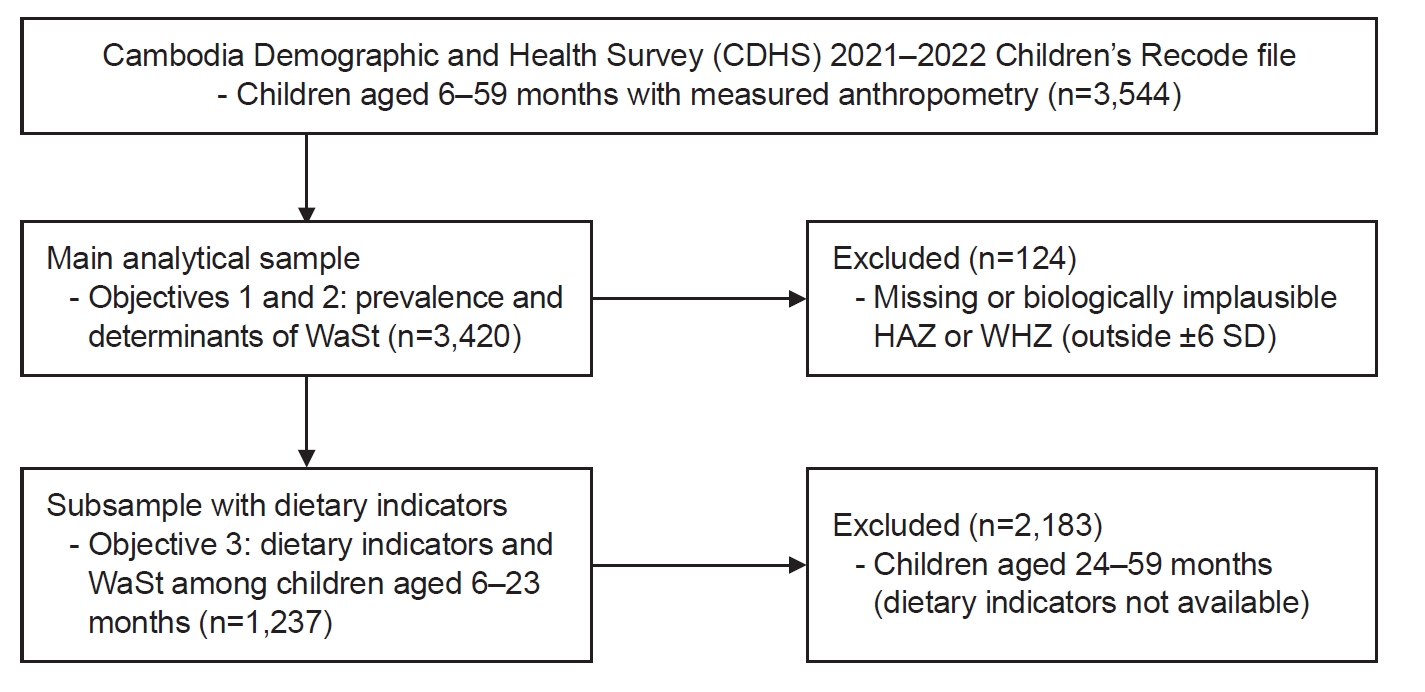
The CDHS 2021–2022 Children’s Recode file included 3,544 children aged 6–59 months with measured anthropometry. After excluding 124 children (3.5%) with missing or biologically implausible HAZ or WHZ (outside ±6 SD of the WHO median), 3,420 children remained in the main analytical sample for the prevalence and multivariable analyses (objectives 1 and 2). For the sub-analysis of dietary indicators (objective 3), the sample was further restricted to children aged 6–23 months within the analytical sample (n=1,237), according to the WHO/United Nations Children’s Fund (UNICEF) guidance [
14] and DHS, phase 8 (DHS-8) protocol [
5]. A flow diagram of participant selection is shown in
Fig. 1.
All data were obtained from the publicly available CDHS 2021–2022 standard recode files, including the Children’s Recode file, provided by the DHS program. Anthropometric measurements were obtained by trained CDHS field staff using standardized procedures consistent with WHO recommendations: recumbent length was measured for children aged <24 months and standing height for children aged ≥24 months, and weight was measured to the nearest 0.1 kg using SECA digital scales. WHO-standardized HAZ and WHZ provided in the CDHS dataset (variables HW70 and HW72, divided by 100) were used to calculate stunting, wasting, and WaSt according to the WHO 2006 Child Growth Standards [
15].
Birth weight was based on either a written record (e.g., health card) or maternal recall. Maternal anthropometry (height, weight, body mass index [BMI]) was measured during the survey by trained interviewers. Household wealth was assessed using the DHS-constructed wealth index, a composite indicator derived from principal component analysis of household assets, dwelling characteristics, and access to utilities. Water source and sanitation facility variables were classified as improved or unimproved according to the WHO/UNICEF Joint Monitoring Programme (JMP) ladder. Dietary indicators were derived from 24-hour dietary recall data following the 2021 WHO/UNICEF revised indicator definitions (DHS-8 methodology) [
14].
The primary outcome was WaSt, defined as a binary indicator with a value of 1 if a child had WHZ <−2 SD and HAZ <−2 SD according to the WHO Child Growth Standards (2006) and 0 otherwise. Stunting (HAZ<−2 SD) and wasting (WHZ<−2 SD) were also separately examined to establish prevalence.
Independent variables were selected based on the UNICEF conceptual framework for child undernutrition and previous evidence on the determinants of WaSt and were grouped into four domains:
(1) Child-level factors: age (6–11, 12–23, 24–35, 36–47, and 48–59 months), sex (male/female), birth weight (normal, ≥2,500 g; low, <2,500 g; missing/don’t know retained as a category), and breastfeeding status (currently breastfeeding, ever breastfed but not current, never breastfed)—examined for the youngest children only (n=1,902), per DHS design.
(2) Maternal factors: maternal age at child’s birth (quartiles: 14–23, 24–27, 28–32, and 33–49 years), maternal education (no education, primary, secondary, or higher—secondary and higher were combined due to the small number of participants), maternal BMI (underweight, <18.5 kg/m2; normal, 18.5–24.9 kg/m2; overweight/obese, ≥25.0 kg/m²—pregnant women excluded), and number of antenatal care visits (≥4, 1–3, missing retained as a category).
(3) Household factors: place of residence (urban/rural), wealth index (recategorized into three groups—poorest, poorer, and middle or above—to ensure adequate cell counts for the rare WaSt outcome), source of drinking water (improved/unimproved, per WHO/UNICEF JMP criteria), and sanitation facility (improved, unimproved, open defecation).
(4) Dietary indicators (available for children aged 6–23 months only): three diet indicators, based on the standard WHO/UNICEF infant and young child feeding indicator definitions (DHS-8 methodology), were derived from maternal 24-hour dietary recall data. These indicators were available only for children aged 6–23 months. First, each child’s food intake during the previous 24 hours was classified into eight groups: (1) breast milk; (2) grains, white roots, and tubers (including bread, noodles, rice-based products, plantains, potatoes, and cassava); (3) legumes and nuts (combined into a single variable in the CDHS questionnaire); (4) dairy products (cow milk, infant formula, yogurt, and cheese); (5) flesh foods (meat, poultry, fish, organ meats, and processed meats, including sausages and ham); (6) eggs; (7) vitamin A–rich fruits and vegetables (pumpkin, carrots, squash, dark green leafy vegetables, sweet leaf bush, cassava leaves) and vitamin A–rich fruits such as mangoes and papayas; and (8) other fruits and vegetables. According to the WHO/DHS-8 guideline, a food group was considered consumed if the child had consumed any amount of food belonging to that group within the previous 24 hours; no minimum quantity threshold was applied. For each child, a food group score ranging from 0 to 8 was generated by summing the number of food groups consumed.
Subsequently, three binary dietary indicators were established using standard WHO/UNICEF cut-off points: (1) minimum dietary diversity (MDD) was defined as consumption of five or more of the eight food groups within the previous 24 hours; children who met this threshold were coded as 1 and all the other children as 0. (2) Minimum meal frequency (MMF) was defined according to age and breastfeeding status: ≥2 solid, semi-solid, or soft feeds for breastfed children aged 6–8 months; ≥3 such feeds for breastfed children aged 9–23 months; and ≥4 feeds in total (combining solid meals and milk feeds) with at least two milk feeds for nonbreastfed children aged 6–23 months. Children who met the relevant age- and feeding status–specific threshold were coded as 1 and all the other children as 0. (3) Minimum acceptable diet (MAD), a composite summary indicator of overall diet adequacy that combines dietary diversity and feeding frequency into a single measure of whether a child received a minimally adequate diet, was defined as meeting the MDD and MMF simultaneously [
14]. In addition, the food group score (0–8) was categorized into three levels (0–2, 3–4, and ≥5 groups [MDD met]) to evaluate potential dose–response relationship with WaSt.
All analyses were conducted using Stata ver. 18.0 (StataCorp LLC). To account for the complex multi-stage stratified cluster sampling design of the CDHS, survey weights were applied throughout the analyses. All the reported prevalence estimates, confidence intervals (CIs), and regression coefficients were survey-weighted.
Unweighted frequencies and weighted percentages were calculated for categorical variables. Children were classified into four mutually exclusive nutritional status groups (normal, stunting only, wasting only, and WaSt). Differences in participant characteristics across these groups were assessed using the Rao-Scott design-based F test, a survey-adjusted version of Pearson chi-squared test that accounts for the complex sampling design. The prevalence of stunting, wasting, and WaSt with 95% CIs were estimated using survey-weighted proportions. Associations between each independent variable and WaSt were first evaluated via survey-weighted simple (unadjusted) logistic regression to obtain crude odds ratios (CORs) with 95% CIs. Reference categories for categorical variables were selected according to conventions used in published WaSt research: the oldest age group (48–59 months) for child age; male for sex; normal birth weight (≥2,500 g) for birth weight; secondary or higher for maternal education; normal BMI (18.5–24.9 kg/m²) for maternal BMI; middle or above for household wealth; urban for residence; and improved for water source and sanitation. For ordinal categorical variables (age group, maternal age quartiles, maternal education, BMI, antenatal care visits, wealth index, and food group score categories), tests for linear trend (P-trend) were conducted by entering the variable in its ordinal form.
WaSt-associated variables at P<0.20 in the bivariate analysis [
16], alongside variables considered theoretically important based on the UNICEF conceptual framework [
17], were entered into a multivariable survey-weighted logistic regression model to identify independent factors associated with WaSt. Adjusted odds ratios (AORs) with 95% CIs were reported, and statistical significance was set at P<0.05 (two-sided). Breastfeeding was evaluated only in the bivariate analysis as data were available only for the youngest coresident children (n=1,902).
For the subsample with dietary indicators of children aged 6–23 months (n=1,237), the associations between MDD, MMF, MAD, and the food group score categories and WaSt were evaluated using survey-weighted logistic regression. Owing to the small number of WaSt cases in this age subgroup (n=21), models were adjusted for a parsimonious set of covariates (child age in months as a continuous variable, child sex, and the three-category household wealth index) to avoid model overfitting.
Variables with substantial missingness (birth weight, 45.5%; antenatal care visits, 47.8%) were retained in the analysis, with “missing” coded as an explicit category, rather than excluding observations, to preserve statistical power and minimize selection bias caused by nonrandom missingness. No imputation was performed.
RESULTS
Descriptive data
The characteristics of the 3,420 children by nutritional status group are shown in
Table 1. The four groups were mutually exclusive; thus, children with WaSt were counted only in the WaSt category. Therefore, the overall prevalence rates were 22.4% for stunting and 9.3% for wasting, consistent with
Table 2. Overall, 70.5% of the children were normal, 20.3% stunted only, 7.2% wasted only, and 2.1% WaSt.
Nutritional status varied by child age and sex (P=0.030 and P=0.002, respectively). WaSt was uncommon during infancy and became more common after the age of 12 months. Furthermore, boys were more frequently affected than girls across all three abnormal categories, including WaSt (2.7% vs. 1.5%).
Birth weight and maternal nutritional status exhibited the steepest gradients. WaSt was observed in 7.2% of children with low birth weight, compared with 1.5% of those with normal birth weight (P=0.019), and in 5.7% of children of underweight mothers but only 0.6% of those of overweight or obese mothers (P<0.001).
Likewise, a socioeconomic gradient was evident. WaSt increased from 1.1% among children in households of middle wealth or above to 4.7% in the poorest households (P<0.001). Moreover, undernutrition became more common as maternal educational level declined (P<0.001). Children living in rural areas, using unimproved water sources, and lacking improved sanitation (P=0.002, P<0.001, and P=0.001, respectively) were also more frequently affected, although some categories included few children. Nutritional status did not differ by maternal age or antenatal care visits (P=0.432 and P=0.332, respectively). Therefore, children with WaSt clustered among those with low birth weight, undernourished mothers, and the poorest, least-educated households.
The dietary characteristics of the 1,237 children aged 6–23 months are presented in
Table 3. Just under half met the criteria for MDD (49.1%), whereas 80.3% and 43.7% met the MMF and MAD, respectively. Among the eight food groups, grains, roots, and tubers were the most commonly consumed (91.7%), followed by flesh foods (75.9%), vitamin A–rich fruits and vegetables (56.1%), and dairy products (54.4%). Legumes and nuts were the least-consumed food group (2.3%).
Of the 3,420 children in the main analytical sample, 765 were stunted, 317 were wasted, and 72 had WaSt. In the subsample with dietary indicators of 1,237 children aged 6–23 months, 21 had WaSt.
Main results
Prevalence of stunting, wasting, and WaSt
The survey-weighted prevalence of stunting was 22.4% (95% CI, 20.4%–24.5%), wasting 9.3% (95% CI, 7.9%–10.8%), and WaSt 2.1% (95% CI, 1.6%–2.8%) (
Table 2). All three forms of undernutrition were more prevalent in male than in female children: stunting (24.8% vs. 19.9%, P=0.003), wasting (11.0% vs. 7.5%, P=0.008), and WaSt (2.7% vs. 1.5%, P=0.042). Stunting prevalence significantly varied by age (P<0.001), being lowest at 6–11 months (13.5%) and highest at 12–23 months (27.3%). Contrarily, wasting and WaSt did not significantly differ across the age groups (P=0.447 and P=0.555, respectively).
Factors associated with WaSt
The crude and adjusted associations between child, maternal, and household characteristics and WaSt are shown in
Table 4. In the unadjusted analysis, female sex (COR, 0.55; 95% CI, 0.31–0.99), low birth weight (COR, 5.21; 95% CI, 2.06–13.18), lack of maternal education (COR, 3.85; 95% CI, 1.61–9.20), maternal underweight (COR, 2.50; 95% CI, 1.06–5.92), rural residence (COR, 2.39; 95% CI, 1.03–5.51), belonging to the poorest wealth tertile (COR, 4.27; 95% CI, 2.14–8.54), unimproved drinking water (COR, 2.51; 95% CI, 1.31–4.82), and open defecation (COR, 2.02; 95% CI, 1.02–4.00) exhibited significant association with WaSt. Significant linear trends were observed across maternal education, maternal BMI, and household wealth (all P<0.001).
In the multivariable model (n=3,205), four factors remained independently associated with WaSt. Female children had lower odds than males (AOR, 0.52; 95% CI, 0.28–0.97; P=0.041). Low birth weight was the strongest predictor (AOR, 4.93; 95% CI, 1.92–12.63; P=0.001). Maternal underweight was associated with higher odds of WaSt (AOR, 2.42; 95% CI, 1.06–5.56; P=0.037), whereas maternal overweight or obesity was associated with lower odds (AOR, 0.25; 95% CI, 0.10–0.65; P=0.004), relative to normal maternal BMI. Children from the poorest households had more than two-fold higher odds of WaSt than those from middle-or-above households (AOR, 2.46; 95% CI, 1.14–5.31; P=0.022). The associations of maternal education, rural residence, and open defecation were attenuated and lost statistical significance after adjustment, indicating that their crude effects were partially explained by household wealth and maternal nutritional status.
Dietary indicators and WaSt among children aged 6–23 months
The crude and adjusted associations between dietary indicators and WaSt are shown in
Table 5. None of the dietary indicators exhibited significant association with WaSt in either the unadjusted or adjusted analyses. After adjustment for child age, sex, household wealth, maternal BMI, and maternal education, meeting the MDD (AOR, 0.58; 95% CI, 0.19–1.78; P=0.343), MMF (AOR, 3.07; 95% CI, 0.75–12.63; P=0.119), and MAD (AOR, 0.88; 95% CI, 0.28–2.80; P=0.835) was not significantly associated with WaSt, and the food group score category showed no dose–response relationship (≥5 vs. 0–2 groups: AOR, 0.63; 95% CI, 0.12–3.22; P=0.581). In these models, maternal underweight remained significantly associated with higher odds of WaSt and household wealth with markedly higher odds among the poorest children, although the wide CIs reflect the small number of WaSt cases (n=21) in this subsample and should be cautiously interpreted.
DISCUSSION
This study investigated the prevalence of WaSt and its associated factors among Cambodian children aged 6–59 months using nationally representative CDHS 2021–2022 data. The prevalence of WaSt was 2.1%, with stunting affecting 22.4% and wasting 9.3% of children. The multivariable analysis revealed that low birth weight, maternal underweight, and belonging to the poorest households were independently associated with higher odds of WaSt, whereas female sex and maternal overweight or obesity were associated with lower odds. Notably, none of the dietary indicators (MDD, MMF, and MAD) exhibited an association with WaSt among children aged 6–23 months.
The WaSt prevalence of 2.1% observed in this study is comparable to the 2.4% reported among Indonesian children aged 6–23 months using a similar national survey [
18] and is consistent with the global pooled WaSt prevalence of approximately 3.5%, which tends to be higher in Asia (approximately 5%) than in other regions [
19]. It is lower than estimates from several other settings, including Mozambique (3.5%) [
4] and Ethiopia (4.7%–5.8%) [
10,
12]. The relatively lower prevalence in Cambodia may reflect the country’s substantial progress in reducing stunting over the past decade. However, the persistently high wasting prevalence of around 10% indicates that acute undernutrition remains an unresolved problem. Collectively, these patterns indicate a continuing nutritional transition for Cambodia, with longer-term reductions in stunting outpacing those in wasting. Over the past two decades, Cambodia’s rapid economic growth, urbanization, and gains in maternal education, sanitation, and access to clean water have resulted in a dramatic reduction in chronic undernutrition [
5,
20]. However, wasting has remained at approximately 10% over the same period [
6], reflecting its closer dependence on more acute and episodic factors, such as recent illness, seasonal food insecurity, and complementary feeding practices, which have not improved at the same pace. National data also indicate that fewer than half of Cambodian children aged 6–23 months meet the MAD criteria, and these feeding patterns have demonstrated slight improvement in the past decade [
21]. Similarly, a regional review of six Southeast Asian countries reported a pooled WaSt prevalence of 1.6% alongside a persistent wasting burden of 8.9%, noting that wasting has received less programmatic attention than stunting despite its greater risk of short-term mortality [
15]. This pattern suggests that conventional nutrition programs centered on chronic undernutrition are insufficient to address the persistence of acute undernutrition.
Low birth weight emerged as the strongest independent predictor of WaSt, with affected children exhibiting nearly five times higher odds. This is consistent with evidence from Indonesia, where low birth weight was associated with roughly three times higher odds of WaSt [
18]. Low birth weight reflects intrauterine growth restriction and prematurity, both of which impair linear growth and the accumulation of lean and fat mass, thereby increasing the risk of WaSt. The association with maternal nutritional status, with higher odds among underweight mothers and lower odds among overweight or obese mothers, further points to the intergenerational transmission of undernutrition, whereby maternal undernutrition contributes to impaired fetal growth, low birth weight, and subsequent child undernutrition. A similar protective effect of higher maternal BMI has been reported in Ethiopia, where children of mothers with a normal or higher BMI had significantly lower odds of WaSt than those of underweight mothers [
10].
Children belonging to the poorest households had more than two-fold higher odds of WaSt, consistent with evidence from India, where children from wealthier families were considerably less likely to experience WaSt [
19], and with the well-established socioeconomic gradient in child undernutrition. Interestingly, the crude associations of maternal education, rural residence, and inadequate sanitation weakened following adjustment, indicating that their associations are largely explained by household wealth and maternal nutritional status rather than representing independent effects. The lower odds of WaSt among girls are consistent with evidence showing that boys are more likely than girls to experience WaSt in early childhood [
22], the two conditions that collectively define WaSt. The underlying mechanisms driving this difference remain poorly understood and are likely multifactorial [
23]. Boys may be somewhat more physiologically vulnerable to early-life nutritional and infectious insults; however, the biological basis remains uncertain, particularly during infancy. Social factors are also likely to contribute, as the way sons and daughters are fed and cared for can differ. Notably, the same review reported a weaker male excess in South Asia, suggesting that social and environmental context influences the pattern rather than biology acting alone [
23]. Separating the biological from the social contributions to this sex difference warrants further study.
The finding that household wealth predicted WaSt while current dietary indicators did not may seem paradoxical. However, household wealth is a marker of cumulative, structural conditions rather than a single day’s diet. Poorer households experience sustained food insecurity; a higher burden of infection through inadequate water, sanitation, and hygiene; more limited access to health care; and greater maternal undernutrition. The pathways can influence child growth independently of complementary feeding diversity on any given day. As WaSt incorporates a chronic (stunting) component, it is more likely to reflect these accumulated deprivations than a contemporaneous measure of dietary diversity. Therefore, poverty may influence WaSt largely through infection-related, environmental, and intergenerational pathways rather than solely through current dietary intake.
Contrary to these established determinants, none of the dietary indicators were associated with WaSt, even after adjustment for maternal and household factors. This aligns with evidence that dietary diversity is more closely associated with chronic undernutrition than with acute wasting; in Tanzania, for example, low dietary diversity was significantly associated with stunting and underweight but not consistently with wasting [
24]. Several explanations are plausible. As WaSt includes an acute (wasting) component, it is more likely driven by recent illness, infection, and food insecurity than by current dietary diversity, whereas dietary indicators capture only a single 24-hour recall that may not reflect a child’s habitual intake. Furthermore, WaSt includes stunting, which slowly develops and reflects sustained nutritional deprivation over time. A single 24-hour recall records intake on 1 day only and cannot represent the repeated, day-after-day intake that influences linear growth. This mismatch between a short-term dietary measure and a partly chronic outcome may have attenuated the observed associations toward the null. The small number of WaSt cases in this subsample (n=21) also limited the statistical power to detect modest associations. Collectively, these considerations indicate that improving dietary diversity alone may be insufficient to reduce WaSt without parallel attention to infection control, maternal nutrition, and household poverty.
The strengths of this study include the use of recent nationally representative data with standardized anthropometric measurements based on WHO growth standards and the application of survey weights to account for the complex sampling design, which improves the generalizability of the findings. This study has several limitations that need to be acknowledged. First, the cross-sectional design precludes any inference of causality, and as WaSt is an acute condition, a single cross-sectional survey may underestimate its true burden. Second, the number of WaSt cases was small (n=72 overall and n=21 in the subsample with dietary indicators), which widened CIs, particularly in the maternal-adjusted models for the dietary indicators. Therefore, these estimates should be cautiously interpreted. Third, birth weight and antenatal care data had substantial missingness (45.5% and 47.8%, respectively). Although missingness was retained as an explicit category to preserve sample size, residual bias from nonrandom missingness cannot be ruled out. Finally, the dietary indicators and birth weight data relied on maternal recall, which is subject to recall bias.
Conclusion
In conclusion, WaSt affected approximately one in 50 Cambodian children aged 6–59 months and was independently associated with low birth weight, maternal underweight, and household poverty. The dietary information available in this study had three specific limitations: it was derived from a single 24-hour recall, which reflects only 1 day rather than habitual intake; the available indicators captured only meal frequency and whether a minimum number of food groups had been consumed, without information on portion sizes or dietary quality; and no detailed nutrient intake data were available, so energy, macronutrient, and micronutrient adequacy could not be evaluated. Within these limits, the dietary indicators exhibited no statistically significant association with WaSt; however, given the small number of WaSt cases (n=21), this reflects an absence of detectable association under limited statistical power rather than demonstrated evidence of no effect. Within these limits, the findings indicate that WaSt may be driven more by biological vulnerability and socioeconomic disadvantage than by current feeding practices alone. Further studies using more detailed dietary assessments are warranted to better understand the contribution of diet to WaSt. Overall, these findings highlight the need for integrated nutrition programs that address maternal nutrition, low birth weight, and poverty together, rather than treating WaSt as separate concerns, with particular attention to the most vulnerable households.
NOTES
-
Author Contributions
Conceptualization: SL. Formal analysis: ML. Investigation: ML. Methodology: all authors. Supervision: SL. Writing - original draft: ML. Writing - review & editing: SL. All authors read and approved the final manuscript.
-
Conflict of Interest
Seungmin Lee is an editorial board member of this journal, but was not involved in the peer reviewer selection, evaluation, or decision process of this article. No other potential conflict of interest relevant to this article was reported.
-
Funding
None.
-
Data availability
The data used in this study are not publicly available from the authors because they were obtained from a national statistical database. Access to the data is subject to the policies and procedures of the relevant data-providing agency.
Fig. 1.Participant selection flowchart. WaSt, wasting and stunting; HAZ, height-for-age z-score; WHZ, weight-for-height z-score; SD, standard deviation.
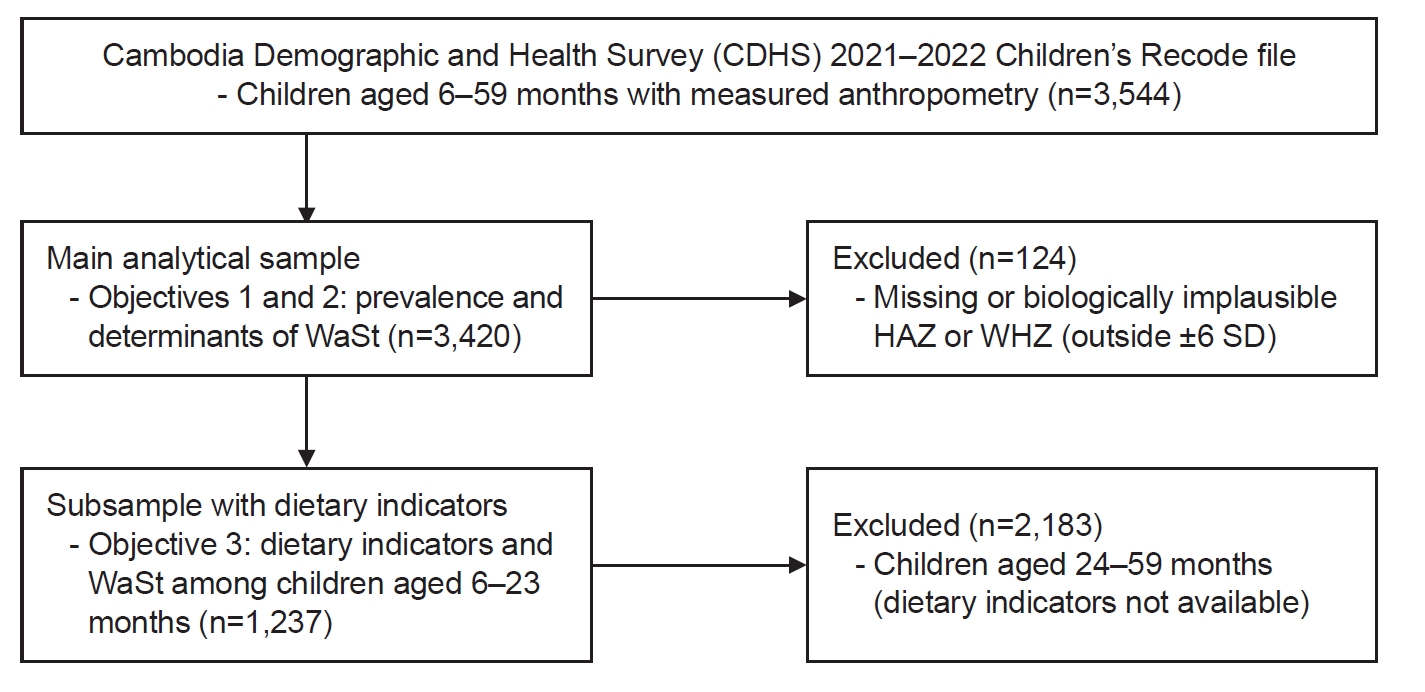
Table 1.Characteristics of children aged 6–59 months by nutritional status, Cambodia Demographic and Health Survey 2021–2022 (n=3,420)
Table 1.
|
Characteristic |
Total sample |
Normal (%) |
Stunting only (%) |
Wasting only (%) |
WaSt (%) |
P-valuea)
|
|
All children |
3,420 (100) |
70.5 |
20.3 |
7.2 |
2.1 |
- |
|
Child age (mo) |
|
|
|
|
|
0.030 |
|
6–11 |
399 (12.2) |
76.6 |
12.7 |
9.9 |
0.8 |
|
|
12–23 |
838 (24.1) |
68.0 |
25.1 |
4.7 |
2.2 |
|
|
24–35 |
665 (20.1) |
68.7 |
21.2 |
8.0 |
2.0 |
|
|
36–47 |
762 (21.9) |
71.2 |
19.2 |
7.1 |
2.5 |
|
|
48–59 |
756 (21.8) |
70.6 |
19.3 |
7.6 |
2.4 |
|
|
Child sex |
|
|
|
|
|
0.002 |
|
Male |
1,738 (50.4) |
66.9 |
22.1 |
8.3 |
2.7 |
|
|
Female |
1,682 (49.6) |
74.1 |
18.4 |
6.0 |
1.5 |
|
|
Birth weight (g) |
|
|
|
|
|
0.019 |
|
Normal (≥2,500) |
1,699 (51.2) |
70.7 |
20.6 |
7.2 |
1.5 |
|
|
Low (<2,500) |
125 (3.3) |
59.8 |
28.2 |
4.8 |
7.2 |
|
|
Missing/don’t know |
1,596 (45.5) |
70.9 |
19.4 |
7.2 |
2.5 |
|
|
Maternal age at birth (yr)b)
|
|
|
|
|
|
0.432 |
|
14–23 |
842 (23.9) |
70.0 |
22.7 |
5.7 |
1.6 |
|
|
24–27 |
661 (23.2) |
71.7 |
19.0 |
6.9 |
2.4 |
|
|
28–32 |
713 (26.2) |
72.2 |
18.1 |
7.2 |
2.6 |
|
|
33–49 |
716 (26.7) |
67.8 |
20.9 |
9.4 |
1.9 |
|
|
Maternal education |
|
|
|
|
|
<0.001 |
|
No education |
453 (10.3) |
59.3 |
24.3 |
12.2 |
4.1 |
|
|
Primary |
1,466 (42.2) |
65.6 |
24.1 |
7.5 |
2.7 |
|
|
Secondary or higher |
1,501 (47.4) |
77.2 |
16.0 |
5.7 |
1.1 |
|
|
Maternal BMI (kg/m²)c)
|
|
|
|
|
|
<0.001 |
|
Underweight (<18.5) |
221 (7.1) |
52.8 |
26.7 |
14.8 |
5.7 |
|
|
Normal (18.5–24.9) |
2,148 (65.0) |
71.1 |
19.1 |
7.5 |
2.4 |
|
|
Overweight/obese (≥25.0) |
849 (28.0) |
74.0 |
20.7 |
4.7 |
0.6 |
|
|
Antenatal care visits |
|
|
|
|
|
0.332 |
|
≥4 |
1,475 (45.8) |
70.8 |
20.8 |
6.6 |
1.8 |
|
|
1–3 |
272 (6.4) |
63.6 |
22.3 |
11.8 |
2.4 |
|
|
None/missing |
1,673 (47.8) |
71.1 |
19.5 |
7.1 |
2.4 |
|
|
Place of residence |
|
|
|
|
|
0.002 |
|
Urban |
1,139 (38.5) |
76.4 |
15.8 |
6.7 |
1.2 |
|
|
Rural |
2,281 (61.5) |
66.8 |
23.1 |
7.4 |
2.7 |
|
|
Household wealth index |
|
|
|
|
|
<0.001 |
|
Poorest |
1,076 (22.9) |
61.1 |
27.4 |
6.9 |
4.7 |
|
|
Poorer |
620 (19.1) |
68.2 |
21.5 |
8.2 |
2.0 |
|
|
Middle or above |
1,724 (58.0) |
74.9 |
17.1 |
6.9 |
1.1 |
|
|
Drinking water source |
|
|
|
|
|
<0.001 |
|
Improved |
2,765 (85.8) |
71.9 |
19.2 |
7.2 |
1.8 |
|
|
Unimproved |
644 (14.2) |
60.8 |
27.5 |
7.5 |
4.3 |
|
|
Sanitation facility |
|
|
|
|
|
0.001 |
|
Improved |
2,758 (87.4) |
71.7 |
19.4 |
7.1 |
1.9 |
|
|
Unimproved |
32 (0.7) |
63.9 |
26.6 |
2.4 |
7.1 |
|
|
Open defecation |
616 (12.0) |
60.3 |
27.5 |
8.4 |
3.7 |
|
Table 2.Survey-weighted prevalence of stunting, wasting, and WaSt among Cambodian children aged 6–59 months, CDHS 2021–2022 (n=3,420)
Table 2.
|
Characteristic |
Stunting |
Wasting |
WaSt |
|
Weighted % (95% CI) |
P-value |
Weighted % (95% CI) |
P-value |
Weighted % (95% CI) |
P-value |
|
Overall |
22.4 (20.4–24.5) |
- |
9.3 (7.9–10.8) |
- |
2.1 (1.6–2.8) |
- |
|
Sex |
|
0.003 |
|
0.008 |
|
0.042 |
|
Male |
24.8 (22.1–27.6) |
|
11.0 (9.0–13.4) |
|
2.7 (1.9–3.8) |
|
|
Female |
19.9 (17.6–22.5) |
|
7.5 (6.0–9.3) |
|
1.5 (1.0–2.4) |
|
|
Age (mo) |
|
<0.001 |
|
0.447 |
|
0.555 |
|
6–11 |
13.5 (9.8–18.3) |
|
10.7 (7.1–15.8) |
|
0.8 (0.2–2.4) |
|
|
12–23 |
27.3 (23.4–31.6) |
|
6.9 (5.2–9.2) |
|
2.2 (1.3–3.7) |
|
|
24–35 |
23.3 (19.2–28.0) |
|
10.0 (6.4–15.5) |
|
2.0 (1.0–4.0) |
|
|
36–47 |
21.7 (18.5–25.2) |
|
9.6 (7.2–12.6) |
|
2.5 (1.4–4.2) |
|
|
48–59 |
21.8 (18.3–25.7) |
|
10.1 (7.6–13.2) |
|
2.4 (1.3–4.6) |
|
Table 3.Dietary characteristics of children aged 6–23 months in the Cambodia Demographic and Health Survey 2021–2022 (n=1,237)
Table 3.
|
Dietary characteristic |
No. of participants |
Weighted % (95% CI) |
|
Dietary indicator |
|
|
|
MDDa)
|
565 |
49.1 (45.4–52.7) |
|
MMFb)
|
1,016 |
80.3 (77.1–83.2) |
|
MADc)
|
500 |
43.7 (39.9–47.5) |
|
Food group score category |
|
|
|
0–2 food groups |
187 |
14.5 (12.3–17.0) |
|
3–4 food groups |
485 |
36.5 (33.1–40.0) |
|
≥5 food groups (MDD met) |
565 |
49.1 (45.4–52.7) |
|
Individual food groups consumed (DHS-8) |
|
|
|
Breast milk |
711 |
51.4 (47.7–55.2) |
|
Grains, roots, and tubers |
1,143 |
91.7 (89.6–93.5) |
|
Legumes and nuts |
21 |
2.3 (1.3–4.3) |
|
Dairy products |
584 |
54.4 (50.9–57.9) |
|
Flesh foods |
926 |
75.9 (72.8–78.8) |
|
Eggs |
512 |
43.3 (39.5–47.2) |
|
Vitamin A–rich fruits/vegetables |
660 |
56.1 (52.2–60.0) |
|
Other fruits and vegetables |
585 |
48.8 (45.5–52.1) |
Table 4.Crude and adjusted associations between child, maternal, and household characteristics and concurrent wasting and stunting among Cambodian children aged 6–59 months, CDHS 2021–2022
Table 4.
|
Variable |
COR (95% CI) |
P-value |
AOR (95% CI) |
P-value |
|
Child age (mo) (P-trend=0.154) |
|
|
|
|
|
48–59 |
1.00 (Reference) |
- |
1.00 (Reference) |
- |
|
36–47 |
1.00 (0.41–2.45) |
0.991 |
0.79 (0.31–2.04) |
0.632 |
|
24–35 |
0.83 (0.32–2.17) |
0.708 |
0.66 (0.15–2.90) |
0.577 |
|
12–23 |
0.90 (0.40–2.01) |
0.798 |
0.76 (0.17–3.48) |
0.728 |
|
6–11 |
0.31 (0.08–1.18) |
0.086 |
0.24 (0.04–1.46) |
0.121 |
|
Child sex |
|
|
|
|
|
Male |
1.00 (Reference) |
- |
1.00 (Reference) |
- |
|
Female |
0.55 (0.31–0.99) |
0.045 |
0.52 (0.28–0.97) |
0.041 |
|
Birth weight |
|
|
|
|
|
Normal (≥2,500 g) |
1.00 (Reference) |
- |
1.00 (Reference) |
- |
|
Low (<2,500 g) |
5.21 (2.06–13.18) |
0.001 |
4.93 (1.92–12.63) |
0.001 |
|
Missing/don't know |
1.71 (0.92–3.20) |
0.091 |
1.21 (0.27–5.50) |
0.801 |
|
Maternal age at birth (yr) (P-trend=0.724) |
|
|
|
|
|
24–27 |
1.00 (Reference) |
- |
- |
|
|
14–23 |
0.66 (0.29–1.50) |
0.322 |
- |
- |
|
28–32 |
1.08 (0.45–2.57) |
0.870 |
- |
- |
|
33–49 |
0.78 (0.33–1.82) |
0.566 |
- |
- |
|
Maternal education (P-trend<0.001) |
|
|
|
|
|
Secondary or higher |
1.00 (Reference) |
- |
1.00 (Reference) |
- |
|
Primary |
2.54 (1.17–5.51) |
0.019 |
1.94 (0.89–4.26) |
0.098 |
|
No education |
3.85 (1.61–9.20) |
0.003 |
2.62 (0.91–7.50) |
0.074 |
|
Maternal BMI (kg/m²) (P-trend<0.001) |
|
|
|
|
|
Normal (18.5–24.9) |
1.00 (Reference) |
- |
1.00 (Reference) |
- |
|
Underweight (<18.5) |
2.50 (1.06–5.92) |
0.037 |
2.42 (1.06–5.56) |
0.037 |
|
Overweight/obese (≥25.0) |
0.25 (0.10–0.64) |
0.004 |
0.25 (0.10–0.65) |
0.004 |
|
Antenatal care visits (P-trend=0.303) |
|
|
|
|
|
≥4 |
1.00 (Reference) |
- |
- |
- |
|
1–3 |
1.34 (0.46–3.93) |
0.591 |
- |
- |
|
None/missing |
1.37 (0.75–2.48) |
0.302 |
- |
- |
|
Place of residence |
|
|
|
|
|
Urban |
1.00 (Reference) |
- |
1.00 (Reference) |
- |
|
Rural |
2.39 (1.03–5.51) |
0.042 |
1.33 (0.59–3.00) |
0.494 |
|
Household wealth index (P-trend<0.001) |
|
|
|
|
|
Middle or above |
1.00 (Reference) |
- |
1.00 (Reference) |
- |
|
Poorer |
1.77 (0.76–4.10) |
0.185 |
1.15 (0.50–2.68) |
0.741 |
|
Poorest |
4.27 (2.14–8.54) |
<0.001 |
2.46 (1.14–5.31) |
0.022 |
|
Drinking water source |
|
|
|
|
|
Improved |
1.00 (Reference) |
- |
- |
- |
|
Unimproved |
2.51 (1.31–4.82) |
0.006 |
- |
- |
|
Sanitation facility |
|
|
|
|
|
Improved |
1.00 (Reference) |
- |
1.00 (Reference) |
- |
|
Unimproved |
4.00 (0.58–27.81) |
0.161 |
3.66 (0.68–19.73) |
0.131 |
|
Open defecation |
2.02 (1.02–4.00) |
0.045 |
0.72 (0.33–1.58) |
0.415 |
|
Breastfeeding statusa)
|
|
|
|
|
|
Currently breastfeeding |
1.00 (Reference) |
- |
- |
- |
|
Ever breastfed, not current |
0.47 (0.20–1.11) |
0.086 |
- |
- |
|
Never breastfed |
0.44 (0.11–1.85) |
0.264 |
- |
- |
Table 5.Crude and adjusted associations between dietary indicators and WaSt among Cambodian children aged 6–23 months, CDHS 2021–2022
Table 5.
|
Dietary indicator |
COR (95% CI) |
P-value |
AOR (95% CI)a)
|
P-value |
|
MDD met |
0.48 (0.17–1.33) |
0.158 |
0.58 (0.19–1.78) |
0.343 |
|
MMF met |
1.77 (0.44–7.15) |
0.419 |
3.07 (0.75–12.63) |
0.119 |
|
MAD met |
0.63 (0.22–1.81) |
0.387 |
0.88 (0.28–2.80) |
0.835 |
|
Food group score |
|
- |
|
- |
|
0–2 groups |
|
1.00 (Reference) |
- |
1.00 (Reference) |
- |
|
3–4 groups |
|
1.75 (0.42–7.33) |
0.440 |
1.11 (0.24–5.11) |
0.894 |
|
≥5 groups (MDD met) |
|
0.74 (0.17–3.28) |
0.687 |
0.63 (0.12–3.22) |
0.581 |
REFERENCES
- 1. World Health Organization. Joint child malnutrition estimates 2024 [Internet]. World Health Organization; 2024 [cited 2026 Jun 1]. Available from: https://www.who.int/data/gho/data/themes/topics/joint-child-malnutrition-estimates-unicef-who-wb
- 2. World Health Organization (WHO); United Nations Children's Fund (UNICEF); World Bank Group. Levels and trends in child malnutrition: UNICEF/WHO/World Bank Group joint child malnutrition estimates: key findings of the 2025 edition. World Health Organization; 2025.
- 3. Thurstans S, Sessions N, Dolan C, et al. The relationship between wasting and stunting in young children: a systematic review. Matern Child Nutr 2022;18:e13246.
- 4. Zaba T, Conkle J, Nyawo M, Foote D, Myatt M. Concurrent wasting and stunting among children 6-59 months: an analysis using district-level survey data in Mozambique. BMC Nutr 2022;8:15.
- 5. National Institute of Statistics (NIS); Ministry of Health. Cambodia: demographic and health survey 2021–2022. National Institute of Statistics; 2023.
- 6. United Nations Children's Fund (UNICEF). UNICEF and Cambodia renew commitments to improving nutrition for all [Internet]. UNICEF; 2025 [cited 2026 Jun 1]. Available from: https://www.unicef.org/cambodia/press-releases/unicef-and-cambodia-renew-commitments-improving-nutrition-all
- 7. UN Nutrition. Cambodia nutrition stakeholder and action mapping [Internet] UN Nutrition. 2024 [cited 2026 Jun 1]. Available from: https://www.unnutrition.org/sites/default/files/2024-04/Cambodia%20Mapping-2024%20%28final%29.pdf
- 8. Dassie GA, Chala Fantaye T, Charkos TG, Sento Erba M, Balcha Tolosa F. Factors influencing concurrent wasting, stunting, and underweight among children under five who suffered from severe acute malnutrition in low- and middle-income countries: a systematic review. Front Nutr 2024;11:1452963.
- 9. Lai A, Velez I, Ambikapathi R, Seng K, Cumming O, Brown J. Risk factors for early childhood growth faltering in rural Cambodia: a cross-sectional study. BMJ Open 2022;12:e058092.
- 10. Roba AA, Assefa N, Dessie Y, et al. Prevalence and determinants of concurrent wasting and stunting and other indicators of malnutrition among children 6-59 months old in Kersa, Ethiopia. Matern Child Nutr 2021;17:e13172.
- 11. Mertens A, Benjamin-Chung J, Colford JM Jr, et al. Child wasting and concurrent stunting in low- and middle-income countries. Nature 2023;621:558-67.
- 12. Roba AA, Basdas O. Multilevel analysis of trends and predictors of concurrent wasting and stunting among children 6-59 months in Ethiopia from 2000 to 2019. Front Nutr 2023;10:1073200.
- 13. Victora CG, de Onis M, Hallal PC, Blossner M, Shrimpton R. Worldwide timing of growth faltering: revisiting implications for interventions. Pediatrics 2010;125:e473-80.
- 14. World Health Organization (WHO); United Nations Children's Fund (UNICEF). Indicators for assessing infant and young child feeding practices: definitions and measurement methods. World Health Organization; 2021.
- 15. World Health Organization (WHO); United Nations Children's Fund (UNICEF). WHO Child Growth Standards: length/height-for-age, weight-for-age, weight-for-length, weight-for-height and body mass index-for-age: methods and development. World Health Organization; 2006.
- 16. Hosmer DW, Lemeshow S. Applied logistic regression. 2nd ed. John Wiley & Sons; 2000.
- 17. United Nations Children's Fund (UNICEF). UNICEF conceptual framework on maternal and child nutrition. UNICEF; 2021.
- 18. Jokhu LA, Syauqy A. Determinants of concurrent wasting and stunting among children 6 to 23 mo in Indonesia. Nutrition 2024;122:112390.
- 19. Khura B, Mohanty P, Gandhi AP, et al. Mapping concurrent wasting and stunting among children under five in India: a multilevel analysis. Int J Public Health 2023;68:1605654.
- 20. Nakphong MK, Beltran-Sanchez H. Socio-economic status and the double burden of malnutrition in Cambodia between 2000 and 2014: overweight mothers and stunted children. Public Health Nutr 2021;24:1806-17.
- 21. United Nations Children's Fund (UNICEF). Young children’s diets show no improvement in last decade, ‘could get much worse’ under COVID-19 - UNICEF [Internet]. UNICEF; 2021 [cited 2026 Jun 1]. Available from: https://www.unicef.org/press-releases/young-childrens-diets-show-no-improvement-last-decade-could-get-much-worse-under
- 22. Thurstans S, Opondo C, Seal A, et al. Boys are more likely to be undernourished than girls: a systematic review and meta-analysis of sex differences in undernutrition. BMJ Glob Health 2020;5:e004030.
- 23. Thurstans S, Opondo C, Seal A, et al. Understanding sex differences in childhood undernutrition: a narrative review. Nutrients 2022;14:948.
- 24. Khamis AG, Mwanri AW, Ntwenya JE, Kreppel K. The influence of dietary diversity on the nutritional status of children between 6 and 23 months of age in Tanzania. BMC Pediatr 2019;19:518.