ABSTRACT
-
Objective
Because vitamin D deficiency is associated with diabetes and insulin resistance, and the triglyceride-glucose (TyG) index is a reliable marker of metabolic health, this study aimed to clarify the association between vitamin D status and the TyG index.
-
Methods
A cross-sectional analysis was conducted on 4,819 participants from the 2022 Korea National Health and Nutrition Examination survey, stratified by age and sex. Vitamin D deficiency was defined as blood 25-hydroxyvitamin D3 (25(OH)D3) <20 ng/mL, and a metabolically unhealthy state as a TyG index of ≥8.82 and ≥8.73 for men and women, respectively.
-
Results
Approximately 46.9% of South Korean adults were vitamin D deficient, and 35.5% were metabolically unhealthy. After adjustment, blood 25(OH)D3 levels were inversely correlated with the TyG index in younger women (β=−0.004, standard error [SE]=0.002, P=0.039), middle-aged men (β=−0.006, SE=0.003, P=0.015), and older men (β=−0.008, SE=0.002, P=0.002). Vitamin D deficiency was associated with a higher risk of a metabolically unhealthy state in middle-aged men (odds ratio [OR], 1.59; 95% confidence interval [CI], 1.11−2.28) and older men (OR, 2.15; 95% CI, 1.31−3.55).
-
Conclusion
These findings suggest that adequate vitamin D status may help maintain a metabolically healthy state, and the TyG index may help identify vitamin D insufficiency or deficiency, particularly in middle-aged and older South Korean men.
-
Keywords: Vitamin D; Triglycerides; Glucose; Metabolism; Nutrition surveys
INTRODUCTION
The triglyceride-glucose (TyG) index, which integrates fasting glucose and triglyceride levels [
1], is a simple marker of metabolic health [
2]. TyG index correlates positively with the severity of insulin resistance, hepatic steatosis, and cardiovascular disease [
3]. Therefore, the TyG index can identify individuals with multiple metabolic disorders, including metabolic syndrome [
3]. Although thresholds vary across studies, a TyG index of <8.0 is generally considered optimal, while 8.8 to 9.0 indicates a high risk of metabolic dysfunction [
3,
4]. In a study of nationally representative South Korean data, TyG levels paralleled the risk of metabolic syndrome, with cut-off values for the metabolically unhealthy phenotype of 8.82 in men and 8.73 in women [
5].
Although vitamin D primarily maintains skeletal health and regulates calcium and phosphate homeostasis, vitamin D receptors are also expressed in various cell types, including adipocytes, myocytes, and multiple types of immune cells [
6]. Thus, vitamin D regulates adiposity, insulin signaling, and muscle protein synthesis, and several studies have linked vitamin D deficiency to obesity, diabetes, cardiovascular diseases, and sarcopenia [
7-
9].
Recent studies have shown an inverse association between vitamin D levels and the TyG index; however, these have largely focused on individuals with diabetes, metabolic dysfunction-associated steatotic liver disease, or other metabolic diseases [
2,
10,
11], and the relationship in healthy individuals stratified by age remains unclear. Therefore, this study aimed to assess whether vitamin D status is associated with the TyG index among young, middle-aged, and older men and women in a nationally representative South Korean population.
METHODS
Ethics statement
This study analyzed data from the 2022 Korea National Health and Nutrition Examination Survey (KNHANES IX-1). Data collection for KNHANES IX-1 was approved by the Institutional Review Board of the Korea Disease Control and Prevention Agency (No. 2018-01-03-4C-A, 2022-11-16-R-A). All study procedures adhered to the Declaration of Helsinki, and written informed consent was obtained from all participants. The study is reported according to the Strengthening the Reporting of Observational Studies in Epidemiology guidelines.
Participants
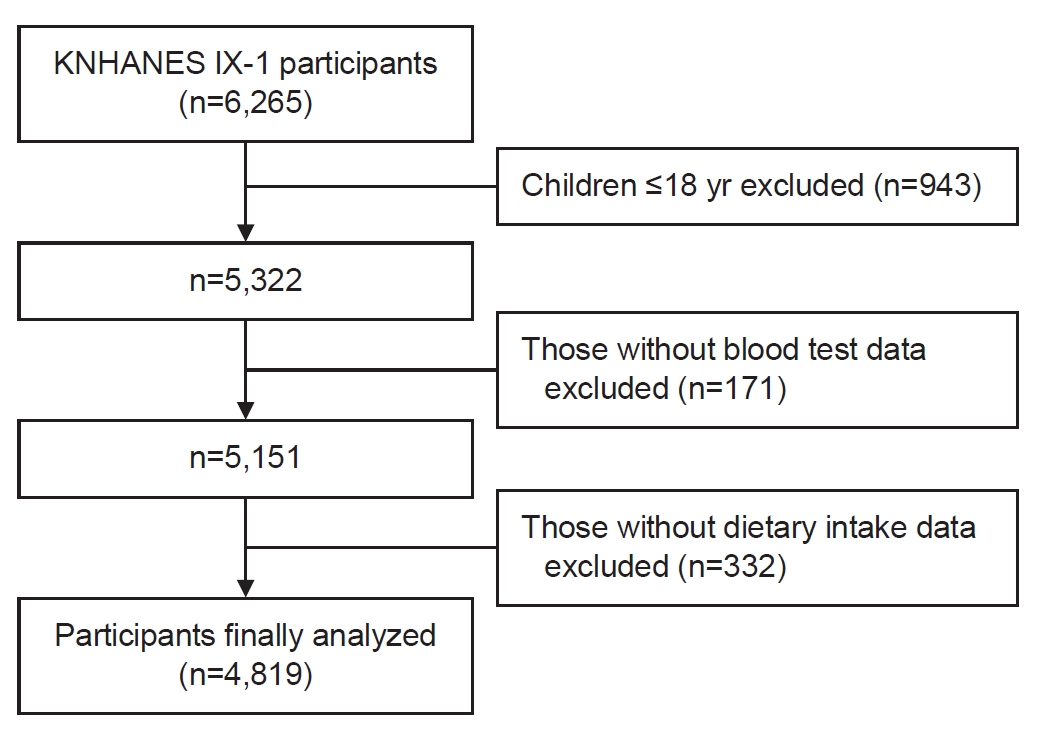
Of 6,265 participants from the KNHANES IX-1, children aged ≤18 years (n=943), those lacking blood test data (n=171), and those missing dietary intake data (n=332) were excluded (
Fig. 1). Although interaction effects between age and sex were not tested, to adjust possible biological differences, the final sample of 4,819 participants was stratified by age and sex into younger men (19–39 years, n=529), younger women (19–39 years, n=650), middle-aged men (40–64 years, n=894), middle-aged women (40–64 years, n=1,245), older men (≥65 years, n=670), and older women (≥65 years, n=831).
Blood samples were collected after an overnight fast (≥8 hours). Vitamin D status was assessed by measuring blood 25-hydroxyvitamin D
3 (25(OH)D3) levels using liquid chromatography-mass spectrometry, and levels <20 ng/mL were classified as vitamin D deficiency based on established consensus [
12-
14]. Blood triglyceride levels were measured using an enzymatic colorimetric assay (TRIGL, Roche), and blood glucose was assessed by hexokinase UV assay (Glucose HK Gen.3, Roche) [
15]. The TyG index was calculated as ln [fasting triglycerides (mg/dL)×fasting blood glucose (mg/dL)/2]. A TyG index ≥8.82 in men and ≥8.73 in women was defined as a metabolically unhealthy state [
3,
5].
Body mass index (BMI) was calculated as weight (kg) divided by height squared (m²). Household income was categorized into quartiles (low, middle-low, middle-high, and high). Current alcohol consumption was defined as drinking alcohol more than once per month in the year preceding the interview. Current smokers were defined as individuals who had smoked at least 100 cigarettes in their lifetime and were still smoking at the time of assessment. Regular aerobic exercise was defined as ≥2.5 hours of moderate-intensity physical activity, ≥1.25 hours of vigorous-intensity activity, or an equivalent combination per week, where 1 minute of vigorous activity counted as 2 minutes of moderate activity.
Dietary intake was assessed using a single 24-hour dietary recall conducted by trained dietitians. Daily intake of total energy, foods, and nutrients was estimated using the KNHANES recipe database and food composition tables from the Korean Rural Development Administration [
16].
All statistical analyses were performed using IBM SPSS ver. 29 (IBM Corp.), accounting for the complex survey design, including stratification, clustering, and sampling weights [
17]. Statistical significance was defined as a two-tailed P-value <0.05.
General characteristics were summarized by vitamin D status as means±standard errors (SEs) for continuous variables and counts (percentages) for categorical variables. Differences between participants with normal and deficient vitamin D status were assessed using Rao-Scott chi-square tests for categorical variables and independent t-tests for continuous variables.
The association between blood vitamin D levels and the TyG index was assessed using complex-sample general linear regression models, while the relationship between vitamin D status and metabolically unhealthy state (TyG index ≥8.82 in men and ≥8.73 in women [
5]) was examined using complex-sample logistic regression, with the normal vitamin D status group set as the reference. The unadjusted model estimated crude beta coefficients (β) and SE or crude odds ratios (OR) with 95% confidence intervals (CIs). Model 1 was adjusted for age, body fat percentage, and total energy intake. Model 2 was additionally adjusted for household income, alcohol consumption, smoking, and regular aerobic exercise.
RESULTS
The prevalences of vitamin D deficiency and metabolically unhealthy state among South Korean adults were 46.9% and 35.5%, respectively. Vitamin D deficiency was most prevalent in younger men (19–39 years, 65.0%), followed by younger women (19–39 years, 61.1%), middle-aged men (40–64 years, 46.7%), middle-aged women (40–64 years, 38.0%), older men (≥65 years, 37.4%), and older women (≥65 years, 27.4%). The metabolically unhealthy state was most prevalent in middle-aged men (53.7%), followed by older women (42.0%), older men (36.5%), younger men (33.5%), middle-aged women (28.9%), and younger women (15.3%) (
Fig. 2).
Younger adults (19–39 years) with vitamin D deficiency, were younger and tended to have higher body fat percentage. In younger women, vitamin D deficiency was also associated with a higher likelihood of current smoking and higher BMI. In middle-aged adults (40–64 years), those with vitamin D deficiency were younger; middle-aged men were more likely to be current smokers and metabolically unhealthy, while middle-aged women tended to have higher BMI and waist circumference. Among older men (≥65 years), vitamin D deficiency was associated with older age, higher likelihood of metabolic unhealthiness, and lower dietary vitamin D intake, whereas older women tended to have higher waist circumference. Mean dietary vitamin D intake ranged from 2.30 to 3.72 μg/day, which is substantially below the adequate intake of 10 μg for younger and middle-aged adults and 15 μg for older adults in the Dietary Reference Intake for South Koreans (
Tables S1–
S3) [
18].
After adjustment for confounding variables, including age, percent body fat, energy intake, household income, alcohol consumption, smoking, and aerobic exercise, blood 25(OH)D3 levels were inversely correlated with the TyG index in younger women (β=−0.004, SE=0.002, P=0.039), middle-aged men (β=−0.006, SE=0.003, P=0.015), and older men (β=−0.008, SE=0.002, P=0.002). Vitamin D deficiency was also associated with a higher risk of metabolically unhealthy state in middle-aged men (OR, 1.59; 95% CI, 1.11−2.28) and older men (OR, 2.15; 95% CI, 1.31−3.55) compared with their counterparts (
Tables 1 and
2).
DISCUSSION
Analysis of the KNHANES IX-1 data revealed an association between vitamin D status and metabolic health. Blood 25(OH)D3 levels were inversely correlated with the TyG index in younger women (19–39 years), middle-aged men (40–64 years), and older (≥65 years) men. In addition, vitamin D deficiency was associated with a higher risk of a metabolically unhealthy state defined by the TyG index in middle-aged and older men.
Insulin resistance likely underlies this association. Vitamin D is known to exert antidiabetic effects by enhancing insulin sensitivity and suppressing inflammation [
8], while elevated fasting glucose and triglyceride levels, key components of the TyG index, are characteristics of insulin resistance [
19]. This association may also be partly explained by adiposity. The TyG index has been positively correlated with body fat percentage [
20], and excess adipose tissue, the primary vitamin D storage, may sequester or dilute vitamin D, thereby reducing its circulating bioavailability or concentrations [
21].
Previous studies across diverse populations have also reported an association between vitamin D deficiency and the TyG index. In the USA, mortality was positively associated with the TyG index and negatively with vitamin D levels, with a stronger association of vitamin D and TyG index observed in patients with diabetes [
22]. Among Algerian adults with type 2 diabetes, vitamin D deficiency was associated with a 4.1-fold higher risk of an elevated TyG index (TyG index >quartile 1) [
23]. Indian adolescents with vitamin D deficiency had a 1.9-fold higher risk of insulin resistance (TyG index ≥4.65). In Indian and Iranian adults with prediabetes or type 2 diabetes, blood 25(OH)D levels were negatively correlated with the TyG index [
24]. Conversely, elderly Chinese adults with type 2 diabetes in the highest TyG quartile had a 2.4-fold higher risk of vitamin D deficiency compared with those in the lowest quartile [
25], and Arabian normoglycemic adolescents in the highest TyG tertile had a 1.5-fold higher risk of vitamin D deficiency [
26].
In this study, vitamin D deficiency was not associated with an unhealthy metabolic phenotype defined by the TyG index in women across all age groups. Similar findings have been reported previously [
26,
27]. This sex difference may be explained by the higher prevalence of visceral obesity in men, as greater visceral fat accumulation has been more strongly linked to vitamin D insufficiency and deficiency [
28]. In addition, the TyG index is positively correlated with visceral fat area and visceral fat area to subcutaneous fat area ratio, but not with subcutaneous fat area alone, and has been associated with visceral obesity risk [
29]. The lack of association observed in younger men may be attributable to the lower prevalence of insulin resistance in this group, as rates of type 2 diabetes and hyperglycemia are substantially lower in younger men than in middle-aged and older men [
30].
Although several studies have reported an inverse association between vitamin D status and the TyG index, this study adds value by demonstrating different associations across age- and sex-stratified groups in a nationally representative population. This study has several limitations. The cross-sectional design of KNHANES precludes cause-and-effect relationships. Exclusion of participants with missing data may have affected the representativeness of the data. A single 24-hour dietary recall may not fully reflect usual dietary intake. In addition, KNHANES did not collect data on sun exposure or seasonal variation, both of which may influence serum vitamin D levels.
In summary, this study found that vitamin D status was inversely associated with the risk of a metabolically unhealthy state defined by the TyG index in South Korean men. These findings suggest that adequate vitamin D status is closely linked to metabolic fitness, particularly in middle-aged and older men, and that the TyG index may help identify individuals with vitamin D insufficiency or deficiency. Given that multiple studies across diverse populations have reported a significant association between vitamin D and the TyG index, the TyG index may be useful for assessing vitamin D status beyond the South Korean population. To better elucidate the mechanisms underlying the relationship between vitamin D and the TyG index, preclinical or interventional human studies are warranted.
NOTES
-
Author Contributions
All the work was done by SS.
-
Conflict of Interest
None.
-
Funding
This work was supported by a research grant from Seoul Women’s University (2026-0012).
-
Data availability
Datasets analyzed in this study are available in the Korea Disease Control and Prevention Agency repository, https://knhanes.kdca.go.kr/.
Supplementary materials
Fig. 1.A flow diagram of inclusion and exclusion criteria. Of 6,265 participants from the 2022 Korea National Health and Nutrition Examination Survey (KNHANES IX-1), children aged ≤18 years (n=943), those without blood test data (n=171), and those missing dietary intake data (n=332) were excluded. A final sample of 4,819 participants was stratified by age and sex to account for biological differences.

Fig. 2.Prevalence of vitamin D deficiency and metabolically unhealthy state by age and sex. Vitamin D deficiency is defined as serum 25-hydroxyvitamin D3 <20 ng/mL, and a metabolically unhealthy state as a triglyceride-glucose (TyG) index ≥8.82 in men and ≥8.73 in women. The TyG index is calculated as ln [fasting triglycerides (mg/dL)×fasting glucose (mg/dL)/2].
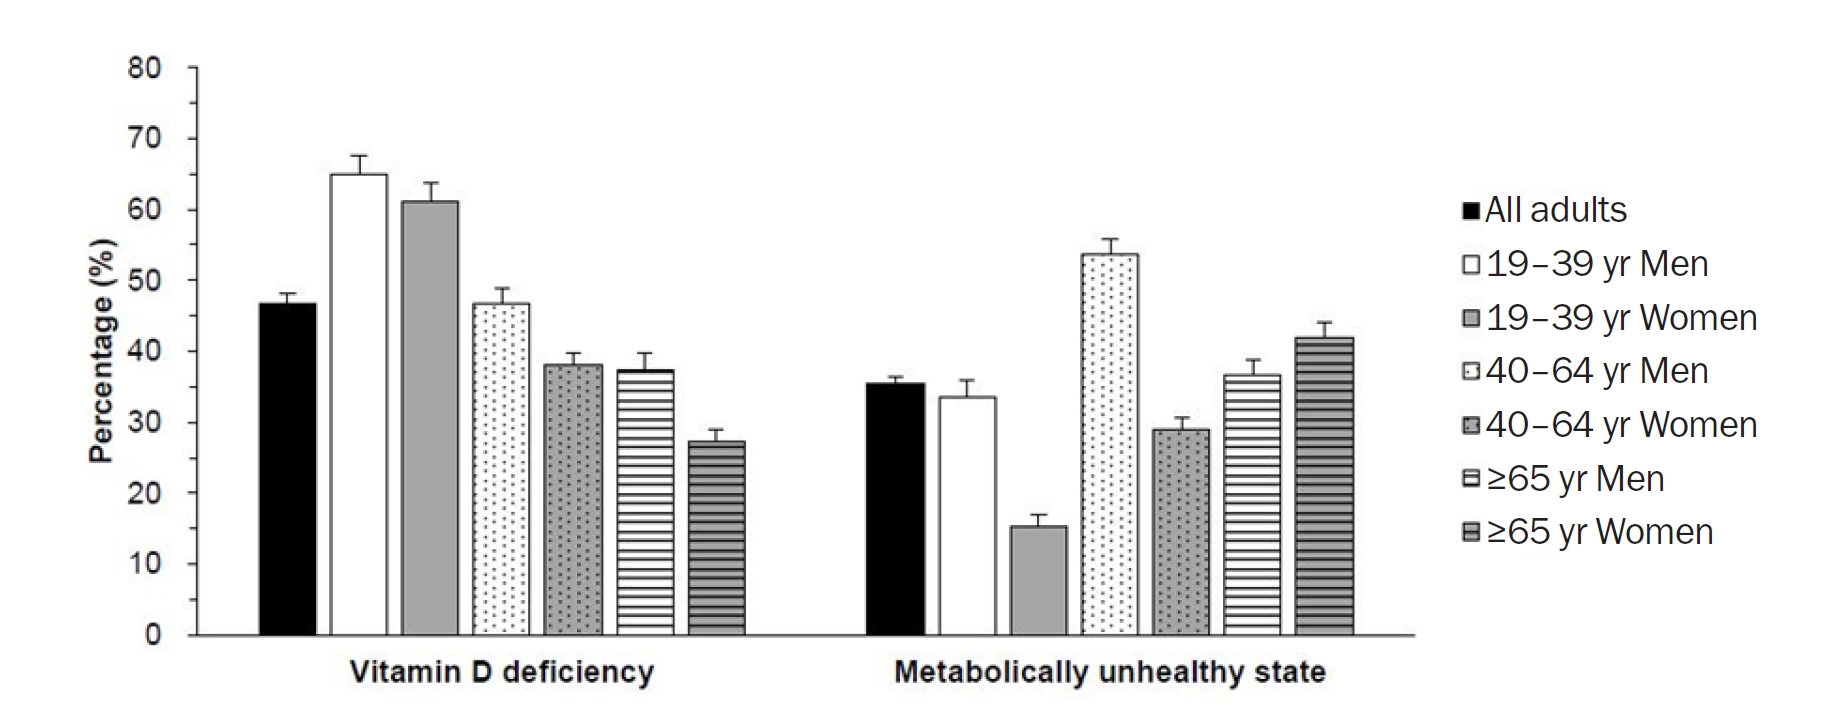
Table 1.Association between serum 25(OH)D3 level and TyG index of participants by age and sex
Table 1.
|
Serum 25(OH)D3 level |
Unadjusted |
Model 1a)
|
Model 2b)
|
|
β (SE) |
P-value |
β (SE) |
P-value |
β (SE) |
P-value |
|
Younger adult |
|
|
|
|
|
|
|
Men (n=529) |
0.002 (0.004) |
0.668 |
<0.001 (0.004) |
0.992 |
−0.001 (0.003) |
0.722 |
|
Women (n=650) |
−0.002 (0.002) |
0.316 |
−0.005 (0.002) |
0.029 |
−0.004 (0.002) |
0.039 |
|
Middle-aged adult |
|
|
|
|
|
|
|
Men (n=894) |
−0.009 (0.003) |
0.001 |
−0.008 (0.002) |
0.002 |
−0.006 (0.003) |
0.015 |
|
Women (n=1,245) |
−0.002 (0.002) |
0.249 |
−0.001 (0.002) |
0.561 |
−0.001 (0.002) |
0.661 |
|
Older adult |
|
|
|
|
|
|
|
Men (n=670) |
−0.007 (0.002) |
0.001 |
−0.007 (0.002) |
0.003 |
−0.008 (0.002) |
0.002 |
|
Women (n=831) |
−0.001 (0.001) |
0.477 |
−0.001 (0.002) |
0.612 |
<0.001 (0.002) |
0.793 |
Table 2.Association between vitamin D deficiency and metabolically unhealthy state by age and sex
Table 2.
|
Vitamin D status |
Unadjusted |
Model 1a)
|
Model 2b)
|
|
Younger adults |
|
|
|
|
Men |
|
|
|
|
Normal (n=195) |
1 (Reference) |
1 (Reference) |
1 (Reference) |
|
Vitamin D deficiency (n=334) |
1.01 (0.67–1.52) |
1.36 (0.87–2.14) |
1.43 (0.89–2.29) |
|
Women |
|
|
|
|
Normal (n=262) |
1 (Reference) |
1 (Reference) |
1 (Reference) |
|
Vitamin D deficiency (n=388) |
1.47 (0.90–2.40) |
1.58 (0.89–2.82) |
1.44 (0.80–2.57) |
|
Middle-aged adults |
|
|
|
|
Men |
|
|
|
|
Normal (n=499) |
1 (Reference) |
1 (Reference) |
1 (Reference) |
|
Vitamin D deficiency (n=395) |
1.71 (1.27–2.31) |
1.72 (1.23–2.40) |
1.59 (1.11–2.28) |
|
Women |
|
|
|
|
Normal (n=776) |
1 (Reference) |
1 (Reference) |
1 (Reference) |
|
Vitamin D deficiency (n=469) |
1.18 (0.91–1.52) |
1.21 (0.91–1.63) |
1.16 (0.87–1.56) |
|
Older adults |
|
|
|
|
Men |
|
|
|
|
Normal (n=444) |
1 (Reference) |
1 (Reference) |
1 (Reference) |
|
Vitamin D deficiency (n=226) |
1.84 (1.21–2.81) |
1.97 (1.22–3.17) |
2.15 (1.31–3.55) |
|
Women |
|
|
|
|
Normal (n=609) |
1 (Reference) |
1 (Reference) |
1 (Reference) |
|
Vitamin D deficiency (n=222) |
0.98 (0.66–1.44) |
0.91 (0.59–1.42) |
0.70 (0.43–1.12) |
REFERENCES
- 1. Du T, Yuan G, Zhang M, Zhou X, Sun X, Yu X. Clinical usefulness of lipid ratios, visceral adiposity indicators, and the triglycerides and glucose index as risk markers of insulin resistance. Cardiovasc Diabetol 2014;13:146.
- 2. Li Z, Liu S, Li X, et al. The association between the triglyceride-glucose index and vitamin D status: a systematic review and meta-analysis. BMC Endocr Disord 2024;24:222.
- 3. Couto AN, Pohl HH, Bauer ME, Schwanke CH. Accuracy of the triglyceride-glucose index as a surrogate marker for identifying metabolic syndrome in non-diabetic individuals. Nutrition 2023;109:111978.
- 4. Nabipoorashrafi SA, Seyedi SA, Rabizadeh S, et al. The accuracy of triglyceride-glucose (TyG) index for the screening of metabolic syndrome in adults: a systematic review and meta-analysis. Nutr Metab Cardiovasc Dis 2022;32:2677-88.
- 5. Lee SH, Han K, Yang HK, et al. A novel criterion for identifying metabolically obese but normal weight individuals using the product of triglycerides and glucose. Nutr Diabetes 2015;5:e149.
- 6. Palacios C, Gonzalez L. Is vitamin D deficiency a major global public health problem? J Steroid Biochem Mol Biol 2014;144 Pt A:138-45.
- 7. Shin S, Park CY. Association between body fat percentage and vitamin D deficiency among Korean adults: a cross-sectional study. Obes Res Clin Pract 2025;19:441-7.
- 8. Park CY, Shin S, Han SN. Multifaceted roles of vitamin D for diabetes: from immunomodulatory functions to metabolic regulations. Nutrients 2024;16:3185.
- 9. Shin S, Kim MJ. Associations between vitamin D deficiency and sarcopenia in South Korean adults: based on the 2022 Korea National Health and Nutrition Examination Survey. Nutrients 2025;17:3292.
- 10. Xiang Q, Xu H, Zhan J, et al. Association between the triglyceride-glucose index and vitamin D status in type 2 diabetes mellitus. Nutrients 2023;15:639.
- 11. Liu Z, Zhang W, Zhao Z, Li W, Zhang J. The triglyceride-glucose index is associated with vitamin D status in metabolic-associated fatty liver disease. Diabetes Metab Syndr Obes 2023;16:2651-60.
- 12. Alshahrani F, Aljohani N. Vitamin D: deficiency, sufficiency and toxicity. Nutrients 2013;5:3605-16.
- 13. Basinska-Lewandowska M, Lewinski A, Horzelski W, Skowronska-Jozwiak E. Effect of summer sunshine exposure on vitamin D status in young and middle age poles: Is 30 ng/mL vitamin D cut-off really suitable for the Polish population? Int J Environ Res Public Health 2021;18:8116.
- 14. Wu J, Atkins A, Downes M, Wei Z. Vitamin D in diabetes: uncovering the sunshine hormone’s role in glucose metabolism and beyond. Nutrients 2023;15:1997.
- 15. Korea Disease Control and Prevention Agency. The 2022 Korea National Health and Nutrition Examination Survey (KNHANES IX-1) raw data usage guide [Internet]. Korea Disease Control and Prevention Agency; 2023 [cited 2026 Apr 20]. Available from: https://knhanes.kdca.go.kr/
- 16. Rural Development Administration National Institute of Agricultural Sciences. Korean food composition database 9.3 [Internet]. National Institute of Crop Science; 2021 [cited 2026 Apr 20]. Available from: http://koreanfood.rda.go.kr/
- 17. Kweon S, Kim Y, Jang MJ, et al. Data resource profile: The Korea National Health and Nutrition Examination Survey (KNHANES). Int J Epidemiol 2014;43:69-77.
- 18. The Ministry of Health and Welfare; The Korean Nutrition Society. Dietary reference intakes for Koreans 2025 [Internet]. Ministry of Health and Welfare; 2025 [cited 2026 Apr 20]. Available from: https://kns.or.kr/fileroom/fileroom_view.asp?idx=167&BoardID=Kdr
- 19. Ginsberg HN, Zhang YL, Hernandez-Ono A. Regulation of plasma triglycerides in insulin resistance and diabetes. Arch Med Res 2005;36:232-40.
- 20. Luo Y, Liu L, Liu M, et al. Relationship between body composition and insulin resistance evaluated by the TyG index: a retrospective study among Chinese population. Clin Endocrinol (Oxf) 2025;102:264-72.
- 21. Drincic AT, Armas LA, Van Diest EE, Heaney RP. Volumetric dilution, rather than sequestration best explains the low vitamin D status of obesity. Obesity (Silver Spring) 2012;20:1444-8.
- 22. Zhang F, Li W. The mediating role of vitamin D in the relationship between triglyceride glucose index and mortality in patients with diabetes mellitus: a causal mediation analysis. Front Nutr 2024;11:1492647.
- 23. Kalaidji MS, Dennouni-Medjati N, Harek Y, et al. Association between vitamin D deficiency and insulin resistance assessed by the triglyceride-glucose index in type 2 diabetes mellitus adults in Northwest Algeria. Rom J Diabetes Nutr Metab Dis 2025;32:315-23.
- 24. Mahat RK, Rathor PK, Rathore V, Arora M, Panda S, Marndi G. The relationship between vitamin D and TyG index in prediabetes and type 2 diabetes mellitus among an Indian tribal community: a cross-sectional study. BioMed 2024;4:404-18.
- 25. Xiang Q, Xu H, Liu Y, Huang W. Elevated TyG index is associated with increased risk of vitamin D deficiency among elderly patients with type 2 diabetes. Sci Rep 2024;14:16098.
- 26. Amer OE, Sabico S, Alnaami AM, Wani K, Al-Daghri NM. Cardiometabolic implications of triglyceride-glucose index, remnant cholesterol, and vitamin D in normoglycemic Arab adolescents: a cross-sectional study. Front Endocrinol (Lausanne) 2026;16:1674706.
- 27. Jia Y, Song T, Li Z, Zhou L, Chen S. The relationship between triglyceride glucose index and vitamin D in type 2 diabetes mellitus. Diabetes Metab Syndr Obes 2022;15:511-25.
- 28. Kim YA, Cho YJ. The association between visceral fat, subcutaneous fat and serum 25-hydroxyvitamin D3 levels. Obes Med 2019;13:29-33.
- 29. Zhang M, Li P, Zhu Y, et al. Higher visceral fat area increases the risk of vitamin D insufficiency and deficiency in Chinese adults. Nutr Metab (Lond) 2015;12:50.
- 30. Baek JH, Kim H, Kim KY, Jung J. Insulin resistance and the risk of diabetes and dysglycemia in Korean general adult Population. Diabetes Metab J 2018;42:296-307.