ABSTRACT
-
Objective
Nutritional management is essential in caring for patients with chronic kidney disease (CKD), older adults at higher risk of malnutrition and comorbidities. However, data on actual dietary intake patterns in older adults with predialysis CKD, especially by diabetes mellitus (DM) status, remain limited.
-
Methods
This cross-sectional study included 106 patients aged ≥65 years with CKD stage G3a or higher, divided into DM (n=67) and non-DM (n=39) groups. Dietary intake was assessed using a single 24-hour recall. Nutrient and food-group intakes were compared with recommended levels.
-
Results
In both groups, energy intake was lower than recommended levels. More than half of the participants exceeded sodium limits, and approximately half consumed excess protein. Patients with DM had significantly higher protein intake and blood urea nitrogen (BUN) levels than those without DM. Most food groups, except protein foods, were consumed below recommended levels.
-
Conclusion
Dietary patterns in older adults with predialysis CKD showed low energy intake, high sodium intake, and relatively high protein intake. Those with DM had higher protein intake and BUN levels, suggesting dietary differences by diabetes status. These findings underscore the need for age-sensitive, individualized nutritional management strategies that consider kidney function and DM status.
-
Keywords: Diabetes mellitus; Dietary patterns; Energy intake; Malnutrition; Nutrients
INTRODUCTION
Chronic kidney disease (CKD) is a prevalent and increasing global health issue, affecting approximately one in ten adults worldwide [
1]. It is associated with substantial morbidity and mortality, including higher risks of death, cardiovascular events, and hospitalization [
2].
Nutrition plays a key role in CKD management and is an important component of nephroprotection, as it can affect disease progression, metabolic status, and clinical outcomes [
3]. In patients with predialysis CKD, dietary intake—especially energy and nutrient intake—is an important determinant of nutritional status and is associated with clinical outcomes [
3-
5]. Dietary assessment is therefore essential before nutritional intervention to identify nutritional problems, guide individualized counseling, and support ongoing intake monitoring [
3,
4].
Older adults are a rapidly growing CKD subgroup. Aging-related changes, including reduced appetite, altered taste, lower energy intake, and increased risk of protein-energy wasting (PEW) and sarcopenia, can negatively affect nutrition [
5,
6]. Older adults with CKD often have comorbidities, such as hypertension or diabetes mellitus (DM), which further complicate nutritional management and increase the risk of malnutrition and functional decline [
5,
7].
Among these comorbidities, DM is a leading cause of CKD worldwide and a major driver of disease progression and related complications [
1]. It is also the leading cause of kidney failure requiring dialysis or transplantation [
8,
9]. The co-occurrence of predialysis CKD and DM complicates dietary management, requiring a balance of glycemic control and kidney-specific nutrition recommendations while maintaining adequate energy and protein intake to prevent malnutrition [
9].
Despite its clinical importance, data on actual dietary intake patterns in older adults with predialysis CKD, particularly by DM status, remain limited [
4,
5]. Only a few observational studies have directly compared energy and nutrient intake between diabetic and nondiabetic patients with predialysis CKD, and evidence in older adults is limited [
10]. To address this gap, the study compared dietary intake patterns—including energy and nutrient intake—between older adults with predialysis CKD with and without DM and assessed intake adequacy against established nutrition recommendations. By identifying differences according to DM status, this study aims to inform individualized nutrition education and intervention strategies aimed at improving clinical outcomes among older adults with CKD.
METHODS
Ethics statement
This study protocol was approved by the Institutional Review Board of Yongin Severance Hospital (IRB No. 9-2021-0075), and all participants provided written informed consent. The trial was registered at the Clinical Research Information Service (No. KCT0006503).
Study design and participants
This observational cross-sectional study was conducted at the Department of Nephrology at Yongin Severance Hospital from May to October 2021. Participants were aged ≥65 years with CKD stage G3a or higher. Eligibility criteria included an estimated glomerular filtration rate <60 mL/min/1.73 m2, calculated using the Chronic Kidney Disease Epidemiology Collaboration equation, and no dialysis treatment. The final sample included 106 participants, comprising 67 with DM and 39 without DM.
Participant characteristics and nutritional status
General participant characteristics, including sex, age, educational level, drinking status, smoking status, ability to prepare meals, and dietary management, were assessed using a structured questionnaire. Information on treatment duration and comorbidities was obtained from electronic medical records. Nutritional status was assessed using the seven-point Subjective Global Assessment (SGA) [
11], which includes medical history (weight loss in the past 6 months, dietary intake changes, gastrointestinal symptoms lasting >2 weeks, functional capacity, and disease-related metabolic stress) and physical examination findings (muscle wasting, loss of subcutaneous fat, and edema) [
12]. Each component was scored on a seven-point scale, with detailed scoring criteria provided in
Table S1. Based on total SGA scores, participants were classified as well nourished (6–7), mildly to moderately malnourished (3–5), or severely malnourished (1–2).
Anthropometric measures included height, weight, systolic blood pressure, diastolic blood pressure, triceps skinfold thickness (TSF), and mid-arm circumference (MAC). Body mass index (BMI) was calculated as weight (kg) divided by height (m²). Mid-arm muscle circumference (MAMC) was calculated from TSF and MAC using the following equation [
13]:
MAMC (cm)=MAC (cm)−[TSF (cm)×0.314]
Blood samples were collected by a registered phlebotomist after at least 8 hours of overnight fasting. Biochemical parameters, including glucose, albumin, blood urea nitrogen (BUN), and creatinine, were analyzed in the hospital laboratory.
Dietary intake assessment
Dietary intake was assessed using a single 24-hour dietary recall of all foods and beverages consumed during the previous day. Trained researchers conducted face-to-face interviews. Participants reported foods, ingredients, and portion sizes, aided by food models and measuring tools to improve recall accuracy. Daily nutrient intake was analyzed using CAN-Pro 5.0 (Computer Aided Nutritional Analysis Program, The Korean Nutrition Society, 2015). Food-group intake was assessed using the food exchange list for DM and the Korean Dietary Reference Intakes [
14]. Dietary adequacy was evaluated according to the International Society of Renal Nutrition and Metabolism (ISRNM) recommendations [
15]. Recommended protein intake for nondialysis CKD patients was 0.6 to 0.8 g/kg/day. Recommended energy intake was estimated from each participant’s height and weight and compared with actual intake. Daily exchange units for food groups were also calculated (
Table S2).
Statistical analyses were performed using IBM SPSS ver. 26.0 (IBM Corp.). Continuous variables are presented as mean±standard deviation, and categorical variables are frequencies and percentages. Differences between the DM and non-DM groups were assessed using independent t-tests for continuous variables and chi-square tests for categorical variables. A two-tailed P-value of <0.05 was considered statistically significant.
RESULTS
Group comparisons of participant characteristics, measurements, and nutritional status
Table 1 presents the general characteristics and nutritional status of 106 participants by DM status. The mean age was 76.6±6.2 years, and 60 participants (56.6%) were male. Nearly half (49.1%) were classified as CKD stage 3b. Compared with the non-DM group, the DM group had a higher prevalence of hypertension (P=0.022) and a lower prevalence of dyslipidemia (P=0.023). Only 24.5% of participants reported following dietary management, with a higher proportion in the non-DM group than in the DM group (P=0.038). Based on the SGA, 12 participants (11.3%) were mildly to moderately malnourished, with no significant difference between groups.
Table 2 shows anthropometric and biochemical parameters by DM status. Anthropometric measurements did not differ significantly between groups. However, BUN (P=0.035) and phosphorus levels (P=0.036) were significantly higher in the DM group than in the non-DM group.
Comparison of dietary intake with recommended levels
Table 3 shows the mean dietary intake by DM status. Energy and protein intake per kilogram body weight were calculated using current or adjusted body weight when BMI adequacy was <95% or >115%. Although energy intake was similar between groups, the DM group had significantly higher protein intake (P=0.017), protein per kg of body weight (P=0.049), folate (P=0.006), and niacin (P=0.038) than the non-DM group.
Table 4 compares energy and nutrient intake with ISRNM recommendations (
Table S3). In both groups, mean energy intake was below the recommended range of 30–35 kcal/kg/day. Over half of the participants exceeded the recommended sodium intake of 1,840–2,300 mg/day. Protein intake above the recommended range (0.6–0.8 g/kg/day) was observed in 58.2% of the DM group and 48.7% of the non-DM group, with no significant difference between groups.
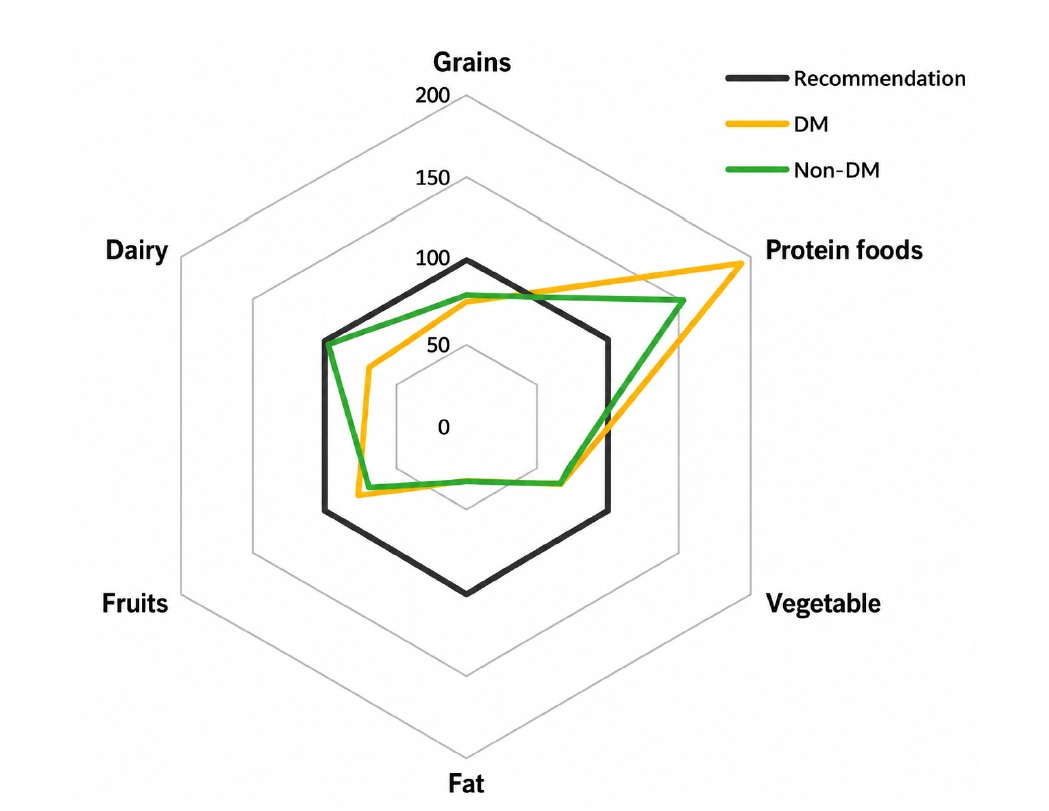
Fig. 1 shows a radial graph comparing food-group intake with recommended levels (set at 100%). In both groups, intake was below recommended levels for all food groups except protein foods, with no significant differences between the DM and non-DM groups.
DISCUSSION
This study examined dietary intake patterns in older adults with predialysis CKD and compared them based on DM status. Overall, participants had lower energy intake than recommended, more than half exceeded the recommended sodium intake, and approximately half consumed protein above the recommended range for predialysis CKD. Participants with DM had higher protein intake than those without DM. These findings indicate poor alignment with dietary patterns and support the need for individualized nutritional management strategies in this population.
A key finding was insufficient energy intake in many participants. Although ISRNM recommends 30–35 kcal/kg/day for patients with nondialysis CKD to prevent PEW [
15], the mean energy intake in both groups was below this range. These findings align with those of previous studies reporting that patients with CKD often consume less energy than recommended [
10,
16,
17]. Reduced energy intake in CKD has been attributed to anorexia, uremic symptoms, and dietary restrictions [
18,
19]. Inadequate energy intake may increase protein catabolism and the risk of PEW, which is associated with poor clinical outcomes [
15,
20]. This is especially relevant in older patients with CKD, as aging-related declines in appetite and function further limit dietary intake [
5,
6]. These findings highlight the importance of maintaining adequate energy intake in the nutritional management of older adults with CKD.
Despite the high prevalence of inadequate energy intake, few participants were classified as malnourished according to the SGA. This discrepancy may reflect that SGA evaluates changes in dietary intake rather than adequacy based on recommended energy requirements. In addition, the use of a single 24-hour recall may not fully reflect habitual intake. These factors may explain the observed mismatch between reported energy intake and nutritional status.
For patients with CKD, protein restriction to approximately 0.6–0.8 g/kg/day is commonly recommended to reduce intraglomerular pressure and mitigate hyperfiltration, thereby slowing disease progression [
15,
21]. However, adherence to a protein-restricted diet is often difficult in real-world home settings. Consistent with our findings, previous studies report that actual protein intake in patients with CKD frequently exceeds recommendations [
21,
22]. In this study, protein intake was similar to the recommended Korean Society of Nephrology (0.8 g/kg/day), and notably, approximately half of the participants met or exceeded this level. Given the older age of the cohort, these findings highlight a critical clinical dilemma: balancing the need for adequate protein intake to prevent sarcopenia against the risk of additional burden on compromised renal function. These results support that evidence-based, age-specific nutritional recommendations are warranted for the management of elderly patients with CKD.
Notably, patients with DM consumed significantly more protein than those without DM, consistent with previous studies [
17,
23]. In nondialysis CKD, patients without diabetes tended to initiate protein restriction earlier, whereas those with DM were less likely to do so [
17]. Although total energy intake did not significantly differ between groups, higher protein intake in the DM group may reflect differences in overall dietary intake patterns, including macronutrient distribution. In particular, carbohydrate restriction for glycemic control may lead to compensatory increases in protein intake [
24-
26].
Higher protein intake in the DM group was accompanied by higher BUN levels. As BUN reflects both dietary protein intake and kidney function, higher levels in this group may partly indicate greater protein consumption. This pattern may relate to DM-related dietary modifications, particularly carbohydrate restriction for glycemic control, which can lead to compensatory increases in protein intake. In addition, increased intake of protein-rich foods, especially from animal sources, may contribute to higher phosphorus intake and may partly explain the elevated serum phosphorus levels observed in the DM group. Previous studies similarly reported that higher protein intake increases circulating urea levels, indicating a relationship between protein intake and BUN levels [
27]. High protein intake has also been associated with increased intraglomerular pressure and glomerular hyperfiltration, potentially contributing to progressive kidney damage over time [
27]. These findings therefore highlight the importance of appropriate protein intake management in CKD [
3]. However, optimal protein intake in older adults with CKD remains unclear. While older adults generally require approximately 1.0 to 1.2 g/kg/day to maintain muscle mass and prevent sarcopenia [
28], this exceeds the lower levels recommended for CKD. Therefore, nutritional management in this population requires balancing kidney protection with the need to maintain adequate nutritional status.
Another key finding was that more than half of the participants exceeded the recommended sodium intake. Excessive sodium intake contributes to fluid retention and hypertension and is strongly associated with increased cardiovascular risk and CKD progression [
29]. Previous studies likewise report high sodium intake in CKD, while sodium restriction has been shown to reduce blood pressure and proteinuria [
29]. These findings highlight the importance of sodium restriction in CKD management.
Analysis of food-group intake showed that all groups except protein were consumed below recommended levels, suggesting that dietary imbalance in CKD may extend beyond individual nutrients to broader patterns of food selection. Previous studies have also reported food-group consumption imbalance among patients with CKD [
17,
30]. In older adults, food-based dietary guidance may be more practical and easier to implement than nutrient-based recommendations, and translating nutrient intake targets into meal-based patterns may improve dietary adherence. These findings support the use of food-based nutritional education in dietary interventions for patients with CKD.
This study has several strengths. First, it focused on older adults with CKD, a rapidly growing population for whom nutritional management is particularly important. Second, dietary intake was assessed in terms of nutrient amounts and adherence to recommended intakes and food-group patterns.
Several limitations should be acknowledged. First, the cross-sectional design precludes causal inferences between dietary intake patterns and clinical outcomes. Longitudinal studies are needed to determine whether observed dietary patterns contribute to disease progression or reflect adaptations to declining kidney function. Second, dietary intake was assessed using a single 24-hour dietary recall, which may not adequately capture habitual dietary patterns due to day-to-day variability. Although widely used, multiple recalls or food frequency questionnaires may provide a more reliable estimate of usual intake. Third, the relatively small sample and single-center design limit statistical power and generalizability to the broader populations of older adults with predialysis CKD. In addition, reliance on participant memory introduces recall bias, particularly in older adults with CKD, where cognitive decline may result in under- or inaccurate-reporting. These limitations may have led to misestimation of nutritional intake and attenuated associations with clinical parameters. Therefore, these findings should be interpreted with caution, and further studies using multiple recalls or food frequency questionnaires are warranted for a more robust estimation.
In conclusion, older adults with predialysis CKD had insufficient energy, excessive sodium, and protein intake above recommended levels. Protein intake and BUN levels were higher in patients with DM than in those without. These findings underscore the need for individualized nutritional management strategies that consider both kidney function and diabetes status in older adults with CKD.
NOTES
-
Authors’ contributions
Conceptualization: JEK, YJK, JEL, JJL, JWL, YKP. Formal analysis: JEK. Investigation: JEK, JK, YJK, JEL, JJL, JWL. Methodology: YJK, JEL, JJL, JWL. Supervision: YKP. Writing–original draft: JEK. Writing–review & editing: all authors. All authors read and approved the final manuscript.
-
Conflicts of interest
None.
-
Funding
This study was supported by a grant from the Korea Institute of Planning and Evaluation for Technology in Food, Agriculture and Forestry through the High Value-Added Food Technology Development Program funded by the Ministry of Agriculture, Food, and Rural Affairs (Grant no. 322010-5).
-
Data availability
Data of this research are available from the corresponding author upon reasonable request.
Supplementary materials
Fig. 1.Major food-group intake of participants compared with recommendation. DM, diabetes mellitus.
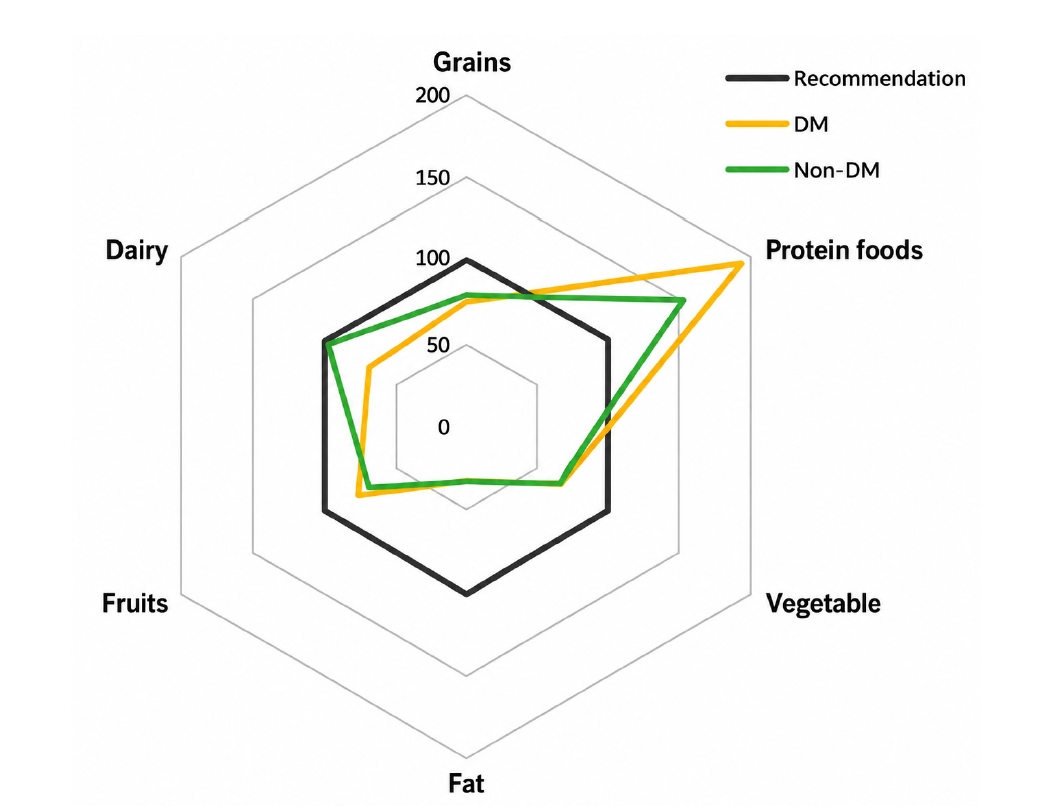
Table 1.General characteristics of participants according to DM comorbidity
Table 1.
|
Characteristic |
DM comorbidity |
|
Total (n=106) |
DM (n=67) |
Non-DM (n=39) |
P-value |
|
Age (yr) |
76.6±6.2 |
76.4±6.4 |
76.9±5.8 |
0.671 |
|
Male sex |
60 (56.6) |
42 (62.7) |
18 (46.2) |
0.098 |
|
Periods of medical treatment (mo) |
31.2±35.2 |
32.2±36.5 |
29.5±33.1 |
0.704 |
|
CKD stage |
|
|
|
|
|
Stage 3a |
22 (20.8) |
15 (22.4) |
7 (17.9) |
0.304 |
|
Stage 3b |
52 (49.1) |
29 (43.3) |
23 (59.0) |
|
Stage 4 |
29 (27.4) |
20 (29.9) |
9 (23.1) |
|
Stage 5 |
3 (2.8) |
3 (4.5) |
0 (0.0) |
|
Comorbidity |
|
|
|
|
|
Hypertension |
96 (90.6) |
64 (95.5) |
32 (82.1) |
0.022*
|
|
Anemia |
19 (17.9) |
11 (16.4) |
8 (20.5) |
0.596 |
|
Dyslipidemia |
12 (11.3) |
4 (6.0) |
8 (20.5) |
0.023*
|
|
Proteinuria |
63 (59.4) |
42 (62.7) |
21 (53.8) |
0.371 |
|
Hyperkalemia |
19 (17.9) |
12 (17.9) |
7 (17.9) |
0.996 |
|
Education |
|
|
|
|
|
Uneducated |
8 (7.5) |
3 (4.5) |
5 (12.8) |
0.245 |
|
Elementary school |
28 (26.4) |
15 (22.4) |
13 (33.3) |
|
Middle school |
14 (13.2) |
11 (16.4) |
3 (7.7) |
|
High school |
39 (36.8) |
27 (40.3) |
12 (30.8) |
|
College or higher |
17 (16.0) |
11 (16.4) |
6 (15.4) |
|
Smoking status |
|
|
|
|
|
Never |
85 (80.2) |
53 (79.1) |
32 (82.1) |
0.888 |
|
Current |
7 (6.6) |
5 (7.5) |
2 (5.1) |
|
Former |
14 (13.2) |
9 (13.4) |
5 (12.8) |
|
Current drinking status |
|
|
|
|
|
Yes |
16 (15.1) |
12 (17.9) |
4 (10.3) |
0.288 |
|
No |
90 (84.9) |
55 (82.1) |
35 (89.7) |
|
Diet management |
|
|
|
|
|
Yes |
26 (24.5) |
12 (17.9) |
14 (35.9) |
0.038*
|
|
No |
80 (75.5) |
55 (82.1) |
25 (64.1) |
|
Subjective Global Assessment |
|
|
|
|
|
Mildly to moderately malnourished |
12 (11.3) |
9 (13.4) |
3 (7.7) |
0.368 |
|
Well nourished |
94 (88.7) |
58 (86.6) |
36 (92.3) |
Table 2.Anthropometric and biochemical measurements of participants according to DM comorbidity
Table 2.
|
Parameter |
DM comorbidity |
|
Total (n=106) |
DM (n=67) |
Non-DM (n=39) |
P-value |
|
Anthropometric parameter |
|
|
|
|
|
Height (cm) |
157.7±12.0 |
158.9±8.9 |
157.9±7.2 |
0.548 |
|
Weight (kg) |
65.0±14.1 |
65.4±10.4 |
61.9±9.9 |
0.087 |
|
BMI (kg/m2) |
25.5±3.4 |
25.9±3.3 |
24.8±3.4 |
0.109 |
|
SBP (mmHg) |
134.1±18.3 |
135.6±18.3 |
131.5±18.3 |
0.262 |
|
DBP (mmHg) |
65.0±12.3 |
64.6±12.3 |
65.7±12.5 |
0.655 |
|
TSF (mm) |
16.0±6.0 |
15.7±5.7 |
16.6±6.5 |
0.432 |
|
MAMC (cm) |
22.1±3.0 |
22.3±3.1 |
21.8±2.8 |
0.385 |
|
Biochemical parameter |
|
|
|
|
|
Glucose (mg/dL) |
111.7±27.8 |
114.8±31.3 |
106.5±20.0 |
0.098 |
|
Hemoglobin (g/dL) |
11.8±1.8 |
11.9±2.0 |
11.8±1.6 |
0.913 |
|
Total protein (g/dL) |
6.9±0.5 |
6.9±0.5 |
6.8±0.5 |
0.632 |
|
Albumin (g/dL) |
4.3±0.3 |
4.3±0.3 |
4.3±0.3 |
0.505 |
|
eGFR (mL/min/1.73 m2) |
35.4±11.1 |
35.0±12.2 |
36.2±9.0 |
0.596 |
|
BUN (mg/dL) |
31.2±11.7 |
32.8±13.4 |
28.5±7.3 |
0.035*
|
|
Creatinine (mg/dL) |
1.8±0.7 |
1.9±0.8 |
1.6±0.4 |
0.035*
|
|
Cystatin C (mg/L) |
2.0±0.6 |
2.1±0.7 |
1.9±0.4 |
0.099 |
|
PCR (mg/g) |
579.3±796.5 |
689.7±873.8 |
394.3±614.1 |
0.052 |
|
Uric acid (mg/dL) |
6.6±1.6 |
6.8±1.7 |
6.3±1.5 |
0.131 |
|
Calcium (mg/dL) |
9.2±0.4 |
9.2±0.4 |
9.2±0.4 |
0.982 |
|
Phosphorus (mg/dL) |
3.7±0.6 |
3.8±0.6 |
3.5±0.6 |
0.036*
|
|
Sodium (mmol/L) |
140.7±2.2 |
140.6±2.5 |
140.8±1.7 |
0.553 |
|
Potassium (mmol/L) |
5.0±0.7 |
5.0±0.7 |
4.9±0.6 |
0.232 |
|
Chloride (mmol/L) |
106.5±3.0 |
106.5±3.3 |
106.5±2.3 |
0.983 |
|
Cholesterol (mg/dL) |
138.6±29.9 |
134.2±29.5 |
146.0±29.4 |
0.050 |
Table 3.Nutrient intake of participants according to DM comorbidity
Table 3.
|
Nutrient intake |
DM comorbidity |
|
Total (n=106) |
DM (n=67) |
Non-DM (n=39) |
P-value |
|
Energy (kcal) |
1,388.7±435.0 |
1,429.1±472.4 |
1,319.2±357.0 |
0.211 |
|
Energy (kcal/kg) |
24.5±7.0 |
24.9±7.4 |
23.9±6.3 |
0.462 |
|
Macronutrient |
|
|
|
|
|
Carbohydrate (g) |
208.2±65.4 |
209.8±69.3 |
205.5±58.8 |
0.742 |
|
Protein (g/kg) |
0.9±0.4 |
1.0±0.4 |
0.8±0.2 |
0.049*
|
|
Protein (g) |
52.3±21.0 |
55.6±23.5 |
46.7±14.2 |
0.017*
|
|
Animal (% total protein) |
40.4±20.5 |
40.5±21.5 |
40.3±18.9 |
0.958 |
|
Plant (% total protein) |
59.6±20.5 |
59.5±21.5 |
59.7±18.9 |
0.958 |
|
Fat (g) |
32.3±18.1 |
33.0±20.6 |
31.1±13.0 |
0.564 |
|
Animal (% total fat) |
45.6±26.6 |
44.1±26.2 |
48.1±27.4 |
0.460 |
|
Plant (% total fat) |
54.4±26.6 |
55.9±26.2 |
51.9±27.4 |
0.460 |
|
Saturated fat (g) |
10.9±14.7 |
9.8±10.1 |
12.8±20.4 |
0.304 |
|
Cholesterol (mg) |
209.2±191.4 |
235.8±209.1 |
163.5±147.9 |
0.060 |
|
Fiber (g) |
21.4±13.1 |
22.2±14.6 |
20.1±10.0 |
0.434 |
|
Carbohydrate:protein:fat (%) |
63:16:21 |
63:16:21 |
64:15:21 |
|
|
Mineral and vitamin |
|
|
|
|
|
Sodium (mg) |
2,659.7±1,407.5 |
2,707.1±1,529.8 |
2,578.3±1,182.8 |
0.652 |
|
Potassium (mg) |
2,052.3±993.5 |
2,193.9±1,090.4 |
1,809.1±752.5 |
0.054 |
|
Phosphorus (mg) |
804.0±318.1 |
843.6±339.0 |
736.1±269.3 |
0.093 |
|
Calcium (mg) |
420.4±235.5 |
433.8±232.4 |
397.6±242.1 |
0.448 |
|
Iron (mg) |
17.6±23.0 |
18.8±25.0 |
15.6±19.0 |
0.498 |
|
Vitamin A (µg RAE) |
254.1±222.0 |
274.4±243.7 |
219.3±176.4 |
0.219 |
|
Vitamin E (mg) |
11.6±8.0 |
12.2±8.3 |
10.6±7.4 |
0.326 |
|
Folate (µg) |
372.8±204.7 |
408.6±233.0 |
311.2±123.8 |
0.006*
|
|
Vitamin C (mg) |
62.3±65.5 |
71.3±74.9 |
47.0±41.6 |
0.065 |
|
Thiamin (mg) |
1.3±0.6 |
1.3±0.7 |
1.2±0.5 |
0.172 |
|
Riboflavin (mg) |
1.0±0.6 |
1.1±0.6 |
0.9±0.6 |
0.259 |
|
Niacin (mg) |
8.6±4.3 |
9.2±4.8 |
7.6±3.1 |
0.038*
|
Table 4.Energy and nutrient intake of patients with predialysis chronic kidney disease (stages 3–5) compared with the recommended level
a)
Table 4.
|
Variable |
DM comorbidity |
|
Total (n=106) |
DM (n=67) |
Non-DM (n=39) |
P-value |
|
Below |
On |
Above |
Below |
On |
Above |
Below |
On |
Above |
|
Energy |
90 (84.9) |
6 (5.7) |
10 (9.4) |
56 (83.6) |
3 (4.5) |
8 (11.9) |
34 (87.2) |
3 (7.7) |
2 (5.1) |
0.427 |
|
Protein |
16 (15.1) |
32 (30.2) |
58 (54.7) |
10 (14.9) |
18 (26.9) |
39 (58.2) |
6 (15.4) |
14 (35.9) |
19 (48.7) |
0.584 |
|
Phosphorus |
58 (54.7) |
23 (21.7) |
25 (23.6) |
34 (50.7) |
14 (20.9) |
19 (28.4) |
24 (61.5) |
9 (23.1) |
6 (15.4) |
0.311 |
|
Sodium |
30 (28.3) |
15 (14.2) |
61 (57.5) |
18 (26.9) |
11 (16.4) |
38 (56.7) |
12 (30.8) |
4 (10.3) |
23 (59.0) |
0.665 |
REFERENCES
- 1. GBD 2023 Chronic Kidney Disease Collaborators. Global, regional, and national burden of chronic kidney disease in adults, 1990–2023, and its attributable risk factors: a systematic analysis for the Global Burden of Disease Study 2023. Lancet 2025;406:2461-82.
- 2. Go AS, Chertow GM, Fan D, McCulloch CE, Hsu CY. Chronic kidney disease and the risks of death, cardiovascular events, and hospitalization. N Engl J Med 2004;351:1296-305.
- 3. Ikizler TA, Burrowes JD, Byham-Gray LD, et al. KDOQI clinical practice guideline for nutrition in CKD: 2020 update. Am J Kidney Dis 2020;76(3 Suppl 1):S1-107.
- 4. Rhee CM, Wang AY, Biruete A, et al. Nutritional and dietary management of chronic kidney disease under conservative and preservative kidney care without dialysis. J Ren Nutr 2023;33(6S):S56-66.
- 5. Ertuglu L, Ikizler TA. Nutrition management in geriatric patients with CKD. Kidney360 2024;5:310-9.
- 6. Martino FK, Zattarin A, Cinquini C, et al. Low-protein diet in elderly patients with chronic kidney disease stage 4 and 5 in conservative management: focus on sarcopenia development. Nutrients 2024;16:1498.
- 7. Tang Y, Jiang J, Zhao Y, Du D. Aging and chronic kidney disease: epidemiology, therapy, management and the role of immunity. Clin Kidney J 2024;17:sfae235.
- 8. de Boer IH, Khunti K, Sadusky T, et al. Diabetes management in chronic kidney disease: a consensus report by the American Diabetes Association (ADA) and Kidney Disease: Improving Global Outcomes (KDIGO). Diabetes Care 2022;45:3075-90.
- 9. Kidney Disease: Improving Global Outcomes (KDIGO) Diabetes Work Group. KDIGO 2022 clinical practice guideline for diabetes management in chronic kidney disease. Kidney Int 2022;102(5S):S1-127.
- 10. Oliveira MC, Viney A, Picard E, Barnel C, Fouque D, Koppe L. Dietary intake and nutritional status in diabetic and nondiabetic patients with chronic kidney disease stage 4-5 (nutridiab study). J Ren Nutr 2024;34:19-25.
- 11. Visser R, Dekker FW, Boeschoten EW, Stevens P, Krediet RT. Reliability of the 7-point subjective global assessment scale in assessing nutritional status of dialysis patients. Adv Perit Dial 1999;15:222-5.
- 12. Detsky AS, McLaughlin JR, Baker JP, et al. What is subjective global assessment of nutritional status? JPEN J Parenter Enteral Nutr 1987;11:8-13.
- 13. Wu LW, Lin YY, Kao TW, et al. Mid-arm muscle circumference as a significant predictor of all-cause mortality in male individuals. PLoS One 2017;12:e0171707.
- 14. Ministry of Health and Welfare; The Korean Nutrition Society. Dietary reference intakes for Koreans 2015. Ministry of Health and Welfare; 2015.
- 15. Ikizler TA, Cano NJ, Franch H, et al. Prevention and treatment of protein-energy wasting in chronic kidney disease patients: a consensus statement by the International Society of Renal Nutrition and Metabolism. Kidney Int 2013;84:1096-107.
- 16. Liu Y, Deng F, Zhou P, et al. Lower energy intake associated with higher risk of cardiovascular mortality in chronic kidney disease patients on a low-protein diets. Nutr J 2024;23:75.
- 17. Lee H, Kim H, Kim TY, et al. Dietary assessment of Korean non-dialysis chronic kidney disease patients with or without diabetes. J Korean Med Sci 2020;35:e181.
- 18. Carrero JJ. Mechanisms of altered regulation of food intake in chronic kidney disease. J Ren Nutr 2011;21:7-11.
- 19. Kang D, Youn S, Min JW, Ko EJ. Nutritional status evaluation and intervention in chronic kidney disease patients: practical approach. Nutrients 2025;17:3264.
- 20. Han Q, Zhang R, Wu J, et al. Cross-sectional relationship between dietary protein intake, energy intake and protein energy wasting in chronic kidney disease patients. Br J Nutr 2024;132:309-14.
- 21. Ko GJ, Obi Y, Tortorici AR, Kalantar-Zadeh K. Dietary protein intake and chronic kidney disease. Curr Opin Clin Nutr Metab Care 2017;20:77-85.
- 22. Moore LW, Byham-Gray LD, Scott Parrott J, et al. The mean dietary protein intake at different stages of chronic kidney disease is higher than current guidelines. Kidney Int 2013;83:724-32.
- 23. Malhotra R, Cavanaugh KL, Blot WJ, Ikizler TA, Lipworth L, Kabagambe EK. Higher protein intake is associated with increased risk for incident end-stage renal disease among blacks with diabetes in the Southern Community Cohort Study. Nutr Metab Cardiovasc Dis 2016;26:1079-87.
- 24. Feinman RD, Pogozelski WK, Astrup A, et al. Dietary carbohydrate restriction as the first approach in diabetes management: critical review and evidence base. Nutrition 2015;31:1-13.
- 25. Tay J, Luscombe-Marsh ND, Thompson CH, et al. Comparison of low- and high-carbohydrate diets for type 2 diabetes management: a randomized trial. Am J Clin Nutr 2015;102:780-90.
- 26. Gannon MC, Nuttall FQ, Saeed A, Jordan K, Hoover H. An increase in dietary protein improves the blood glucose response in persons with type 2 diabetes. Am J Clin Nutr 2003;78:734-41.
- 27. Ko GJ, Rhee CM, Kalantar-Zadeh K, Joshi S. The effects of high-protein diets on kidney health and longevity. J Am Soc Nephrol 2020;31:1667-79.
- 28. Bauer J, Biolo G, Cederholm T, et al. Evidence-based recommendations for optimal dietary protein intake in older people: a position paper from the PROT-AGE Study Group. J Am Med Dir Assoc 2013;14:542-59.
- 29. McMahon EJ, Bauer JD, Hawley CM, et al. A randomized trial of dietary sodium restriction in CKD. J Am Soc Nephrol 2013;24:2096-103.
- 30. Wilkinson TJ, Lightfoot CJ, Smith AC. Comparison of dietary patterns and daily food intake in patients with chronic kidney disease. J Ren Nutr 2025;35:90-102.


 , Jisoo Kim1