ABSTRACT
-
Objective
Cigarette smoking leads to oxidative stress and high cholesterolemia, which are key drivers of cardiovascular disease (CVD). Whey is known for its antioxidant and hypolipidemic properties. This study investigated whether whey protein concentrate (WPC) and hydrolysate of WPC (HWPC) can alleviate CVD risk in South Korean smokers by lowering oxidative stress and blood lipids.
-
Methods
A total of 25 male smokers were screened, of which 18 eligible participants (72.0%), randomly assigned to either the WPC (n=9) or the HWPC (n=9) group, completed the 8-week intervention. Before (week 0, baseline) and after the intervention, participants visited the laboratory for blood collection and anthropometric measurements (body weight, height, waist circumference, body fat mass, nutritional intake). Blood samples were analyzed for plasma lipid profiles, plasma fat-soluble antioxidants, and leukocyte oxidative DNA damage using the comet assay.
-
Results
There were no significant differences in anthropometric measurements, dietary food intake, plasma conjugated dienes, total radical-trapping antioxidant potential, and erythrocytes’ glutathione peroxidase and catalase activities in both WPC and HWPC groups. However, we observed a significant decrease in the tail moments of leukocytes, low-density lipoprotein cholesterol, atherogenic index, and high coenzyme Q10 levels in both groups. In the WPC group, total cholesterol decreased, while plasma retinol, α-tocopherol, lycopene, α-carotene, and β-carotene increased.
-
Conclusion
WPC or HWPC significantly decreases blood cholesterol levels and oxidative DNA damage and increases plasma fat-soluble antioxidant levels. Thus, WPC or HWPC might be used as oral supplementation to lower the risk for CVD in South Korean male smokers.
-
Keywords: Whey protein concentrate; Whey protein hydrolysate; Smokers; Antioxidants; Hypocholesterolemic effect
INTRODUCTION
Cigarette smoking is a risk factor for cardiovascular disease (CVD) [
1,
2]. Studies have reported an increase in serum total cholesterol (total-C), low-density lipoprotein cholesterol (LDL-C), and triglycerides (TGs) and a decrease in high-density lipoprotein cholesterol (HDL-C) in smokers [
3,
4], which are key drivers of CVD. Elevated LDL-C is the main contributor to the development of CVD [
5]. Oxidative stress is also a significant CVD risk factor [
6]. Smoking causes vascular injury and endothelial dysfunction by producing various oxidants [
7,
8]. Specifically, polycyclic aromatic hydrocarbons present in tobacco get metabolized in the body, producing reactive intermediates, which, in turn, form free-radical species and induce oxidative DNA damage. This oxidative stress results in cellular damage, such as double-strand DNA breaks [
8,
9], and increases the DNA damage response within atherosclerotic plaques [
10,
11]. Furthermore, previous studies have reported increased senescence in the leukocytes of smokers [
12].
Smokers generally show decreased serum retinol, vitamin C, carotenes, and tocopherols compared to nonsmokers [
7,
13]. Although numerous
in vitro studies have suggested that antioxidants lower oxidative DNA damage, the clinical effects of antioxidant supplementation in smokers remain inconclusive [
14]. Some studies have indicated that dietary intake of antioxidants extracted from fruits and vegetables decreases oxidative stress markers in smokers [
15,
16]. However, other studies have shown that supplementation with specific antioxidants, such as vitamin C, vitamin E, and β-carotene, has varying results, ranging from the amelioration of oxidative DNA damage in lymphocytes [
17] to partial or no significant effects [
14,
17-
20]. Furthermore, although oral supplementation with antioxidants (vitamins C and E) was effective in decreasing endothelial dysfunction, the overall response was notably limited [
18,
19]. For instance, vitamin C supplementation effectively lowered plasma lipid peroxidation, as indicated by F2-isoprostanes levels, only among individuals with a high body mass index (BMI) [
20].
Whey is a by-product of cheese manufacturing and contains proteins, lipids, vitamins, and minerals [
21]. Milk lipids include tocopherols, retinol, and carotenoids [
22-
24]. Whey protein concentrate (WPC) has a high nutrition value [
25]. Whey proteins include β-lactoglobulin and α-lactalbumin, bovine serum albumin, lactoferrin, and immunoglobulins [
21]. WPC has been shown to decrease serum cholesterol in animals [
26,
27] and increase HDL-C in healthy humans [
28]. Whey protein isolates decrease total-C and LDL-C in people with overweight and obesity [
29]. In addition, whey is known for its antioxidant capacity, especially in
in vitro assays [
30-
32] and animals [
30,
33]. Whey hydrolysates generated from whey β-lactoglobulin show free-radical–scavenging activity [
32]. Albumin is the main contributor to the antioxidant properties of whey [
34], while antioxidative vitamins in whey provide additional antioxidant properties [
35].
Although studies have reported the antioxidant and hypolipidemic effects of whey protein, clinical in vivo data supporting its ability to decrease oxidative DNA damage remain scarce. Furthermore, evidence regarding the hypocholesterolemic effects of whey in human intervention studies is still inconclusive, given the distinct cholesterol metabolism in humans compared to animal models. In addition, research has not yet investigated the effects of whey on the health of smokers who are constantly exposed to oxidative stress and may be at higher risk for CVD. In this study, we investigated whether WPC or hydrolysate of whey protein concentrate (HWPC) can improve the lipid profile, alleviate oxidative DNA damage in leukocytes, and increase the levels of fat-soluble antioxidants in smokers.
METHODS
Ethics statement
This study was approved by the Kyungnam University Ethics Committee (No. KUIRB2013-16) and conducted in accordance with the Declaration of Helsinki. The procedures were explained in detail to all participants before the study began, and signed informed consent was obtained from them.
Preparation of WPC and HWPC
WPC (18% protein) was extracted from fresh cheddar cheese using spiral wound membrane–type ultrafiltration using membrane filters with a 20 kDa molecular weight cutoff. The extracted WPC was subjected to enzymatic hydrolysis by adding Neutrase (pH 7.0, Novo Nordisk Biochem Inc.) for 3 hours at 40 °C. The filtered whey hydrolysate retentate was further condensed, spray-dried, and then blended with sugar, citric acid, and xanthan gum (
Table 1) [
36].
A total of 25 healthy adult male smokers were voluntarily recruited from the area of Changwon (Gyeongsangnam-do, South Korea) and screened for their eligibility to participate in this study. All volunteers were administered a questionnaire asking about their age, present status of diseases, body weight, height, smoking, drinking, physical exercise, and intake of vitamin supplements. Those who consumed vitamin supplements or provided incomplete answers were excluded. Therefore, 20 participants (80.0%) were enrolled in the study, and 10 (50.0%) each were randomly assigned to either the WPC or the HWPC group. Toward the end of the study, 1 participant (10.0%) from each group was excluded due to failure to adhere to dietary supplementation. Finally, 18 of the 20 participants (90.0%) completed the 8-week intervention.
Study procedure
The participants were instructed to consume 24 g of powdered WPC or HWPC (reconstituted in 200 mL of water) every day for 8 weeks and were monitored regularly throughout the study period. Before (baseline) and after (at the end of) the intervention, the participants visited the laboratory for blood collection and anthropometric measurements. For anthropometry, body weight and height were measured using a weighing machine, waist circumference using a ruler, and body fat mass using a body fat analyzer (HBF-302, Omron). In addition, the participants’ nutritional intake was assessed using the 24-hours dietary recall method and analyzed using a Computer-Aided Nutritional Analysis Program (CAN-Pro 4.0, Korea Nutrition Society).
Next, the participants were instructed to fast overnight, and blood samples were withdrawn the next day. For the comet assay, a portion of the whole blood was separated, and the remaining was collected in lithium-heparinic polystyrene tubes and centrifuged at 1,000 rpm for 10 minutes to obtain platelet-rich plasma. After taking aliquots, another round of centrifugation was performed at 3,000 rpm for 15 minutes, and the supernatant was aliquoted and stored at –80 °C until further use for lipid, vitamin, and total radical-trapping antioxidant potential (TRAP) analysis. Next, erythrocytes were collected and buffered with isosmotic phosphate buffer saline. After adding liquid nitrogen, the buffered erythrocytes were stored at –80 °C until further use for antioxidant enzyme activity analysis.
Plasma concentrations of lipids and conjugated dienes in LDL-C and TRAP
Plasma concentrations of total-C, HDL-C, and TG were determined using a photometric autoanalyzer (BTR 815, Biotron Scientific Instruments) and reagents obtained from InHwa Pharm. The plasma LDL-C concentration was calculated using the Friedewald equation [
37], and baseline LDL-C conjugated diene (CD) levels were determined using a slightly modified method developed by Athotupa et al. [
38]. Briefly, 100 μL of plasma was mixed with 700 μL of heparin citrate buffer (0.064 M trisodium citrate, 50,000 IU/L of heparin, pH 5.05) and incubated for 10 minutes. Next, centrifugation was performed at 2,500 rpm for 10 minutes, and the pellet was suspended in 100 μL of 0.1 M Na−phosphate buffer containing 0.9% NaCl (pH 7.4). From 100 μL of the suspension, lipids were extracted using chloroform-methanol in a 2:1 ratio, dried under nitrogen, and dissolved in cyclohexane. Absorbance was measured spectrophotometrically at 234 nm. Plasma TRAP was measured using the photometric method developed by Rice-Evans and Miller [
6]. Absorbance was measured spectrophotometrically at 734 nm. Values were expressed as trolox equivalent antioxidant capacity and defined as the millimolar concentration of the trolox antioxidant capacity of a calibration curve.
GPx was determined using the method developed by Beutler. Briefly, 10 μL of hemolyzed erythrocytes was incubated with 1 mL of 0.1 M Tris-HCI buffer (pH 8.0) containing 20 μL of 0.1 M glutathione, 100 μL of 10 U/mL of glutathione reductase, and 100 μL of 2 mM decreased nicotinamide adenine dinucleotide phosphate (NADPH). After 10-minute incubation at 37 °C, 10 μL of tert-butyl hydroperoxide was added, and absorbance was measured spectrophotometrically at 340 nm for 90 seconds. The NADPH concentration was monitored by the rate of change in absorbance at 340 nm per minute (A340 nm/min). Catalase activity was measured using the method developed by Aebi et al. [
39]. Briefly, 100 μL of hemolyzed erythrocytes was dissolved in 50 mL of 50 mM phosphate buffer (pH 7.0). Immediately after adding 1 mL of 30 nM H
2O
2 to the 2 mL mixture, the H
2O
2 concentration was monitored at 240 nm for 30 seconds at 20 °C.
Plasma retinol, α-carotene, β-carotene, lycopene, α-tocopherol, γ-tocopherol, and coenzyme Q10 concentrations were assessed using reverse-phase high-pressure liquid chromatography (RP-HPLC) using the method developed by Jakob and Elmadfa [
40]. Briefly, after precipitation of proteins with ethanol, plasma lipids were extracted with n-hexane. After evaporation, the dry residue was dissolved using 150 μL of methanol-dichlormethane (85:15, v/v). Next, 100 μL of the sample was used for analysis by injecting it into a Merck LiChrospher 100 RP18 guard column (10 μm, 250×4 mm) of a Dionex HPLC system (Summit HPLC) and running it at a flow rate of 1.0 mL/min. The absorption spectrum was detected at 325 nm for retinol, 295 nm for tocopherols, 450 nm for carotenoids and lycopene, and 270 nm for coenzyme Q10. The plasma concentration of each vitamin was determined based on the area under the curve using an external calibration curve. Fat-soluble vitamin concentrations in the plasma were corrected for the sum of plasma cholesterol (mmol/L) and TG (mmol/L) because of their interdependency in the blood, as suggested by Thurnham et al. [
41] and Horwitt et al. [
42].
To isolate leukocytes, 70 μL of fresh whole blood was mixed with 1 mL of phosphate-buffered saline at pH 7.4 using Histopaque 1077 (Sigma) according to the manufacturer’s instructions. A 10 μL aliquot of the cell suspension was mixed with 0.7% low-melting-point agarose, and 100 μL of the mixture was added to a slide previously coated with 0.5% normal-melting-point agarose. The slides were covered with a coverslip and solidified. Next, the coverslips were removed, and the slides were placed in lysis buffer (2.5 M NaCl, 100 mM EDTA, 10 mM Tris pH 10.0, and 1% sodium lauryl sarcosine; 1% Triton X-100; and 10% dimethyl sulfoxide) for 1 hour at 4 °C, protected from light. Subsequently, the slides were briefly washed in distilled water and placed in electrophoresis buffer (300 mM NaOH and 10 mM Na2EDTA, pH 13.0) for 40 minutes for DNA unwinding. Electrophoresis in the same buffer was performed at an electric current of 25 V/300±3 mA for 20 minutes at 4 °C. Next, the slides were rinsed three times with a neutralized buffer (0.4 M Tris, pH 7.5) for 5 minutes at 4 °C and dehydrated in absolute ethanol for 5 minutes. After drying at room temperature, the slides were stained with 50 μL of 20 μg/mL of ethidium bromide and covered with a coverslip. The tail intensity (equivalent to the percentage of DNA in the tail), tail length, and tail moment (tail length×tail intensity) in 50 cells each on two replicate slides were measured using a fluorescence microscope (Leica Wetzlar) equipped with a charge-coupled device camera (Nikon) and a Komet 4.0 comet image analysis system (Kinetic Imaging).
Statistical analysis
Statistical analysis was performed using IBM SPSS ver. 21.0 (IBM Corp.). All data were presented as the mean±standard error. Significance was determined using a paired t-test. P<0.05 was considered statistically significant.
RESULTS
Effects of WPC and HWPC dietary supplementation on anthropometry and blood lipid profiles
Results showed that compared to baseline, 8 weeks of oral intake of WPC or HWPC did not affect the participants’ body weight, percentage of body fat mass, BMI, waist circumference, and waist-hip ratio (
Table 2). However, plasma concentrations of total-C significantly decreased in the WPC group, while those of LDL-C significantly decreased in both WPC and HWPC groups, resulting in a decrease in the atherogenic index (AI) in both groups (
Fig. 1A–
1C). In contrast, the plasma TG concentration did not change in either group (
Fig. 1D). These findings showed that without any significant changes in anthropometry, WPC and HWPC are effective in lowering blood LDL-C and AI levels.
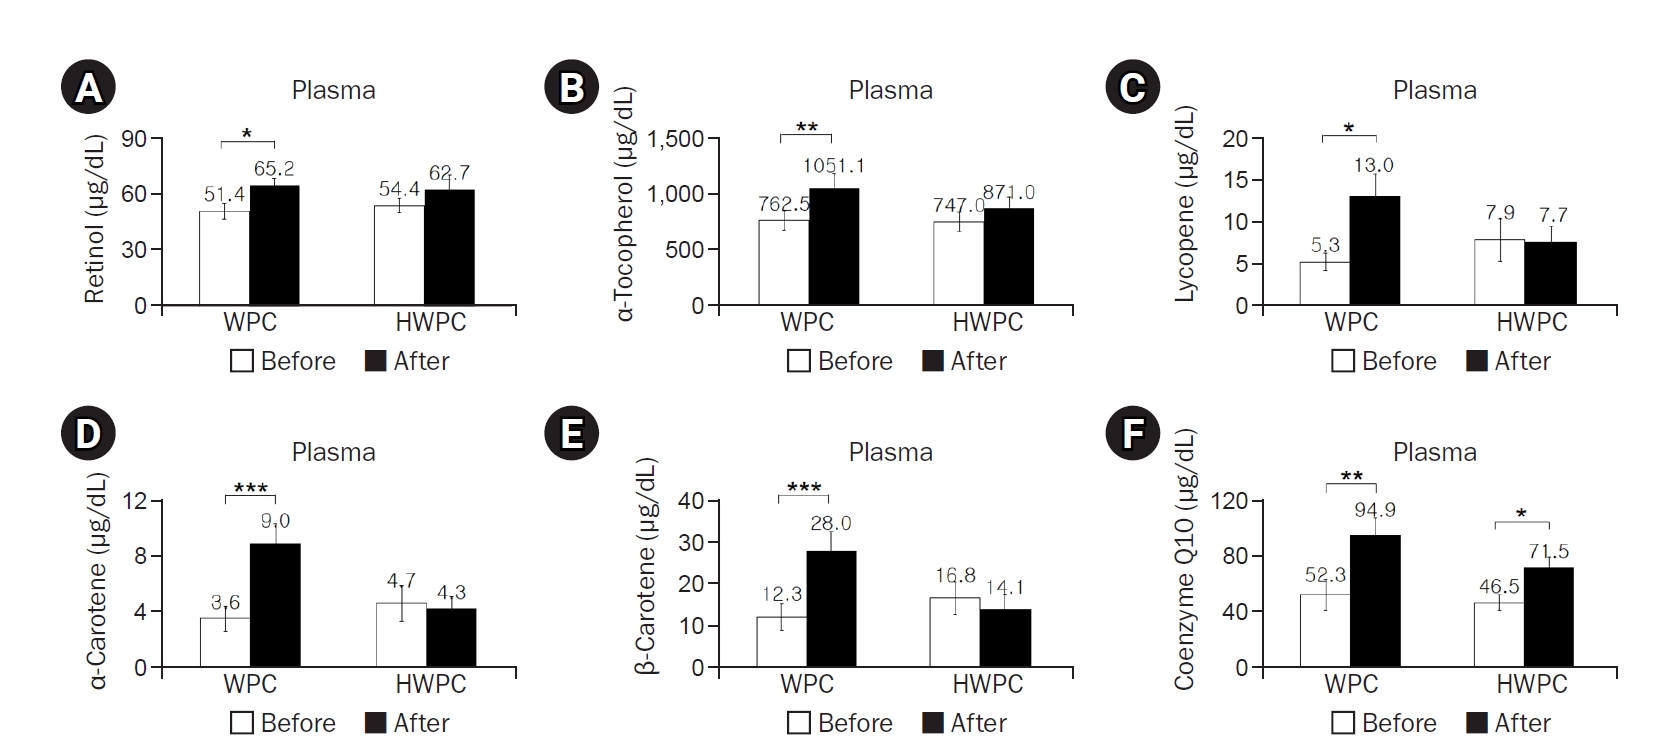
The dietary intake of most of the nutrients did not significantly change during the study, except dietary retinol intake in the HWPC group (
Table 3). However, plasma concentrations of retinol, α-tocopherol, lycopene, α-carotene, and β-carotene significantly increased postintervention in the WPC group, whereas plasma coenzyme Q10 levels increased in both WPC and HWPC groups (
Fig. 2); γ-tocopherol levels were not affected in either group (data not shown). Considering that blood lipids affect fat-soluble vitamin levels, lipid standardization using either total-C or total-C and TGs was suggested to correct vitamin levels in the blood [
43]. When corrected for total-C or for total-C and TGs, all tested fat-soluble antioxidant vitamins, even γ-tocopherol, remained significantly elevated in the WPC group but not in the HWPC group (data not shown). Overall, we observed that dietary supplementation with both WPC and HWPC commonly increases coenzyme Q10 levels, but WPC increases the plasma levels of additional fat-soluble antioxidants.
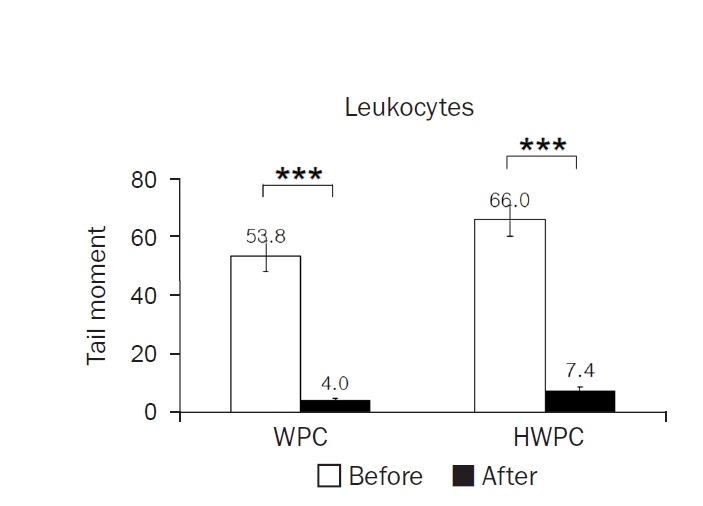
The mean tail moments of leukocytes significantly decreased in both WPC and HWPC groups (
Fig. 3). However, there was no significant difference in plasma CDs and TRAP, as well as catalase and GPx activities in erythrocytes (
Table 4). These findings show that dietary supplementation with WPC and HWPC is effective in lowering oxidative DNA damage in leukocytes but does not affect other plasma oxidative stress-related markers.
Next, we examined the correlation among plasma cholesterol levels, leukocyte tail moments, and plasma concentrations of fat-soluble antioxidants (
Table 5). The AI was positively correlated with total-C and LDL-C but negatively correlated with HDL-C. Leukocyte tail moments were positively correlated with total-C, LDL-C, and AI. Retinol, α-tocopherol, and coenzyme Q10 were positively correlated with HDL-C. Coenzyme Q10 was negatively correlated with leukocyte tail moments.
DISCUSSION
Principal findings
This is the first study to demonstrate that oral supplementation with WPC and HWPC is effective in lowering the AI and oxidative DNA damage, partly via modulating the plasma levels of fat-soluble antioxidants, especially coenzyme Q10, in smokers. In addition, we also noticed a WPC-specific effect in decreasing plasma total-C levels, along with increased plasma retinol, α-tocopherol, lycopene, α-carotene, and β-carotene levels.
Both WPC and HWPC lower LDL-C and AI in male smokers. This indicates that both WPC and HWPC may be protective against CVD development and hypocholesterolemia sustained after WPC hydrolysis. Earlier, whey hydrolysis was considered to increase the bioavailability and effectiveness of whey by removing its inactive part. However, whey hydrolysis does not appear to be more effective in improving blood cholesterol profiles, at least in South Korean male smokers with no apparent disorders. In addition, compared to HWPC, WPC is better at lowering plasma total-C levels, indicating that hydrolysis might negatively affect some functional components of whey, contributing to this effect. Our findings related to the effects of WPC on cholesterol metabolism are in line with those of previous studies demonstrating the hypocholesterolemic effects of whey protein isolates in participants with overweight or obesity [
29]. However, some studies have reported no significant effects of whey on cholesterol metabolism. This discrepancy might be due to the relative risk for CVD in the study populations. Male smokers and people with obesity have a higher risk for CVD compared to nonsmokers with a normal weight range and might be more responsive to the beneficial effects of whey. Overall, our data provide supporting evidence for the cholesterol-lowering effects of whey in humans.
The CVD risk in smokers is due to their constant exposure to cigarette smoke–induced oxidants, which, in part, cause endothelial dysfunction [
6,
7]. Therefore, lowering oxidative stress has been suggested as a way to prevent or lower CVD risk in smokers. However, reports on the beneficial effects of antioxidants in smokers are inconsistent [
14-
20]. To investigate the antioxidant effects of WPC and HWPC dietary supplementation on various aspects of the oxidative defense system in the body, we used the comet assay to detect oxidative DNA damage in leukocytes, along with measuring fat-soluble antioxidants as nonenzymatic antioxidant systems, CDs and TRAP as oxidative stress markers in plasma, and antioxidant enzyme activities in erythrocytes. Although WPC and HWPC did not significantly affect plasma CD and TRAP levels and erythrocytes’ catalase and GPx activities, both WPC and HWPC had strong beneficial effects on fat-soluble antioxidant levels and leukocyte tail moments, an indicator for oxidative DNA damage in leukocytes. The lack of changes in plasma CD and TRAP levels or antioxidant enzyme activities in erythrocytes might suggest that WPC or HWPC might not be sufficient to induce changes in these parameters in smokers constantly exposed to cigarette smoke. No apparent beneficial effects of vitamin E supplementation on lipid peroxidation have been reported in young and healthy smokers [
44,
45]. However, in this study, some participants might not have reached a threshold of severe depletion in the enzymatic antioxidant defense system prior to the study; therefore, the additional protective effects of WPC or HWPC dietary supplementation might have been less pronounced. This potential variability in the baseline antioxidant status among participants is a factor that was not fully controlled and could influence the magnitude of the observed benefits.
In this study, a significant decrease in oxidative DNA damage in leukocytes proved the antioxidative effects of WPC and HWPC dietary supplementation on male smokers. We used the comet assay to determine oxidative DNA damage using surrogate cells, such as leukocytes [
46]. In addition, correlation analysis indicated that tail moments and oxidative DNA damage markers are closely associated with plasma total-C, LDL-C, and AI levels. Therefore, the decrease in tail moments after supplementation with WPC and HWPC might be closely related to improving blood cholesterol levels in smokers. Similarly, oxidative DNA damage in leukocytes improved in smokers after supplementation with a mixture of antioxidant vitamins [
17]. Our data might indicate the beneficial health effects of WPC and HWPC dietary supplementation on CVD, as well as other oxidative DNA damage–related disorders, such as cancer. In addition, the comet assay to determine oxidative DNA damage in circulating blood cells might be a good way to monitor the antioxidative effects of supplementation with WPC or HWPC. Previously, the comet assay showed increased DNA damage in smokers [
47]. Only when smoking was ceased did the comet assay show decreased oxidative DNA damage [
46].
Our findings also indicate that supplementation with WPC or HWPC affects the levels of fat-soluble antioxidants, including retinol, α-tocopherol, γ-tocopherol, lycopene, α-carotene, β-carotene, and coenzyme Q10. Notably, coenzyme Q10 levels significantly increased in both groups, which might be linked to a concurrent decrease in plasma LDL-C levels, the AI, and leukocyte tail moments. Indeed, we observed a strong negative correlation between coenzyme Q10 and leukocyte tail moments, although there were no significant correlations with LDL-C and AI. Previous studies have shown that coenzyme Q10 supplementation protects against oxidative DNA damage in lymphocytes [
48,
49] and decreases lipid peroxidation in patients with coronary artery disease [
50]. However, no significant effects of coenzyme Q10 on oxidative DNA damage markers in smokers have been reported [
51].
The increases observed in fat-soluble antioxidants in this study could be attributed to either the inherent micronutrient content of WPC and HWPC or the enhanced preservation capacity of antioxidants in the plasma induced by these two supplements. Due to logistical limitations, we were unable to analyze the specific vitamin and coenzyme Q10 contents of WPC and HWPC samples. Consequently, it is unclear whether the increased plasma antioxidants levels were directly derived from supplementation with WPC and HWPC or resulted from secondary metabolic improvements. Further investigation is required to clarify the exact role of coenzyme Q10 in the antioxidative and hypocholesterolemic effects observed in smokers.
Conclusion
After 8 weeks of oral supplementation with WPC or HWPC, South Korean male smokers have decreased plasma LDL-C levels, resulting in a decrease in the AI and alleviation of leukocyte oxidative DNA damage, along with increased plasma coenzyme Q10 levels. In particular, WPC leads to a further reduction in plasma total-C levels, while simultaneously increasing the concentrations of fat-soluble antioxidants, such as retinol, α-tocopherol, lycopene, α-carotene, and β-carotene. These findings might support the hypocholesterolemic and antioxidative roles of WPC and HWPC in smokers, suggesting the use of WPC and HWPC as dietary supplements to aid in the prevention of CVD in these populations.
NOTES
-
Authors' contributions
Conceptualization: EP, JYP, SML. Data curation: EP. Formal analysis: EP. Investigation: EP. Methodology: EP. Project administration: EP, SML. Resources: JYP. Software: JYP. Supervision: EP. Validation: SML. Visualization: EP, SML. Writing - original draft: EP, JYP, SML. Writing - review & editing: EP, JYP, SML. All authors read and approved the final manuscript.
-
Conflicts of interest
Eunju Park is the current editor-in-chief of this journal but was not involved in the peer reviewer selection, evaluation, or decision process of this article. No other potential conflict of interest relevant to this article was reported.
-
Funding
This work was supported by the Technology Development Program for Food, Ministry for Food, Agriculture, Forestry, and Fisheries, Republic of Korea.
-
Data availability
Data of this research are available from the corresponding author upon reasonable request.
Fig. 1.Effects of 8-week dietary supplementation with WPC or HWPC on plasma concentrations of cholesterol, AI, and TG in South Korean male smokers. Plasma concentrations of total-C (A), LDL-C (B), HDL-C (C), AI (D), and TG (E) were compared between before (week 0, baseline) and after (8 weeks) oral supplementation with either WPC (n=9) or HWPC (n=9). Data are presented as the mean±standard error. Total-C, total cholesterol; WPC, whey protein concentrate; HWPC, hydrolysate of whey protein concentrate; LDL-C, low-density lipoprotein cholesterol; HDL-C, high-density lipoprotein cholesterol; AI, atherogenic index (total-C−HDL-C)/HDL-C; TG, triglyceride. Significant difference within groups between baseline and 8 weeks later in the paired t-test (*P<0.05, **P<0.01).
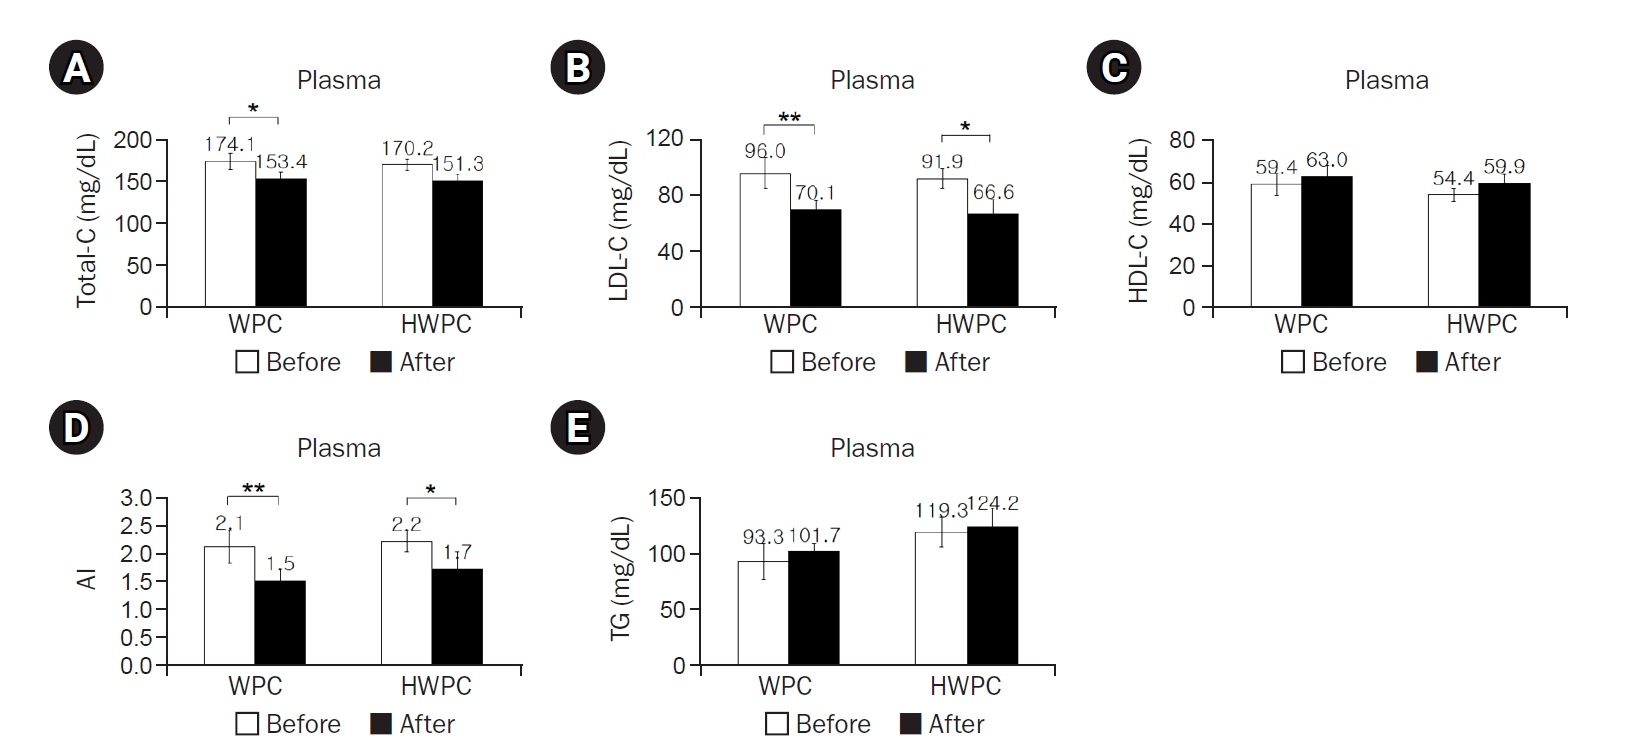
Fig. 2.Effects of 8-week dietary supplementation with WPC or HWPC on plasma concentrations of fat-soluble antioxidants in South Korean male smokers. Plasma concentrations of retinol (A), α-tocopherol (B), lycopene (C), α-carotene (D), β-carotene (E), and coenzyme Q10 (F) before (week 0, baseline) and after (8 weeks) oral supplementation with either WPC (n=9) or HWPC (n=9). Values are presented as mean±standard error. WPC, whey protein concentrate; HWPC, hydrolysate of whey protein concentrate. Significant difference within groups between baseline and 8 weeks later in the paired t-test (*P<0.05, **P<0.01, ***P<0.001).

Fig. 3.Effects of 8-week dietary supplementation with WPC or HWPC on the tail moments of leukocytes. The tail moments (tail length×tail intensity) of leukocytes were compared before (week 0, baseline) and after (8 weeks) oral supplementation with either WPC (n=9) or HWPC (n=9). Values are presented as mean±standard error. WPC, whey protein concentrate; HWPC, hydrolysate of whey protein concentrate. Significant difference within groups between baseline and 8 weeks later in the paired t-test (***P<0.001).

Table 1.Composition of whey protein extracts used in the study
Table 1.
|
Component |
WPC (%) |
HWPC (%) |
|
WPC |
20.8 |
0.0 |
|
HWPC |
0.0 |
20.8 |
|
Sugar |
77.5 |
77.5 |
|
Citric acid |
1.15 |
1.15 |
|
Pigment |
0.275 |
0.275 |
|
Flavor |
0.275 |
0.275 |
|
Total |
100 |
100 |
Table 2.Characteristics of study participants before and after 8-week WPC or HWPC dietary supplementation
Table 2.
|
Characteristic |
WPC (n=9) |
HWPC (n=9) |
P-valueb)
|
|
Before |
After |
P-valuea)
|
Before |
After |
P-valuea)
|
|
Age (yr) |
26.90±0.40 |
26.40±0.80 |
0.324 |
|
Weight (kg) |
73.56±3.90 |
70.40±3.13 |
0.447 |
78.38±4.55 |
78.78±4.75 |
0.410 |
0.433 |
|
Body fat (%) |
22.26±1.54 |
22.88±1.57 |
0.318 |
20.08±1.86 |
20.46±2.07 |
0.567 |
0.380 |
|
BMI (kg/m2) |
24.26±0.97 |
24.77±1.17 |
0.140 |
25.02±1.43 |
25.00±1.45 |
0.345 |
0.664 |
|
WHR |
0.83±0.02 |
0.84±0.02 |
0.563 |
0.86±0.02 |
0.84±0.02 |
0.190 |
0.404 |
|
GOT (U/L) |
22.30±1.90 |
28.11±2.96 |
0.061 |
27.67±2.49 |
40.44±9.70 |
0.200 |
0.106 |
|
GPT (U/L) |
26.60±2.30 |
25.78±2.63 |
0.742 |
31.28±4.70 |
28.17±2.32 |
0.508 |
0.384 |
|
Physical activity frequency |
|
|
|
Every day/wk |
2 (22.2) |
2 (22.2) |
0.924c)
|
|
3–4 times/wk |
3 (33.4) |
4 (44.5) |
|
1–2 times/wk |
2 (22.2) |
2 (22.2) |
|
No physical activity |
2 (22.2) |
1 (11.1) |
|
Alcohol |
|
|
|
|
Yes |
9 (100) |
7 (77.8) |
0.134c)
|
|
No |
0 |
2 (22.2) |
|
Alcohol intake (mL/day) |
66.0±23.7 |
56.6±24.5 |
0.546d)
|
Table 3.Comparison of energy and nutrient intake before and after 8-week WPC or HWPC dietary supplementation
Table 3.
|
Variable |
WPC (n=9) |
HWPC (n=9) |
P-valueb)
|
|
Before |
After |
P-valuea)
|
Before |
After |
P-valuea)
|
|
Energy (kcal) |
1,273.1±114.1 |
1,473.3±152.0 |
0.393 |
1,502.7±161.9 |
1,435.3±190.7 |
0.784 |
0.286 |
|
Carbohydrate (g) |
174.6±9.7 |
225.5±24.7 |
0.062 |
226.4±31.1 |
219.0±36.8 |
0.873 |
0.167 |
|
Protein (g) |
51.5±5.8 |
52.1±11.0 |
0.934 |
52.1±7.6 |
53.9±7.8 |
0.839 |
0.951 |
|
Lipid (g) |
38.7±10.1 |
42.2±5.8 |
0.795 |
34.6±16.5 |
33.4±4.1 |
0.824 |
0.734 |
|
Fiber (g) |
3.6±0.1 |
4.0±0.5 |
0.463 |
3.7±0.9 |
4.3±0.9 |
0.675 |
0.908 |
|
Calcium (mg) |
268.2±22.0 |
298.0±68.8 |
0.729 |
420.9±62.5 |
295.6±54.8 |
0.194 |
0.114 |
|
Phosphorus (mg) |
605.0±68.4 |
669.3±81.2 |
0.600c)
|
740.2±114.7 |
683.4±94.0 |
0.612c)
|
0.366d)
|
|
Iron (mg) |
8.7±0.5 |
8.3±1.0 |
0.753c)
|
9.3±1.9 |
8.2±1.2 |
0.398c)
|
0.731d)
|
|
Sodium (mg) |
3,490.4±616.3 |
3,645.4±708.2 |
0.722 |
3,647.4±677.1 |
2,946.8±517.0 |
0.416 |
0.869 |
|
Potassium (mg) |
1,716.1±158.0 |
1,814.4±294.1 |
0.781 |
1,807.2±345.4 |
1,609.8±320.9 |
0.654 |
0.825 |
|
Zinc (mg) |
6.2±0.4 |
6.5±0.7 |
0.600c)
|
11.0±5.5 |
6.5±1.0 |
0.398c)
|
0.945d)
|
|
Vitamin A (μg RE) |
443.2±89.3 |
542.7±139.9 |
0.437 |
336.8±96.7 |
496.2±162.3 |
0.409 |
0.442 |
|
Retinol (μg) |
36.8±19.6 |
86.1±31.5 |
0.336 |
113.6±21.9 |
57.6±12.0 |
0.031 |
0.026 |
|
β-Carotene (μg) |
2,420.7±540.5 |
2,588.6±729.9 |
0.779 |
1,296.1±474.2 |
2,458.3±993.9 |
0.350 |
0.144 |
|
Vitamin B1 (mg) |
1.10±0.20 |
1.02±0.10 |
0.926 |
1.00±0.21 |
0.92±0.13 |
0.529 |
0.823 |
|
Vitamin B2 (mg) |
0.76±0.17 |
0.83±0.16 |
0.755 |
0.97±0.18 |
0.69±0.08 |
0.133 |
0.420 |
|
Niacin (mg) |
13.5±1.7 |
10.7±0.8 |
0.179 |
10.2±2.3 |
11.5±2.1 |
0.656 |
0.286 |
|
Vitamin C (mg) |
68.3±14.2 |
39.5±7.5 |
0.140 |
53.9±11.2 |
54.1±18.1 |
0.993 |
0.437 |
|
Folic acid (μg) |
165.0±34.6 |
162.2±33.5 |
0.953 |
160.2±30.4 |
147.3±34.4 |
0.751 |
0.918 |
|
Vitamin E (mg) |
8.07±1.99 |
9.2±3.09 |
0.754 |
8.47±1.69 |
8.37±2.07 |
0.939 |
0.880 |
Table 4.Plasma CD and TRAP, erythrocyte catalase, and GPx activities of study participants before and after 8-week WPC or HWPC dietary supplementation
Table 4.
|
Variable |
WPC (n=9) |
HWPC (n=9) |
P-valueb)
|
|
Before |
After |
P-valuea)
|
Before |
After |
P-valuea)
|
|
Plasma |
|
|
|
|
|
|
|
|
CD (μM) |
2.15±0.47 |
1.70±0.48 |
0.398c)
|
2.74±0.51 |
2.37±0.62 |
0.161c)
|
0.189d)
|
|
TRAP (mM) |
1.45±0.16 |
1.47±0.13 |
0.406c)
|
1.47±0.26 |
1.52±0.10 |
0.106c)
|
0.222d)
|
|
Erythrocytic antioxidant enzymes |
|
|
|
|
|
|
|
|
CAT (K/g Hb) |
82.98±7.59 |
80.04±5.70 |
0.374c)
|
82.00±5.41 |
94.50±6.84 |
0.260c)
|
0.387d)
|
|
GPx (U/g Hb) |
27.79±4.85 |
29.39±3.56 |
0.802 |
22.88±4.83 |
27.24±3.66 |
0.304 |
0.484 |
Table 5.Correlation analysis of plasma cholesterol, AI, tail moment, and fat-soluble antioxidants
Table 5.
|
Variable |
Total-C |
HDL-C |
LDL-C |
AI |
Tail moment |
Retinol |
α-Tocopherol |
γ-Tocopherol |
Lycopene |
α-Carotene |
β-Carotene |
|
HDL-C |
–0.058a)
|
|
|
|
|
|
|
|
|
|
|
|
LDL-C |
0.879b)
|
–0.463b)
|
|
|
|
|
|
|
|
|
|
|
AI |
0.603b)
|
–0.797b)
|
0.837b)
|
|
|
|
|
|
|
|
|
|
Tail moment |
0.374c)
|
–0.157 |
0.390c)
|
0.364c)
|
|
|
|
|
|
|
|
|
Retinol |
–0.071 |
0.375c)
|
–0.284 |
–0.276 |
–0.162 |
|
|
|
|
|
|
|
α-Tocopherol |
0.244 |
0.398c)
|
0.021 |
–0.127 |
–0.188 |
0.695b)
|
|
|
|
|
|
|
γ-Tocopherol |
–0.019 |
0.212 |
–0.164 |
–0.128 |
–0.190 |
0.561b)
|
0.429b)
|
|
|
|
|
|
Lycopene |
–0.013 |
–0.060 |
–0.019 |
0.038 |
–0.071 |
0.271 |
0.117 |
0.399c)
|
|
|
|
|
α-Carotene |
0.228 |
0.113 |
0.166 |
0.040 |
–0.255 |
0.443b)
|
0.612b)
|
0.180 |
0.407c)
|
|
|
|
β-Carotene |
0.159 |
0.070 |
0.166 |
0.027 |
–0.201 |
0.436b)
|
0.559b)
|
0.283 |
0.225 |
0.793b)
|
|
|
Coenzyme Q10 |
0.158 |
0.379c)
|
–0.036 |
–0.222 |
–0.440b)
|
0.528b)
|
0.747b)
|
0.225 |
0.121 |
0.634b)
|
0.568b)
|
REFERENCES
- 1. Kannel WB. Update on the role of cigarette smoking in coronary artery disease. Am Heart J 1981;101:319-28.
- 2. Wilhelmsen L. Coronary heart disease: epidemiology of smoking and intervention studies of smoking. Am Heart J 1988;115:242-9.
- 3. Mjos OD. Lipid effects of smoking. Am Heart J 1988;115:272-5.
- 4. Freeman DJ, Griffin BA, Murray E, et al. Smoking and plasma lipoproteins in man: effects on low density lipoprotein cholesterol levels and high density lipoprotein subfraction distribution. Eur J Clin Invest 1993;23:630-40.
- 5. Rahilly-Tierney CR, Lawler EV, Scranton RE, Michael Gaziano J. Low-density lipoprotein reduction and magnitude of cardiovascular risk reduction. Prev Cardiol 2009;12:80-7.
- 6. Freund KM, Belanger AJ, D'Agostino RB, Kannel WB. The health risks of smoking: the Framingham Study: 34 years of follow-up. Ann Epidemiol 1993;3:417-24.
- 7. Burke A, Fitzgerald GA. Oxidative stress and smoking-induced vascular injury. Prog Cardiovasc Dis 2003;46:79-90.
- 8. Faust F, Kassie F, Knasmuller S, Boedecker RH, Mann M, Mersch-Sundermann V. The use of the alkaline comet assay with lymphocytes in human biomonitoring studies. Mutat Res 2004;566:209-29.
- 9. Mozaffarieh M, Konieczka K, Hauenstein D, Schoetzau A, Flammer J. Half a pack of cigarettes a day more than doubles DNA breaks in circulating leukocytes. Tob Induc Dis 2010;8:14.
- 10. Shah NR, Mahmoudi M. The role of DNA damage and repair in atherosclerosis: a review. J Mol Cell Cardiol 2015;86:147-57.
- 11. Martinet W, Knaapen MW, De Meyer GR, Herman AG, Kockx MM. Elevated levels of oxidative DNA damage and DNA repair enzymes in human atherosclerotic plaques. Circulation 2002;106:927-32.
- 12. Farhat N, Thorin-Trescases N, Voghel G, et al. Stress-induced senescence predominates in endothelial cells isolated from atherosclerotic chronic smokers. Can J Physiol Pharmacol 2008;86:761-9.
- 13. Al Senaidy AM, al Zahrany YA, al Faqeeh MB. Effects of smoking on serum levels of lipid peroxides and essential fat-soluble antioxidants. Nutr Health 1997;12:55-65.
- 14. Del Bo' C, Porrini M, Campolo J, et al. A single blueberry (Vaccinium corymbosum) portion does not affect markers of antioxidant defence and oxidative stress in healthy volunteers following cigarette smoking. Mutagenesis 2016;31:215-24.
- 15. Lee BM, Lee SK, Kim HS. Inhibition of oxidative DNA damage, 8-OHdG, and carbonyl contents in smokers treated with antioxidants (vitamin E, vitamin C, beta-carotene and red ginseng). Cancer Lett 1998;132:219-27.
- 16. Del Bo' C, Porrini M, Fracassetti D, Campolo J, Klimis-Zacas D, Riso P. A single serving of blueberry (V. corymbosum) modulates peripheral arterial dysfunction induced by acute cigarette smoking in young volunteers: a randomized-controlled trial. Food Funct 2014;5:3107-16.
- 17. Duthie SJ, Ma A, Ross MA, Collins AR. Antioxidant supplementation decreases oxidative DNA damage in human lymphocytes. Cancer Res 1996;56:1291-5.
- 18. Raitakari OT, Adams MR, McCredie RJ, Griffiths KA, Stocker R, Celermajer DS. Oral vitamin C and endothelial function in smokers: short-term improvement, but no sustained beneficial effect. J Am Coll Cardiol 2000;35:1616-21.
- 19. Neunteufl T, Priglinger U, Heher S, et al. Effects of vitamin E on chronic and acute endothelial dysfunction in smokers. J Am Coll Cardiol 2000;35:277-83.
- 20. Dietrich M, Block G, Hudes M, et al. Antioxidant supplementation decreases lipid peroxidation biomarker F(2)-isoprostanes in plasma of smokers. Cancer Epidemiol Biomarkers Prev 2002;11:7-13.
- 21. Walzem RL, Dillard CJ, German JB. Whey components: millennia of evolution create functionalities for mammalian nutrition: what we know and what we may be overlooking. Crit Rev Food Sci Nutr 2002;42:353-75.
- 22. Bergamo P, Fedele E, Iannibelli L, Marzillo G. Fat-soluble vitamin contents and fatty acid composition in organic and conventional Italian dairy products. Food Chem 2003;82:625-31.
- 23. Panfili G, Manzi P, Pizzoferrato L. High-performance liquid chromatographic method for the simultaneous determination of tocopherols, carotenes, and retinol and its geometric isomers in Italian cheeses. Analyst 1994;119:1161-5.
- 24. Jensen SK, Nielsen KN. Tocopherols, retinol, beta-carotene and fatty acids in fat globule membrane and fat globule core in cows’ milk. J Dairy Res 1996;63:565-74.
- 25. Mulvihill DM, Ennis MP. Functional milk proteins: production and utilization. In: Fox PF, McSweeney PL, editors. Advanced dairy chemistry: 1 proteins. Springer; 2003. p. 1175-228.
- 26. Nagaoka S, Kanamaru Y, Kuzuya Y, Kojima T, Kuwata T. Comparative studies on the serum cholesterol lowering action of whey protein and soybean protein in rats. Biosci Biotechnol Biochem 1992;56:1484-5.
- 27. Sautier C, Dieng K, Flament C, Doucet C, Suquet JP, Lemonnier D. Effects of whey protein, casein, soya-bean and sunflower proteins on the serum, tissue and faecal steroids in rats. Br J Nutr 1983;49:313-9.
- 28. Kawase M, Hashimoto H, Hosoda M, Morita H, Hosono A. Effect of administration of fermented milk containing whey protein concentrate to rats and healthy men on serum lipids and blood pressure. J Dairy Sci 2000;83:255-63.
- 29. Pal S, Ellis V, Dhaliwal S. Effects of whey protein isolate on body composition, lipids, insulin and glucose in overweight and obese individuals. Br J Nutr 2010;104:716-23.
- 30. Tong LM, Sasaki S, McClements DJ, Decker EA. Mechanisms of the antioxidant activity of a high molecular weight fraction of whey. J Agric Food Chem 2000;48:1473-8.
- 31. Chen J, Lindmark-Mansson H, Gorton L, Akesson B. Antioxidant capacity of bovine milk as assayed by spectrophotometric and amperometric methods. Int Dairy J 2003;13:927-35.
- 32. Hernandez-Ledesma B, Davalos A, Bartolome B, Amigo L. Preparation of antioxidant enzymatic hydrolysates from alpha-lactalbumin and beta-lactoglobulin. Identification of active peptides by HPLC-MS/MS. J Agric Food Chem 2005;53:588-93.
- 33. Gad AS, Khadrawy YA, El-Nekeety AA, Mohamed SR, Hassan NS, Abdel-Wahhab MA. Antioxidant activity and hepatoprotective effects of whey protein and Spirulina in rats. Nutrition 2011;27:582-9.
- 34. Zulueta A, Maurizi A, Frigola A, Esteve MJ, Coli R, Burini G. Antioxidant capacity of cow milk, whey and deproteinized milk. Int Dairy J 2009;19:380-5.
- 35. Lindmark-Mansson H, Akesson B. Antioxidative factors in milk. Br J Nutr 2000;84 Suppl 1:S103-10.
- 36. Kumar SK, Jayaprakasha HM, Paik HD, et al. Production of ready-to-reconstitute functional beverages by utilizing whey protein hydrolysates and probiotics. Korean J Food Sci Anim Resour 2010;30:575-81.
- 37. Friedewald WT, Levy RI, Fredrickson DS. Estimation of the concentration of low-density lipoprotein cholesterol in plasma, without use of the preparative ultracentrifuge. Clin Chem 1972;18:499-502.
- 38. Ahotupa M, Marniemi J, Lehtimaki T, et al. Baseline diene conjugation in LDL lipids as a direct measure of in vivo LDL oxidation. Clin Biochem 1998;31:257-61.
- 39. Aebi H, Wyss SR, Scherz B, Skvaril F. Heterogeneity of erythrocyte catalase II: isolation and characterization of normal and variant erythrocyte catalase and their subunits. Eur J Biochem 1974;48:137-45.
- 40. Jakob E, Elmadfa I. Rapid HPLC assay for the assessment of vitamin K1, A, E and beta-carotene status in children (7-19 years). Int J Vitam Nutr Res 1995;65:31-5.
- 41. Thurnham DI, Davies JA, Crump BJ, Situnayake RD, Davis M. The use of different lipids to express serum tocopherol: lipid ratios for the measurement of vitamin E status. Ann Clin Biochem 1986;23(Pt 5):514-20.
- 42. Horwitt MK, Harvey CC, Dahm CH, Searcy MT. Relationship between tocopherol and serum lipid levels for determination of nutritional adequacy. Ann N Y Acad Sci 1972;203:223-36.
- 43. Gross M, Yu X, Hannan P, Prouty C, Jacobs DR. Lipid standardization of serum fat-soluble antioxidant concentrations: the YALTA study. Am J Clin Nutr 2003;77:458-66.
- 44. Meagher EA, Barry OP, Lawson JA, Rokach J, FitzGerald GA. Effects of vitamin E on lipid peroxidation in healthy persons. JAMA 2001;285:1178-82.
- 45. Jialal I, Devaraj S. Antioxidants and atherosclerosis: don’t throw out the baby with the bath water. Circulation 2003;107:926-8.
- 46. Frenzilli G, Betti C, Davini T, et al. Evaluation of DNA damage in leukocytes of ex-smokers by single cell gel electrophoresis. Mutat Res 1997;375:117-23.
- 47. Rajmohan M, Naidu RM, Thamaraiselvi D, Deepasree M. In vivo autofluorescence spectroscopic study and evaluation of DNA damage by comet assay in smokers. J Clin Diagn Res 2015;9:ZC16-9.
- 48. Tomasetti M, Littarru GP, Stocker R, Alleva R. Coenzyme Q10 enrichment decreases oxidative DNA damage in human lymphocytes. Free Radic Biol Med 1999;27:1027-32.
- 49. Tomasetti M, Alleva R, Borghi B, Collins AR. In vivo supplementation with coenzyme Q10 enhances the recovery of human lymphocytes from oxidative DNA damage. FASEB J 2001;15:1425-7.
- 50. Lee BJ, Huang YC, Chen SJ, Lin PT. Coenzyme Q10 supplementation reduces oxidative stress and increases antioxidant enzyme activity in patients with coronary artery disease. Nutrition 2012;28:250-5.
- 51. Prieme H, Loft S, Nyyssonen K, Salonen JT, Poulsen HE. No effect of supplementation with vitamin E, ascorbic acid, or coenzyme Q10 on oxidative DNA damage estimated by 8-oxo-7,8-dihydro-2'-deoxyguanosine excretion in smokers. Am J Clin Nutr 1997;65:503-7.