ABSTRACT
Recent studies have evaluated the association between specific beverage intake and metabolic risks in adults. However, more evidence is needed to examine the association between the Healthy Beverage Index (HBI) and metabolic factors. Therefore, this study investigated the relationship between HBI and metabolic factors in adults. In this cross-sectional study, 338 overweight and obese individuals living in Tabriz, Iran were selected. Data on beverage consumption, demographics, physical activity, and anthropometric characteristics were evaluated using validated standard protocols. The predefined HBI was calculated based on previous studies. The mean value of HBI index among all of the participants was 59.76 ± 6.51. Those at the higher HBI scores had significantly lower waist circumference, waist-to-hip ratio, fat mass, and weight (p < 0.05). HBI and triglyceride scores also had a significant relationship. It has been shown that at higher HBI scores compared to lower scores, high-density lipoprotein cholesterol levels increase while homeostatic model assessment for insulin resistance, low-density lipoprotein cholesterol, total cholesterol, and blood pressure decrease. HBI scores higher among Iranian adults were associated with a better chance of losing weight and weight loss and a better lipid profile, and lower blood pressure. Therefore, HBI can be a useful and helpful tool for assessing the overall quality of beverages adults consume. However, further studies are warranted to confirm the possible health effects of healthy beverage index.
-
Keywords: Healthy Beverage Index; Cardio-metabolic; Overweight; Obesity
INTRODUCTION
More than a third of adults worldwide are overweight (body mass index [BMI] of 25 to 29.9) and obese (BMI over 30) [
1,
2]. Obesity and overweight are among the most important risk factors for mortality worldwide, causing various diseases such as type 2 diabetes, hypertension, cancer, and cardiovascular disease [
3,
4]. The prevalence of overweight in Iran is 42% in men and 57% in women, while 11.1% of men and 25.2% of women are obese [
5].
The factors that predispose individuals to obesity include age, low physical activity, low level of education and awareness, living in urban areas, and following inappropriate eating diets such as high-calorie foods and drinks, including sugar-sweetened beverages (SSBs) [
6]. A previous study showed that heredity and environmental factors could affect both the type and amount of beverage intake [
7]. Water intake has important health benefits for the body [
8]. Increasing water intake can be an important strategy for treating and preventing obesity [
9,
10]. Other beverages such as milk, tea, coffee, and other unsweetened beverages are also important for the health of the body [
11,
12]. Appropriate fluid consumption helps properly function the urogenital and gastrointestinal tracts [
13,
14] and thus reduces mortality [
14,
15]. SSBs cause weight gain and obesity, while decreased SSB intake reduces the risk of obesity and cardiovascular disease [
16,
17].
More attention is paid to receiving water than SSBs, recently [
7,
10]. Many studies have been conducted on the intake of SSBs and their association with obesity [
18,
19]. However, limited studies have examined the overall quality of daily beverages in a broader context [
20,
21]. Thus, a Healthy Beverage Index (HBI), like the Healthy Eating Index (HEI) [
22], can be used to assess the overall quality of beverages received, as well as to determine whether improving the pattern of beverages consumed is associated with improved body health. Therefore, dietitians and therapists can use HBI as a counseling tool to promote healthy beverage choices.
One of the objectives of our study is to establish a scoring system to provide an indicator of the overall quality of beverages consumed, including determining the total index of liquids consumed, with the help of quantitative recommendations of beverages and liquids received [
6,
26,
27]. Another purpose of HBI is examining the relationship between HBI score, and metabolic outcomes in adults. Commonly consumed beverages in Iran are sweetened with sucrose, while in Western countries, beverages are sweetened with corn syrup high in fructose [
28]. Therefore, the findings of Western studies cannot be generalized to other countries. Lastly, due to geographical diversity, our other goal was to assess the relationship between HBI and metabolic criteria in metabolically healthy overweight and obese adults in Tabriz, Iran.
MATERIALS AND METHODS
Participants
This cross-sectional study included 338 (total sample) overweight and obese people living in Tabriz, Iran. Participants in this study were selected by a combination of 2 projects [
29,
30] among overweight and obese individuals. Participants were collected through a call. Inclusion criteria were: age 20–70 years and BMI ≥ 25 kg/m
2. Exclusion criteria also included: pregnancy, lactation, menopause, bariatric surgery, cardiovascular disease, kidney disease, liver cancer, diabetes mellitus, and weight-bearing medications. Written consent approved by all participants was completed. Also, the study proposal was approved by the ethics committee of Tabriz University of Medical Sciences, Tabriz, Iran.
Sociodemographic information such as gender, age, smoking rate, level of education, marital status, occupation, and medical records was collected through a questionnaire. The socioeconomic status score was then obtained. Body composition measurements were also calculated by bioelectrical impedance analysis (BC-418 MA; Tanita, Tokyo, Japan).
The study samples were weighed with minimum clothing and without shoes using a Seca scale (Seca 755, seca GmbH, Hamburg, Germany) with an accuracy of 0.5 kg, which was controlled with a standard weight after every 10 times weighing the participants. Heights were measured with a plastic meter attached to the wall so that the participants stood on their feet without shoes while their knees, hips, shoulders, and back were along the plastic meter. The participants’ heights were measured with an accuracy of 0.5 cm. The amount of physical activity was calculated using a short 7-item International Physical Activity Questionnaire [
31]. The abbreviated version of this questionnaire includes seven simple questions (the validity and reliability of which have already been measured). Waist circumference with light clothing and in the distance between the smallest area under the ribs and above the iliac spine and hip circumference in the largest hip circumference was measured with the help of an inelastic tape meter without any pressure per meter with an accuracy of 0.1 cm. Waist-to-hip ratio (WHR) and BMI were also measured. Blood pressure was also measured using a standard mercury sphygmomanometer twice in one arm after at least 15 minutes of rest, then the average of two measurements was analyzed. Metabolic syndrome (MetS) was defined according to National Cholesterol Education Program Adult Treatment Panel III criteria [
32].
The 147-item food frequency questionnaire (FFQ) was used to measure food consumption; its validity and reliability were established in a previous study by Esfahani et al. [
33]. Participants were asked to detail the types and quantities of all the foods they consumed over a year. Dietary intake information was recorded for each food items in a daily, weekly, and monthly manner. To determine the proportion of sugary drinks consumed in Iran among the total consumption of non-alcoholic beverages and industrial fruit juices, we divided weekly intake by 7 or monthly intake by 30 and then converted the result back to daily consumption [
34].
Duffey and Davy’s [
35] approach was used to calculate the HBI. Consumed beverages were grouped into 8 categories, including water, unsweetened coffee or tea, low-fat milk (less than 1.5% fat, fat-free, and/or soy milk), diet drinks (including non-caloric sweetened coffee or tea and other artificially sweetened beverages), 100% natural fruit juice, alcohol (including beer, wine, and liquor), full-fat milk (1.5% fat), and sugar-sweetened beverages (including fruit drinks, sweetened coffee, tea, and soda) [
35]. The final HBI score ranges between 0 and 100, with a higher value demonstrating better adherence to beverage guidelines and a healthier beverage intake pattern [
35]. However, as in the current study, diet drinks (ranging from 0 to 5) and alcohol (ranging from 0 to 5) were not consumed by our target population, and the maximum final HBI score was 90. As the present study aimed to investigate adherence to healthy beverage intake guidelines and not total fluid consumption, liquids consumed as part of food (such as soup) were not included.
Initially, after 10–12 hours of fasting, the laboratory technician took 10 mL of venous blood from all samples. Blood samples were then centrifuged for 10 minutes to separate serum and plasma. Lipid profiles, including triglycerides (TGs), total cholesterol (TC), high-density lipoprotein cholesterol (HDL-C), and insulin, were measured by special spectrophotometric and enzyme-linked immunosorbent assay kits. In addition, low-density lipoprotein cholesterol (LDL-C) levels were estimated by the Friedwald equation [
36]. The homeostatic model assessment for insulin resistance (HOMA-IR) was evaluated using the following formula: fasting insulin (μIU/ml), fasting glucose (mmol/L)/22.5 and the quantitative insulin-sensitivity check index as:
1Log\xe2\x81\xa1Insulin Fasting (µU/mL)+Glucose Log (mmol/L)
The statistical analysis of the data was performed using the statistical package for social sciences (SPSS) (version 21.0; IBM Corp., Armonk, NY, USA). The p values less than 0.05 were considered significant. The mean, standard deviation (SD) was used for reporting quantitative data. For qualitative data, the number and percentage (%) were used. Differences in discrete and continuous variables at different levels of HBI categories were compared using χ2 and one-way analysis of variance tests, respectively. Analysis of covariance was used to compare biochemical variables after adjusting for confounding factors (age, sex, BMI, and physical activity).
Ethics statement
The ethics committee of the Tabriz University of Medical Sciences has approved this study protocol (code: IR.TBZMED.REC.1401.087 and grant number: 68837). Written informed consent was obtained from all participants before participating in the study. All methods in the current research were performed under the Declaration of Helsinki’s guidelines and regulations.
RESULTS
Participants’ general characteristics across HBI are shown in
Table 1. There was a significant association between Kcal /day and HBI intake (p < 0.001). The results for other variables were not significant.
Table 1 also shows that at waist circumference (WC), WHR, fat mass (FM), and weight values decreased with HBI scores.
Table 1 Study characteristics of the adult population.
Table 1
|
Characteristics |
Tertiles of HBI |
p value*
|
p value†
|
|
1st (n = 112) |
2nd (n = 113) |
3rd (n = 113) |
Total (n = 338) |
|
Sex |
|
|
|
|
0.93 |
0.96 |
|
Male |
77 (67.0%) |
60 (52.2%) |
65 (55.6%) |
202 (58.2%) |
|
Female |
38 (33.0%) |
55 (47.8%) |
52 (44.4%) |
145 (41.8%) |
|
Education |
|
|
|
|
0.64 |
0.65 |
|
Illiterate |
1 (1.1%) |
0 (0.0%) |
1 (1.5%) |
2 (2.6%) |
|
< 12 years |
35 (58.3%) |
35 (58.3%) |
40 (58.8%) |
110 (58.5%) |
|
≥ 12 years |
24 (40.0%) |
25 (41.6%) |
27 (39.7%) |
76 (40.4%) |
|
Occupation |
|
|
|
|
0.75 |
0.93 |
|
No occupation |
29 (48.4%) |
35 (22.3%) |
35 (51.5%) |
99 (58.2%) |
|
Occupied |
31 (51.7%) |
25 (41.6%) |
35 (48.5%) |
91 (47.2%) |
|
BMI (kg/m2) |
32.51 ± 4.71 |
33.05 ± 5.24 |
32.30 ± 4.45 |
32.62 ± 4.80 |
0.23 |
0.47 |
|
WC (cm) |
107.53 ± 8.99 |
106.66 ± 10.26 |
106.17 ± 9.59 |
106.78 ± 9.62 |
0.27 |
0.55 |
|
WHR |
0.94 ± 0.05 |
0.92 ± 0.08 |
0.93 ± 0.08 |
0.93 ± 0.07 |
0.14 |
0.15 |
|
FM (%) |
32.43 ± 7.89 |
36.89 ± 11.21 |
32.30 ± 7.39 |
33.81 ± 9.13 |
< 0.001
|
0.06 |
|
FFM (%) |
62.34 ± 11.73 |
62.37 ± 12.44 |
62.07 ± 12.97 |
62.25 ± 12.35 |
0.57 |
0.98 |
|
BMR |
78.46 ± 15.94 |
79.45 ± 14.9 |
77.08 ± 17.76 |
78.34 ± 16.87 |
0.49 |
0.74 |
|
Total energy (kcal/day) |
3,426.14 ± 344.30 |
2,806.0 ± 351.5 |
2,235.6 ± 767.7 |
3,017.8 ± 790.04 |
< 0.001
|
< 0.001
|
|
Weight |
92.71 ± 13.162 |
92.85 ± 15.648 |
90.80 ± 14.439 |
92.11 ± 14.441 |
0.22 |
0.48 |
The energy-adjusted dietary intakes of participants in each tertile of HBI are shown in
Table 2. All dietary intakes were significantly lower in higher tertiles of HBI (p < 0.05) except for vitamin K. However, after adjusting the confounders, many of these differences disappeared, and the intake of vitamin D, magnesium, and calcium decreased significantly across HBI tertiles in the adjusted model (p < 0.001).
Table 2 Energy-adjusted dietary intakes and tertiles of HBI
Table 2
|
Parameters |
Tertiles of HBI |
p value*
|
p value†
|
|
1st (n = 112) |
2nd (n = 113) |
3rd (n = 113) |
|
Vitamin B3 (mg/day) |
39 ± 11.7 |
27.5 ± 6 |
22.7 ± 8 |
< 0.001
|
0.70 |
|
Protein (g/day) |
132 ± 40 |
94 ± 18 |
75.5 ± 25.5 |
< 0.001
|
0.78 |
|
Fat (g/day) |
137 ± 53.5 |
94 ± 27 |
73 ± 33 |
< 0.001
|
0.22 |
|
Carbohydrate (g/day) |
615 ± 167 |
418 ± 66 |
336 ± 121 |
< 0.001
|
0.65 |
|
Saturated fatty acid (mg/day) |
40 ± 18.5 |
27.3 ± 8.5 |
21.4 ± 9.7 |
< 0.001
|
0.76 |
|
Vitamin A (RAE/day) |
1,142 ± 694 |
854.5 ± 474 |
728 ± 786 |
< 0.001
|
0.39 |
|
Vitamin D (μg/day) |
2.57 ± 1.85 |
2.02 ± 1.40 |
1.54 ± 0.99 |
< 0.001
|
0.03
|
|
Vitamin E (mg/day) |
20.68 ± 7.80 |
16 ± 8 |
12 ± 6.1 |
< 0.001
|
0.15 |
|
Vitamin K (μg/day) |
29 ± 48.4 |
35 ± 22.3 |
35 ± 51.5 |
< 0.001
|
0.15 |
|
Vitamin C (mg/day) |
323.37 ± 217.50 |
234.50 ± 131 |
172 ± 155.5 |
< 0.001
|
0.61 |
|
Vitamin B12 (μg/day) |
6.91 ± 5.60 |
4.67 ± 4.16 |
4.53 ± 7.40 |
< 0.001
|
0.64 |
|
Magnesium (mg/day) |
719.3 ± 281.5 |
513.5 ± 98 |
411 ± 63 |
< 0.001
|
0.03
|
|
Iron (mg/day) |
32.5 ± 13.5 |
22 ± 4.5 |
17.5 ± 6.5 |
< 0.001
|
0.98 |
|
Zinc (mg/day) |
19.8 ± 9 |
14 ± 3 |
11 ± 4 |
< 0.001
|
0.30 |
|
Calcium (mg/day) |
1,766 ± 0.651 |
1,206 ± 290 |
935 ± 352 |
< 0.001
|
0.05
|
|
Vitamin B2 (mg/day) |
3.5 ± 1 |
2.5 ± 0.5 |
2 ± 0.73 |
< 0.001
|
0.11 |
The mean ± SD of each of the 8 components of the HBI is presented for the full sample of adults as well as across tertile of HBI scores in
Table 3. The average HBI score of Tabriz participants was 59.76 ± 6.51. A difference of about 14 points separated the average HBI scores in the lowest and highest tertiles. The mean intake of water, coffee or tea, low-fat milk, 100% natural fruit juice, full-fat milk, and sugar-sweetened beverages did not differ across HBI tertiles (p > 0.05), whereas participants in higher HBI tertiles had higher intakes of total beverage energy and met total fluid requirements (p < 0.001).
Table 3 Distribution of participants’ beverage components
Table 3
|
Beverage components |
Tertiles of HBI |
p value*
|
|
1st (n = 112) |
2nd (n = 113) |
3rd (n = 113) |
Total (n = 338) |
|
Water |
14.64 ± 1.04 |
15.00 ± 0.00 |
14.95 ± 0.30 |
14.88 ± 0.63 |
0.985 |
|
Coffee and tea |
4.95 ± 0.48 |
5.00 ± 0.00 |
4.82 ± 0.47 |
4.92 ± 0.39 |
0.962 |
|
Low-fat milk |
5.00 ± 0.00 |
5.00 ± 0.00 |
5.00 ± 0.00 |
5.00 ± 0.00 |
1.00 |
|
100% fruit juice |
5.00 ± 0.00 |
5.00 ± 0.00 |
5.00 ± 0.00 |
5.00 ± 0.00 |
1.00 |
|
Full-fat milk |
5.00 ± 0.00 |
5.00 ± 0.00 |
5.00 ± 0.00 |
5.00 ± 0.00 |
1.00 |
|
Sugar-sweetened beverages |
14.09 ± 2.06 |
14.95 ± 0.46 |
14.75 ± 1.22 |
14.61 ± 1.43 |
0.896 |
|
Total beverage energy |
0.00 ± 0.00 |
0.00 ± 0.00 |
1.36 ± 5.06 |
0.47 ± 3.06 |
< 0.001
|
|
Met total fluid requirements |
6.35 ± 2.56 |
8.93 ± 1.14 |
15.77 ± 4.53 |
10.53 ± 4.99 |
< 0.001
|
|
Total HBI |
53.59 ± 3.95 |
58.89 ± 1.08 |
66.68 ± 4.81 |
59.76 ± 6.51 |
< 0.001
|
The chemical properties of the participants are shown in
Table 4. A significant relationship was found between HBI and TG scores. It has also been shown that at higher HBI scores (third tertile) than at lower scores (first tertile), HDL-C levels increase while HOMA-IR, LDL-C, TC, and blood pressure decrease (
Table 2); meanwhile, these changes were not statistically meaningful (p > 0.05).
Table 4 Biochemical parameters of the study population by tertiles of HBI
Table 4
|
Parameters |
Tertiles of HBI |
p value*
|
p value†
|
|
1st (n = 112) |
2nd (n = 113) |
3rd (n = 113) |
Total (n = 338) |
|
Participant characteristics |
|
|
|
|
|
|
|
Serum glucose (mmol/L) |
91.74 ± 16.27 |
93.34 ± 24.68 |
92.89 ± 15.39 |
92.667 ± 19.188 |
0.89 |
0.81 |
|
Insulin (μIU/mL) |
15.34 ± 11.42 |
18.05 ± 17.84 |
15.22 ± 10.89 |
16.17 ± 13.66 |
0.25 |
0.32 |
|
HOMA-IR |
3.45 ± 2.48 |
4.28 ± 4.21 |
3.58 ± 2.88 |
3.76 ± 3.26 |
0.21 |
0.21 |
|
HDL-C (mg/dL) |
43.22 ± 9.28 |
42.44 ± 9.49 |
44.29 ± 9.75 |
43.32 ± 9.52 |
0.13 |
0.33 |
|
LDL-C (mg/dL) |
121.89 ± 28.31 |
127.06 ± 34.31 |
122.11 ± 32.52 |
123.68 ± 31.83 |
0.32 |
0.37 |
|
TC (mg/dL) |
189.50 ± 32.32 |
196.66 ± 39.79 |
188.23 ± 37.12 |
191.45 ± 36.64 |
0.13 |
0.17 |
|
TG (mg/dL) |
137.56 ± 57.71 |
171.74 ± 126.06 |
139.63 ± 73.08 |
152.55 ± 94.13 |
0.01
|
0.01*
|
|
SBP (mmHg) |
123.16 ± 19.44 |
124.01 ± 14.55 |
121.82 ± 14.89 |
122.99 ± 18.35 |
0.59 |
0.59 |
|
DBP (mmHg) |
81.10 ± 13.04 |
82.43 ± 11.53 |
81.80 ± 10.43 |
81.78 ± 11.69 |
0.22 |
0.69 |
DISCUSSION
We aimed to describe the progress of a scoring system to assess an individual’s beverage consumption in line with current recommendations and assess the relationship between beverage consumption scores and metabolic factors in adults. We showed that HBI can measure a person’s overall health concerning the beverages consumed. However, these findings can be used as a first step in developing interventions to improve drinking patterns. Few studies have examined the association between HBI and its associated outcomes [
35]. In the present study we performed to evaluate the association of HBI with metabolic factors among adults in Tabriz, a positive correlation was seen between higher HBI scores and a more favorable lipid profile and the risk of hypertension [
35]. The present study showed a positive association between HBI and weight loss. We also showed that participants in the third tertile of HBI had lower levels of body weight. Reducing macronutrient intake is the highest level of adherence to HBI. A study by Duffey and Davy [
35] in the United States on healthy adults aged 18–30 showed that HBI scores were associated with metabolic syndrome. A study of children by Jalilpiran et al. [
37] in Tehran showed that HBI scores were associated with weight loss and slimming, indicating consistent results with our study. A single study by Lee and Shin [
38] in Korea on adults aged 40–69 showed that receiving healthy drinks led to higher HBI scores and reduced central obesity.
In most cases, the adults in Tabriz consumed the recommended beverages, including coffee, tea, low-fat milk, high-fat milk, 100% natural fruit juice, and all the fluids necessary for the human body. The component that consistently had the highest score for people (i.e., recommended intakes) was low-fat milk. The most distinguished components were the HBI tertiary scores of water (20% to 50% fluid requirements), SSBs (0% to 8% fluid requirements), and total drink energy consumption (10% to 14% of total energy). A range of 10 points in scores to meet water needs indicates that people with the highest HBI scores consume most of their fluids from water. The higher score range for SSBs and the total energy components of the drink suggest that the recommendations related to these components are the ones that adults in Tabriz are most involved in. Although recent data show that SSB intake has declined, it is estimated that SSBs account for 8% of total daily energy intake [
39]. SSBs are a source of minerals the body requires [
40], but they have little nutritional value.
Given the public media’s emphasis on reducing SSB intake, it is possible that the intake of energy-rich and nutrient-poor beverages has decreased. These changes have not yet helped reduce waist circumference. This result will be unexpected, especially if these changes in beverage consumption are expected recently and/or are not accompanied by other beneficial health behaviors (e.g., decreased total energy expenditure and increased physical activity). Although we control all energy consumption, we did not examine the relationship in more detail using specific macronutrients, as this was beyond the scope of our study. Fluid deficiency is associated with many adverse health outcomes [
41,
42], and up to a quarter of cardiovascular deaths may be prevented through healthy lifestyle behaviors [
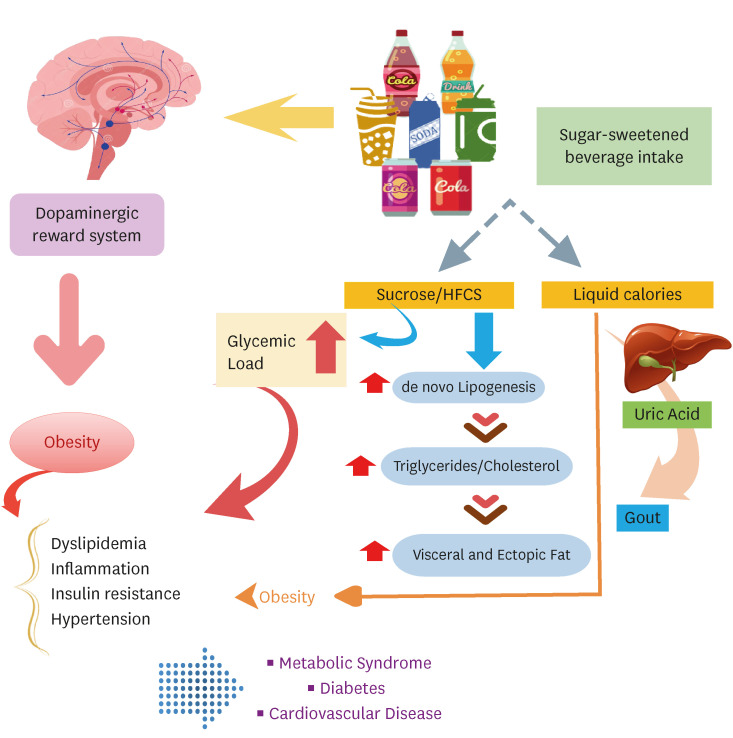
43]. HBI provides measurable drinking instructions that improve several important health outcomes. A mechanistic summary of adverse health outcomes of SSB consumption is presented in
Figure 1.
Figure 1
A summary of adverse health effects of sugar-sweetened beverages consumption.
HFCS, high-fructose corn syrup.

Although this study indicates a meaningful association between TG levels and HBI, there were no statistically meaningful differences among HBI tertiles in terms of blood pressure, glucose, insulin-related parameters, HDL-C, and LDL-C, as Rasaei et al. [
44] in a cross-sectional study on 210 females with obesity observed no significant association between higher HBI scores and the likelihood of abnormal metabolic status.
Our study has limitations, such as selecting components based on evidence-based recommendations [
12,
35,
45]. However, there may have been other important components that we could not consider. Although the scoring system to assign points to individuals is somewhat arbitrary, we tested an alternative scoring system. However, it did not increase our ability to distinguish between components with little variability. As a result, we developed a scoring system that prioritized components that are associated with health outcomes. All cross-sectional studies are susceptible to errors and bias in reporting self-observed and self-reported dietary data. Natural reporting errors that arise when utilizing FFQ, such as improper data classification, is a study limitation that cannot be avoided. Also, the prevalence of SSB consumption in Tabriz and the large volume of study samples were the strengths of the study. Therefore, prospective studies should evaluate these associations over longer periods. The cross-sectional design of this study prevented us from making a definite link between HBI and anthropometric status. According to our information, this is the first study to examine the relationship between HBI and metabolic factors in adults in Tabriz.
CONCLUSION
Our study showed a positive relationship between HBI scores and obesity. Prospective studies are also needed to assess the association between HBI scores and metabolic factors in adults over a long period.
Tabriz University of Medical Scienceshttps://doi.org/10.13039/501100004366
NOTES
-
Funding: The work has been granted by Research Undersecretary of Tabriz University of Medical Sciences.
-
Conflict of Interest: The authors declare that they have no competing interests.
-
Author Contributions:
Conceptualization: Abbasalizad Farhangi M.
Data curation: Tousi AZ, Nikrad N.
Formal analysis: Jahanbazi L, Abbasalizad Farhangi M, Tousi AZ.
Methodology: Jahanbazi L.
Project administration: Abbasalizad Farhangi M.
Supervision: Abbasalizad Farhangi M.
Writing - original draft: Abbasalizad Farhangi M.
Writing - review & editing: Tousi AZ, Nikrad N.
ACKNOWLEDGEMENTS
We thank all of the study participants. We also thank the Research Undersecretary of Tabriz University of Medical Sciences for their financial support (Code: IR.TBZMED.REC.1401.087 with grant number: 68837 and IR.TBZMED.REC.1401.444 with grant number: 70010).
REFERENCES
- 1. Zheng W, McLerran DF, Rolland B, Zhang X, Inoue M, Matsuo K, He J, Gupta PC, Ramadas K, Tsugane S, Irie F, Tamakoshi A, Gao YT, Wang R, Shu XO, Tsuji I, Kuriyama S, Tanaka H, Satoh H, Chen CJ, Yuan JM, Yoo KY, Ahsan H, Pan WH, Gu D, Pednekar MS, Sauvaget C, Sasazuki S, Sairenchi T, Yang G, Xiang YB, Nagai M, Suzuki T, Nishino Y, You SL, Koh WP, Park SK, Chen Y, Shen CY, Thornquist M, Feng Z, Kang D, Boffetta P, Potter JD. Association between body-mass index and risk of death in more than 1 million Asians. N Engl J Med 2011;364:719-729.
- 2. Ni Mhurchu C, Rodgers A, Pan WH, Gu DF, Woodward M. Asia Pacific Cohort Studies Collaboration. Body mass index and cardiovascular disease in the Asia-Pacific Region: an overview of 33 cohorts involving 310 000 participants. Int J Epidemiol 2004;33:751-758.
- 3. NCD Risk Factor Collaboration (NCD-RisC). Trends in adult body-mass index in 200 countries from 1975 to 2014: a pooled analysis of 1698 population-based measurement studies with 19·2 million participants. Lancet 2016;387:1377-1396.
- 4. NCD Risk Factor Collaboration (NCD-RisC). Heterogeneous contributions of change in population distribution of body mass index to change in obesity and underweight. eLife 2021;10:e60060.
- 5. Janghorbani M, Amini M, Willett WC, Mehdi Gouya M, Delavari A, Alikhani S, Mahdavi A. First nationwide survey of prevalence of overweight, underweight, and abdominal obesity in Iranian adults. Obesity (Silver Spring) 2007;15:2797-2808.
- 6. Al-Hazzaa HM, Abahussain NA, Al-Sobayel HI, Qahwaji DM, Alsulaiman NA, Musaiger AO. Prevalence of overweight, obesity, and abdominal obesity among urban Saudi adolescents: gender and regional variations. J Health Popul Nutr 2014;32:634-645.
- 7. de Castro JM. A twin study of genetic and environmental influences on the intake of fluids and beverages. Physiol Behav 1993;54:677-687.
- 8. Wenhold F, Faber M. Water in nutritional health of individuals and households: an overview. Water SA 2009;35:61-71.
- 9. Daniels MC, Popkin BM. Impact of water intake on energy intake and weight status: a systematic review. Nutr Rev 2010;68:505-521.
- 10. Muckelbauer R, Sarganas G, Grüneis A, Müller-Nordhorn J. Association between water consumption and body weight outcomes: a systematic review. Am J Clin Nutr 2013;98:282-299.
- 11. Dennis EA, Flack KD, Davy BM. Beverage consumption and adult weight management: a review. Eat Behav 2009;10:237-246.
- 12. Popkin BM, Armstrong LE, Bray GM, Caballero B, Frei B, Willett WC. A new proposed guidance system for beverage consumption in the United States. Am J Clin Nutr 2006;83:529-542.
- 13. Armstrong LE, Ganio MS, Casa DJ, Lee EC, McDermott BP, Klau JF, Jimenez L, Le Bellego L, Chevillotte E, Lieberman HR. Mild dehydration affects mood in healthy young women. J Nutr 2012;142:382-388.
- 14. Ganio MS, Armstrong LE, Casa DJ, McDermott BP, Lee EC, Yamamoto LM, Marzano S, Lopez RM, Jimenez L, Le Bellego L, Chevillotte E, Lieberman HR. Mild dehydration impairs cognitive performance and mood of men. Br J Nutr 2011;106:1535-1543.
- 15. Vartanian LR, Schwartz MB, Brownell KD. Effects of soft drink consumption on nutrition and health: a systematic review and meta-analysis. Am J Public Health 2007;97:667-675.
- 16. Brown IJ, Stamler J, Van Horn L, Robertson CE, Chan Q, Dyer AR, Huang CC, Rodriguez BL, Zhao L, Daviglus ML, Ueshima H, Elliott P. International Study of Macro/Micronutrients and Blood Pressure Research Group. Sugar-sweetened beverage, sugar intake of individuals, and their blood pressure: international study of macro/micronutrients and blood pressure. Hypertension 2011;57:695-701.
- 17. Johnson RK, Appel LJ, Brands M, Howard BV, Lefevre M, Lustig RH, Sacks F, Steffen LM, Wylie-Rosett J. American Heart Association Nutrition Committee of the Council on Nutrition, Physical Activity, and Metabolism and the Council on Epidemiology and Prevention. Dietary sugars intake and cardiovascular health: a scientific statement from the American Heart Association. Circulation 2009;120:1011-1020.
- 18. Gui ZH, Zhu YN, Cai L, Sun FH, Ma YH, Jing J, Chen YJ. Sugar-sweetened beverage consumption and risks of obesity and hypertension in Chinese children and adolescents: a national cross-sectional analysis. Nutrients 2017;9:1302.
- 19. Jin Y, Zhang C, Zhang R, Ren J, Chen S, Sui M, Zhou G, Dang D, Zhu J, Feng H, Xi Y, Yang H, Duan G. Pulmonary edema following central nervous system lesions induced by a non- mouse-adapted EV71 strain in neonatal BALB/c mice. Virol J 2017;14:243.
- 20. Carson C, Birkett MA, Logan JG, Mawa K, Pates HV, Pickett JA, Rwegoshora RT, Tungu PK, Cameron MM. Novel use of stir bar sorptive extraction (SBSE) as a tool for isolation of oviposition site attractants for gravid Culex quinquefasciatus. Bull Entomol Res 2010;100:1-7.
- 21. LaRowe TL, Moeller SM, Adams AK. Beverage patterns, diet quality, and body mass index of US preschool and school-aged children. J Am Diet Assoc 2007;107:1124-1133.
- 22. Guenther PM, Casavale KO, Reedy J, Kirkpatrick SI, Hiza HA, Kuczynski KJ, Kahle LL, Krebs-Smith SM. Update of the healthy eating index: HEI-2010. J Acad Nutr Diet 2013;113:569-580.
- 23. Lim S, Zoellner JM, Lee JM, Burt BA, Sandretto AM, Sohn W, Ismail AI, Lepkowski JM. Obesity and sugar-sweetened beverages in African-American preschool children: a longitudinal study. Obesity (Silver Spring) 2009;17:1262-1268.
- 24. Milloy MJ, Wood E. Withdrawal from methadone in US prisons: cruel and unusual? Lancet 2015;386:316-318.
- 25. Forshee RA, Anderson PA, Storey ML. Sugar-sweetened beverages and body mass index in children and adolescents: a meta-analysis. Am J Clin Nutr 2008;87:1662-1671.
- 26. Keller A, Bucher Della Torre S. . Sugar-sweetened beverages and obesity among children and adolescents: a review of systematic literature reviews. Child Obes 2015;11:338-346.
- 27. Popkin BM, D’Anci KE, Rosenberg IH. Water, hydration, and health. Nutr Rev 2010;68:439-458.
- 28. McCracken KW, Howell JC, Wells JM, Spence JR. Generating human intestinal tissue from pluripotent stem cells in vitro. Nat Protoc 2011;6:1920-1928.
- 29. Abbasalizad Farhangi M, Vajdi M, Nikniaz L, Nikniaz Z. The interaction between dietary inflammatory index and 6 P21 rs2010963 gene variants in metabolic syndrome. Eat Weight Disord 2020;25:1049-1060.
- 30. Khodarahmi M, Asghari-Jafarabadi M, Abbasalizad Farhangi M. A structural equation modeling approach for the association of a healthy eating index with metabolic syndrome and cardio-metabolic risk factors among obese individuals. PLoS One 2019;14:e0219193.
- 31. Oh JY, Yang YJ, Kim BS, Kang JH. Validity and reliability of Korean version of International Physical Activity Questionnaire (IPAQ) short form. J Korean Acad Fam Med 2007;28:532-541.
- 32. Falahi E, Khalkhali Rad AH, Roosta S. What is the best biomarker for metabolic syndrome diagnosis? Diabetes Metab Syndr 2015;9:366-372.
- 33. Esfahani FH, Asghari G, Mirmiran P, Azizi F. Reproducibility and relative validity of food group intake in a food frequency questionnaire developed for the Tehran Lipid and Glucose Study. J Epidemiol 2010;20:150-158.
- 34. Green BF Jr. A note on the calculation of weights for maximum battery reliability. ETS Research Bulletin Series 1950;1950:i-7.
- 35. Duffey KJ, Davy BM. The healthy beverage index is associated with reduced cardiometabolic risk in US adults: a preliminary analysis. J Acad Nutr Diet 2015;115:1682-1689.e2.
- 36. Fukuyama N, Homma K, Wakana N, Kudo K, Suyama A, Ohazama H, Tsuji C, Ishiwata K, Eguchi Y, Nakazawa H, Tanaka E. Validation of the Friedewald equation for evaluation of plasma LDL-cholesterol. J Clin Biochem Nutr 2008;43:1-5.
- 37. Jalilpiran Y, Mozaffari H, Askari M, Jafari A, Azadbakht L. The association between Healthy Beverage Index and anthropometric measures among children: a cross-sectional study. Eat Weight Disord 2021;26:1437-1445.
- 38. Lee KW, Shin D. A healthy beverage consumption pattern is inversely associated with the risk of obesity and metabolic abnormalities in Korean adults. J Med Food 2018;21:935-945.
- 39. Kit BK, Fakhouri TH, Park S, Nielsen SJ, Ogden CL. Trends in sugar-sweetened beverage consumption among youth and adults in the United States: 1999-2010. Am J Clin Nutr 2013;98:180-188.
- 40. Huth PJ, Fulgoni VL 3rd, Keast DR, Park K, Auestad N. Major food sources of calories, added sugars, and saturated fat and their contribution to essential nutrient intakes in the U.S. diet: data from the National Health and Nutrition Examination Survey (2003-2006). Nutr J 2013;12:116.
- 41. Maughan RJ. Hydration, morbidity, and mortality in vulnerable populations. Nutr Rev 2012;70(Suppl 2):S152-S155.
- 42. Roussel R, Fezeu L, Bouby N, Balkau B, Lantieri O, Alhenc-Gelas F, Marre M, Bankir L. D.E.S.I.R. Study Group. Low water intake and risk for new-onset hyperglycemia. Diabetes Care 2011;34:2551-2554.
- 43. Centers for Disease Control and Prevention (CDC). Vital signs: avoidable deaths from heart disease, stroke, and hypertensive disease - United States, 2001-2010. MMWR Morb Mortal Wkly Rep 2013;62:721-727.
- 44. Rasaei N, Hosseininasab D, Shiraseb F, Gholami F, Noori S, Ghaffarian-Ensaf R, Daneshzad E, Clark CCT, Mirzaei K. The association between Healthy Beverage Index and healthy and unhealthy obesity phenotypes among obese women: a cross-sectional study. Int J Clin Pract 2022;2022:7753259.
- 45. Institute of Medicine. Food and Nutrition Board. Panel on Macronutrients. Panel on the Definition of Dietary Fiber. Subcommittee on Upper Reference Levels of Nutrients. Subcommittee on Interpretation and Uses of Dietary Reference Intakes. Standing Committee on the Scientific Evaluation of Dietary Reference Intakes. Dietary Reference Intakes: energy, carbohydrate, fiber, fat, fatty acids, cholesterol, protein and amino acids. Washington, D.C.: National Academies Press; 2005.