ABSTRACT
Obesity and overweight pose a significant public health problem, as they are associated with an elevated risk of metabolic syndrome (MetS). Several studies have shown that diet quality is associated with the development of MetS risk factors. Analyzing dietary patterns may be more helpful in determining the relationship between eating habits and chronic diseases compared to focusing on single foods or nutrients. In this study, our objective was to evaluate the association of food quality score (FQS) with risk factors for MetS in individuals with obesity and overweight. The participants in this cross-sectional study were 340 adults with overweight and obesity. Participants’ food intake was measured using a Food Frequency Questionnaire, then the FQS was calculated. A fasting blood sample assessed serum glucose, triglycerides, total cholesterol (TC), high-density lipoprotein cholesterol, and serum insulin levels. Fat-free mass, height, basal metabolic rate, socio-economic score, and waist-to-hip ratio significantly differed among FQS tertiles. TC, systolic and diastolic blood pressure, and fasting blood glucose were significantly lower in the highest tertile of FQS. After multivariable adjustment, our results showed that individuals in the third tertile of FQS had reduced risk of higher levels of TC (odds ratio [OR], 0.982; 95% confidence interval [CI], 0.970–0.984) and higher levels of low-density lipoprotein cholesterol (OR, 0.974; 95% CI, 0.974–0.999). Our findings demonstrate an inverse relationship between diet quality, as measured by FQS, and MetS risk factors. However, further experimental and longitudinal investigations are warranted to elucidate the causal nature of this association.
-
Keywords: Obesity; Food quality score; Metabolic syndrome; Metabolic parameters
INTRODUCTION
Overweight and obesity continue to be significant public health concerns and risk factors of major importance that contribute to the overall disease burden [
1,
2,
3]. Overweight and obesity are linked to a higher risk of metabolic disorders, including type 2 diabetes mellitus, cardiovascular disease, several types of cancer, hypertension [
4], and metabolic syndrome (MetS) [
5]. MetS, a global epidemic with high socioeconomic costs, is a collection of health conditions marked by increased blood pressure, dyslipidemia, glucose dysregulation, central adiposity, and insulin resistance [
6]. Identifying these patients allows us to emphasize the need for a healthy lifestyle to further reduce the risk [
7]. MetS is estimated to affect approximately one-quarter of the world's population. Furthermore, MetS and its associated health conditions account for approximately two-thirds of deaths caused by non-communicable diseases [
8]. Additionally, compared with people without MetS, those with MetS are more likely to develop cardiovascular diseases, type 2 diabetes, and heart attacks or strokes [
9]. MetS prevalence has surged in recent decades owing to socioeconomic status, lifestyle, and dietary habits alterations [
10].
Numerous studies represented that an individual’s diet is related to the development of MetS risk factors. Current approaches to determining the effect of diet on chronic diseases primarily focus on analyzing dietary patterns rather than individual foods and nutrients [
11]. Dietary patterns provide a broader view of people’s eating habits as people do not eat single nutrients but rather a combination of foods, resulting in the overall effect of individual nutrients and their interactions. Moreover, there are synergistic effects between different nutrients in foods, and the impact of a single nutrient is challenging to detect; analyzing dietary patterns may be more helpful in determining the relationship between eating habits and chronic diseases [
12,
13,
14]. Dietary patterns and overall diet quality of individuals can be assessed by diet-quality indices with regard to chronic disease risk [
15,
16]. Food quality score (FQS) is a simple food-based diet-quality index that can be easily applied without requiring nutrient calculations. FQS is calculated by adding various food group scores that fall into healthy and unhealthy categories [
17]. A limited number of studies have evaluated FQS in association with metabolic syndrome [
18], coronary heart disease [
17], cardiovascular disease [
19], breast cancer [
20], inflammatory biomarkers and antioxidant capacity [
21], and mental health [
22].
The FQS stands out as one of the rare diet quality indices formulated considering the entire diet. Remarkably, the relation between FQS and MetS risk factors remains unexplored in adults characterized by overweight and obesity. Consequently, our study was designed to delve into the connection between FQS and MetS risk factors in individuals grappling with overweight and obesity.
MATERIALS AND METHODS
Participants
For this cross-sectional study, 340 overweight and obese individuals were recruited from previous projects [
23,
24,
25]. Participants were recruited from outpatient clinics through convenience sampling, facilitated by public advertisements using various tools such as flyers and posters. The eligibility criteria encompassed individuals between 20 and 50, with a body mass index (BMI) exceeding 25 kg/m
2. Conversely, the exclusion criteria encompassed menopause, lactation, pregnancy, and history of type 2 diabetes, cardiovascular disease, cancer, renal disease, or taking any weight-affecting medications. Prior to participating in the study, all participants provided both verbal and written informed consent.
Socio-demographic information, encompassing age, gender, marital status, educational attainment, smoking status, and family size, was collected through interviews. Additionally, socioeconomic status (SES) was determined using the methodology outlined by Khodarahmi et al. [
25].
Body weight, height, waist circumference (WC), and hip circumference (HC) were measured. BMI and waist-to-hip ratio (WHR) were also calculated. Further, physical activity was assessed via a short form of the International Physical Activity Questionnaire (IPAQ) [
26]. After at least 15 minutes of rest, blood pressure was measured using a standard mercury sphygmomanometer (Riester Diplomat 1002; Rudolf Riester GmbH, Jungingen, Germany). Body composition was determined using bioelectrical impedance analysis (BIA) (Tanita BC-418 MA; Tanita Corp., Tokyo, Japan).
Participants’ dietary intake was measured using a 168-item validated semi-quantitative Food Frequency Questionnaire (FFQ) [
27]. To determine the frequency of consumption of each food item in the previous year, a qualified nutritionist conducted an interview with participants. Subsequently, the food intake was recalculated and expressed in grams per day [
28]. The U.S. Department of Agriculture database was used to assess the participants’ daily dietary intake. The approach outlined before by Fung et al. [
17] was then applied to calculate FQS. This score covered important foods and dietary categories representing overall diet quality. Each food group was categorized as favorable or unfavorable based on its health effects. The healthy food group included nuts, fruits, whole grains, vegetables, yogurt, and coffee. In contrast, the unhealthy food group consisted of desserts, red meats, ice cream, potatoes, refined grains, sugar-sweetened beverages, processed meats, potato chips, and fried foods prepared away from home. Thus, there were fourteen food groups in total. Participants’ intakes were ranked into quintiles for each food group. Scores ranging from 1 to 5 were assigned based on these quintile rankings. Notably, participants with the highest intake of each food group deemed healthy received a score of 5, indicating optimal adherence to a health-promoting diet in those specific categories, and individuals with the lowest intake of these food groups received a score of 1 for each group. Conversely, quintile rankings were reversed for the unhealthy food groups, with a score of 1 assigned to individuals with the highest consumption and 5 to the ones with the lowest intake of unhealthy food groups. To derive the overall FQS, the assigned scores for each food group were cumulatively tallied, resulting in a comprehensive score ranging from 14 to 70 for each participant. It was important to note that a higher total score corresponds to a diet emphasizing healthier food choices across all evaluated categories.
Prior studies [
23,
24,
25] have provided detailed methods for the biochemical assessment. Total cholesterol (TC), serum glucose, triglyceride (TG), high-density lipoprotein cholesterol (HDL-C), low-density lipoprotein cholesterol (LDL-C), serum insulin levels, homeostatic model assessment for insulin resistance (HOMA-IR), and quantitative insulin-sensitivity check index (QUICKI) were assessed from blood samples collected after an overnight fast.
Data analysis was performed using SPSS version 26 (IBM Corp., Armonk, NY, USA), maintaining a significance level of 0.05. Categorical data were expressed as percentages, while continuous variables were summarized as mean and standard deviation. Continuous variables were compared using analysis of covariance, while categorical variables were evaluated through the χ2 test. Furthermore, multinomial logistic regression was applied to explore the relationship between FQS tertiles and biochemical variables. This approach allowed for the estimation of odds ratios (ORs) and 95% confidence intervals (CIs) in both crude and multivariable-adjusted models.
Ethics approval and consent to participate
Participants in the study all furnished written informed consent before their involvement. The study protocol was reviewed and registered by the ethics committee of Tabriz University of Medical Sciences (registration code: IR.TBZMED.REC.1401.1010, IR.TBZMED.REC.1398.460). It is confirmed that the research methods adhered to the guidelines and regulations outlined in the Declaration of Helsinki. In instances involving illiterate participants, written informed consent was obtained from their legal guardians.
RESULTS
The total sample size included 340 subjects with a mean age of 40.64 ± 9.18 years and a BMI of 32.66 ± 4.84 kg/m
2. The characteristics of participants by FQS tertiles are presented in
Table 1. Tertiles of FQS differed significantly (p < 0.05) in height, fat-free mass, SES, WHR, and basal metabolic rate. There were no significant differences across tertiles of FQS for other characteristics (p ≥ 0.05). After multivariable adjustment, no significant differences in baseline characteristics were observed among FQS tertiles (p ≥ 0.05).
Table 1 Demographic and anthropometric characteristics of participants across different tertiles of FQS
Table 1
|
Variables |
Tertiles of FQS |
p value |
p value*
|
|
1st tertile (n = 114) |
2nd tertile (n = 113) |
3rd tertile (n = 113) |
|
Age (yr) |
40.17 ± 9.30 |
39.84 ± 8.77 |
41.93 ± 9.40 |
0.185 |
- |
|
Weight (kg) |
93.71 ± 14.11 |
93.08 ± 14.93 |
89.51 ± 14.21 |
0.063 |
0.589 |
|
Height (cm) |
170.21 ± 9.91 |
168.97 ± 9.89 |
164.68 ± 9.01 |
< 0.001
|
0.886 |
|
BMI (kg/m2) |
32.40 ± 4.73 |
32.60 ± 5.24 |
32.97 ± 4.54 |
0.666 |
0.440 |
|
Sex (male) |
79 (69.30) |
71 (62.83) |
46 (40.71) |
< 0.001
|
- |
|
SES score |
10.54 ± 2.38 |
9.88 ± 2.46 |
9.43 ± 2.61 |
0.043
|
- |
|
WC (cm) |
107.52 ± 9.20 |
107.17 ± 10.62 |
105.43 ± 9.01 |
0.219 |
0.661 |
|
HC (cm) |
114.02 ± 9.05 |
115.36 ± 10.31 |
115.33 ± 8.23 |
0.506 |
0.181 |
|
WHR |
0.95 ± 0.07 |
0.93 ± 0.08 |
0.92 ± 0.07 |
0.015
|
0.475 |
|
FM (kg) |
32.85 ± 7.92 |
34.16 ± 10.12 |
34.48 ± 9.37 |
0.567 |
0.310 |
|
FFM (kg) |
65.45 ± 11.81 |
63.16 ± 12.81 |
58.01 ± 11.41 |
0.002
|
0.903 |
|
BMR (kcal) |
2,015.59 ± 458.71 |
1,921.54 ± 365.62 |
1,772.77 ± 315.18 |
0.002
|
0.767 |
|
PA (MET-min/week) |
2,341.74 ± 3,444.68 |
2,188.67 ± 3,310.24 |
1,946.82 ± 2,911.89 |
0.787 |
- |
Table 2 demonstrates the MetS risk factors among study participants across different tertiles of FQS. Systolic blood pressure (SBP) (p = 0.007), diastolic blood pressure (DBP) (p = 0.023), TC (p = 0.021), and fasting blood glucose (FBG) (p = 0.032) were significantly lower in higher tertiles of FQS. However, HDL-C, TG, LDL-C, insulin, QUICKI, and HOMA-IR were not significantly different across tertiles of FQS (p ≥ 0.05). Nevertheless, after adjustments for multiple variables, there were no significant differences in cardiometabolic parameters among tertiles of FQS, except for TC (p ≥ 0.05).
Table 2 Cardiometabolic parameters of study participants by tertiles of FQS
Table 2
|
Variables |
Tertiles of FQS |
p value |
p value*
|
|
1st tertile (n = 114) |
2nd tertile (n = 113) |
3rd tertile (n = 113) |
|
SBP (mmHg) |
125.47 ± 16.04 |
122.97 ± 12.92 |
119.49 ± 13.38 |
0.007
|
0.069 |
|
DBP (mmHg) |
83.77 ± 12.61 |
81.31 ± 9.70 |
79.73 ± 12.37 |
0.023
|
0.096 |
|
TC (mg/dL) |
196.99 ± 36.90 |
194.18 ± 33.30 |
184.12 ± 38.69 |
0.021
|
0.016
|
|
TG (mg/dL) |
161.25 ± 85.34 |
144.01 ± 79.53 |
147.58 ± 93.18 |
0.339 |
0.273 |
|
HDL-C (mg/dL) |
43.39 ± 9.53 |
44.67 ± 10.28 |
42.43 ± 8.56 |
0.206 |
0.370 |
|
LDL-C (mg/dL) |
127.35 ± 29.42 |
125.26 ± 28.49 |
118.23 ± 36.83 |
0.080 |
0.131 |
|
Glucose (mg/dL) |
94.74 ± 15.49 |
94.63 ± 27.08 |
88.84 ± 11.62 |
0.032
|
0.249 |
|
Insulin (µIU/mL) |
16.40 ± 17.35 |
15.20 ± 10.81 |
16.53 ± 11.50 |
0.782 |
0.710 |
|
HOMA-IR |
3.77 ± 3.78 |
3.77 ± 3.32 |
3.67 ± 2.48 |
0.974 |
0.710 |
|
QUICKI |
0.33 ± 0.03 |
0.33 ± 0.03 |
0.33 ± 0.04 |
0.907 |
0.878 |
Participants’ dietary intake of FQS components and FQS mean are represented in
Table 3. The subjects in the third tertile of the FQS showed a greater dietary intake of whole grains, nuts, vegetables, fruits, and legumes (p < 0.05). In contrast, intakes of red meat, refined grains, processed meat, sugar-sweetened beverages, and potatoes were significantly lower in the third tertile of FQS (p < 0.05). Subjects in the third tertile of FQS had lower fat consumption and higher intake of potassium, iron, vitamin B6, magnesium, calcium, and vitamin C (
Table 4).
Table 3 Consumption rates of FQS components
Table 3
|
FQS components (g/d) |
Tertiles of FQS |
p value |
p value*
|
|
1st tertile (n = 114) |
2nd tertile (n = 113) |
3rd tertile (n = 113) |
|
FQS score |
37.40 ± 5.36 |
41.54 ± 4.56 |
46.87 ± 5.24 |
< 0.001
|
< 0.001
|
|
Whole grains |
126.25 ± 111.01 |
146.64 ± 106.74 |
164.87 ± 121.66 |
0.038
|
0.005
|
|
Fruits |
549.17 ± 479.25 |
681.19 ± 549.16 |
775.34 ± 514.19 |
0.004
|
< 0.001
|
|
Vegetables |
329.38 ± 227.59 |
395.42 ± 324.76 |
390.53 ± 218.10 |
0.106 |
0.016
|
|
Legumes and nuts |
51.51 ± 41.01 |
77.86 ± 65.84 |
83.57 ± 73.93 |
0.002
|
< 0.001
|
|
Coffee |
24.69 ± 66.72 |
14.68 ± 32.73 |
24.64 ± 45.87 |
0.230 |
0.240 |
|
Yogurt |
140.72 ± 179.35 |
162.48 ± 174.69 |
155.52 ± 232.55 |
0.697 |
0.409 |
|
Red meat |
20.53 ± 17.20 |
22.16 ± 31.87 |
14.43 ± 16.02 |
0.029
|
0.047
|
|
Processed meat |
11.70 ± 18.84 |
9.43 ± 14.21 |
6.06 ± 11.94 |
0.021
|
0.038
|
|
Refined grains |
420.73 ± 246.77 |
339.87 ± 180.77 |
315.08 ± 203.59 |
0.001
|
0.001
|
|
Sugar-sweetened beverages |
63.63 ± 83.63 |
36.05 ± 45.02 |
25.54 ± 67.40 |
< 0.001
|
< 0.001
|
|
Desserts and ice cream |
64.76 ± 55.38 |
54.29 ± 35.87 |
52.41 ± 58.56 |
0.145 |
0.306 |
|
Potato |
37.40 ± 41.67 |
33.61 ± 40.67 |
22.60 ± 22.25 |
0.006
|
0.018
|
|
Potato chips |
8.52 ± 17.52 |
7.19 ± 17.05 |
4.88 ± 13.62 |
0.231 |
0.397 |
|
Fried foods |
16.15 ± 20.20 |
18.58 ± 42.16 |
19.25 ± 56.62 |
0.845 |
0.764 |
Table 4 Dietary intakes of participants across different tertiles of FQS
Table 4
|
Dietary components |
Tertiles of FQS |
p value |
|
1st tertile (n = 114) |
2nd tertile (n = 113) |
3rd tertile (n = 113) |
|
Energy (kcal/d) |
3,050.73 ± 1,133.13 |
2,980.54 ± 1,076.36 |
2,847.78 ± 791.75 |
0.309 |
|
Protein (g/d) |
99.42 ± 36.97 |
101.28 ± 39.76 |
98.56 ± 34.85 |
0.055 |
|
Fat (g/d) |
109.89 ± 53.03 |
99.79 ± 45.03 |
93.19 ± 36.16 |
0.008
|
|
CHO (g/d) |
447.90 ± 167.82 |
444.83 ± 162.20 |
437.27 ± 136.69 |
0.067 |
|
Total fiber (g/d) |
66.88 ± 43.52 |
64.33 ± 36.23 |
66.97 ± 35.70 |
0.246 |
|
SFA (g/d) |
30.51 ± 17.09 |
29.60 ± 13.07 |
27.89 ± 14.47 |
0.954 |
|
MUFA (g/d) |
34.17 ± 17.53 |
33.06 ± 15.79 |
32.60 ± 16.84 |
0.684 |
|
PUFA (g/d) |
23.24 ± 13.46 |
22.14 ± 13.30 |
22.42 ± 13.10 |
0.466 |
|
Cholesterol (mg/d) |
313.58 ± 171.05 |
283.60 ± 125.31 |
261.38 ± 148.84 |
0.093 |
|
Sodium (mg/d) |
4,927.69 ± 2,758.89 |
4,713.54 ± 1,892.31 |
4,420.01 ± 1,919.91 |
0.579 |
|
Iron (mg/d) |
23.40 ± 9.56 |
23.33 ± 9.20 |
24.68 ± 13.14 |
0.005
|
|
Magnesium (mg/d) |
510.40 ± 200.23 |
557.26 ± 281.55 |
563.85 ± 202.90 |
< 0.001
|
|
Potassium (mg/d) |
4,421.16 ± 1,812.71 |
4,805.49 ± 2,241.73 |
5,012.03 ± 2,049.89 |
< 0.001
|
|
Calcium (mg/d) |
1,266.96 ± 580.49 |
1,261.37 ± 539.55 |
1,342.84 ± 584.03 |
0.003
|
|
Vitamin B1 (mg/d) |
2.69 ± 1.12 |
2.60 ± 1.00 |
2.58 ± 1.06 |
0.640 |
|
Vitamin B6 (mg/d) |
2.26 ± 0.86 |
2.34 ± 0.92 |
2.40 ± 0.95 |
0.001
|
|
Folic acid (mg/d) |
724.30 ± 301.14 |
720.49 ± 281.60 |
720.65 ± 295.38 |
0.169 |
|
Vitamin B12 (mg/d) |
5.86 ± 7.51 |
5.49 ± 5.43 |
4.66 ± 4.54 |
0.499 |
|
Vitamin C (mg/d) |
208.77 ± 160.11 |
237.03 ± 173.20 |
273.95 ± 197.90 |
0.001
|
ORs and 95% CIs for MetS risk factors by tertile of FQS were reported in
Table 5 in 2 different models, crude and adjusted for multiple variables. Participants in the highest tertile of FQS in the crude model had lower odds of SBP (OR, 0.971; 95% CI, 0.952–0.989) DBP (OR, 0.968; 95% CI, 0.946–0.991), FBG (OR, 0.974; 95% CI, 0.955–0.993), TC (OR, 0.990; 95% CI, 0.983–0.998). Following multivariable adjustment, in the model I, odds of SBP (OR, 0.968; 95% CI, 0.947–0.988), DBP (OR, 0.962; 95% CI, 0.938–0.987), FBG (OR, 0.968; 95% CI, 0.947–0.989), TC (OR, 0.989; 95% CI, 0.981–0.996), LDL-C (OR, 0.990; 95% CI, 0.981–0.998) were lower in the highest tertile of FQS. Likewise, in model II, participants in the highest tertile of FQS had lower odds of TC (OR, 0.982; 95% CI, 0.970–0.984) and LDL-C (OR, 0.986; 95% CI, 0.974–0.999). No other significant associations were seen in the two models, crude and adjusted for multiple variables (p ≥ 0.05).
Table 5 Crude and multivariable adjusted ORs and 95% CIs for cardiometabolic risk factors across different tertiles of FQS
Table 5
|
Variables |
Tertiles of FQS |
|
Crude ORs (95% CI) |
Model Ia ORs (95% CI) |
Model IIb ORs (95% CI) |
|
1st tertile (n = 114) |
2nd tertile (n = 113) |
3rd tertile (n = 113) |
1st tertile (n = 114) |
2nd tertile (n = 113) |
3rd tertile (n = 113) |
1st tertile (n = 114) |
2nd tertile (n = 113) |
3rd tertile (n = 113) |
|
SBP (mmHg) |
1 |
0.988 (0.969–1.005) |
0.971 (0.952–0.989)*
|
1 |
0.989 (0.970–1.009) |
0.968 (0.947–0.988)*
|
1 |
0.996 (0.968–1.025) |
0.972 (0.941–1.003) |
|
DBP (mmHg) |
1 |
0.979 (0.957–1.003) |
0.968 (0.946–0.991)*
|
1 |
0.980 (0.956–1.004) |
0.962 (0.938–0.987)*
|
1 |
0.973 (0.940–1.006) |
0.965 (0.931–1.001) |
|
FBG (mg/dL) |
1 |
1.000 (0.988–1.012) |
0.974 (0.955–0.993)*
|
1 |
1.000 (0.988–1.013) |
0.968 (0.947–0.989)*
|
1 |
1.004 (0.989–1.018) |
0.975 (0.946–1.005) |
|
TC (mg/dL) |
1 |
0.998 (0.991–1.005) |
0.990 (0.983–0.998)*
|
1 |
0.998 (0.991–1.005) |
0.989 (0.981–0.996)*
|
1 |
0.995 (0.984–1.006) |
0.982 (0.970–0.994)*
|
|
LDL-C (mg/dL) |
1 |
0.998 (0.990–1.006) |
0.991 (0.982–1.001) |
1 |
0.998 (0.990–1.006) |
0.990 (0.981–0.998)*
|
1 |
0.995 (0.983–1.007) |
0.986 (0.974–0.999)*
|
|
HDL-C (mg/dL) |
1 |
1.014 (0.987–1.042) |
0.989 (0.961–1.017) |
1 |
1.010 (0.981–1.040) |
0.965 (0.935–1.005) |
1 |
1.026 (0.983–1.072) |
0.950 (0.906–1.005) |
|
TG (mg/dL) |
1 |
0.998 (0.995–1.001) |
0.999 (0.996–1.001) |
1 |
0.998 (0.995–1.001) |
0.999 (0.996–1.002) |
1 |
0.995 (0.989–1.002) |
0.996 (0.990–1.003) |
|
Insulin (µIU/mL) |
1 |
0.993 (0.968–1.017) |
1.001 (0.979–1.022) |
1 |
0.992 (0.967–1.017) |
0.998 (0.976–1.021) |
1 |
1.003 (0.961–1.047) |
1.016 (0.974–1.060) |
DISCUSSION
In this cross-sectional study, we investigated the association between FQS and risk factors of MetS in adults with overweight and obesity in Iran. Our findings indicate that SBP, DBP, TC, and FBG were significantly lower among the subjects in the highest tertile of FQS. However, after adjustments for multiple variables, only TC remained significantly different. Furthermore, our results revealed that a higher FQS tertile was significantly associated with a lower risk of elevated SBP, DBP, FBG, TC, and LDL-C in a multivariable-adjusted model.
There is a paucity of research assessing the association between FQS and health outcomes, leading to a limited body of evidence exploring the relationship between MetS risk factors and FQS. In a cross-sectional research by Lavigne-Robichaud et al. [
18] which contradicts our findings, FQS and the risk of MetS were not observed to be significantly associated. Likewise, Darooghegi Mofrad et al. [
19], reported that FQS and risk factors for cardiovascular diseases were not significantly associated among 368 adult women. Regarding the positive health effects of FQS, Mozaffarian et al. [
29] found that a 4-year weight change was inversely associated with the healthy food components of FQS. Additionally, in a long-term follow-up, Fung et al. [
17] reported that higher FQS was related to a lesser chance of coronary artery disease compared to other diet-based indices such as the Dietary Approach to Stop Hypertension (DASH), alternative Mediterranean diet score, and Alternative Healthy Eating Index-2010. Furthermore, other studies showed that FQS is related to a lower risk of breast cancer [
20], lower levels of inflammatory biomarkers in young women [
21], and better mental health in women [
22].
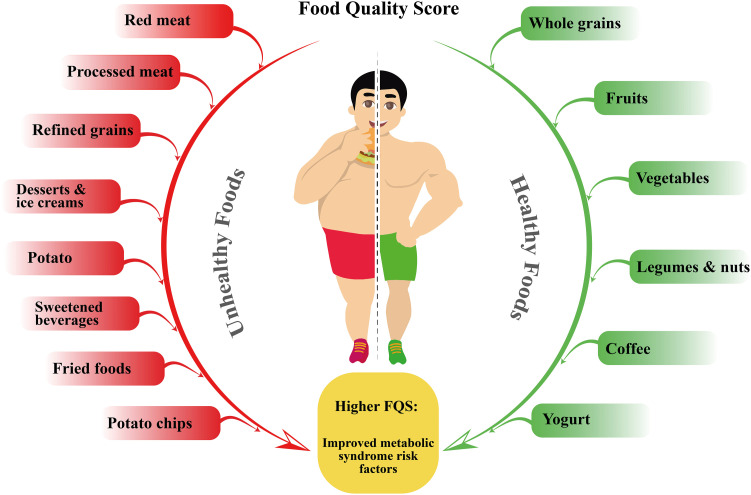
In this study, we discovered a significant relationship between an increased FQS and reduced odds of MetS risk factors (
Figure 1). In point of fact, a higher FQS with higher consumption of healthy foods and a lower intake of unhealthy foods indicates superior diet quality. Consistent with our findings, several studies reported that higher diet quality, represented by the DASH diet score, is related to a better status of MetS risk factors [
13,
30,
31,
32,
33,
34,
35,
36,
37]. Likewise, a population-based cohort study [
38] showed that a higher Mediterranean diet score, which indicates higher diet quality, is associated with a better lipid profile and lower blood pressure. In a meta-analysis of observational studies, Bakaloudi et al. [
39] found that a higher Mediterranean diet score can positively affect all MetS parameters.
Figure 1
Mechanistic pathways Summary of the association between FQS and risk of metabolic syndrome.
FQS, food quality score.

The positive effects of FQS on the risk factors of MetS can be explained by the effect of each component. As reported in
Table 3, consumption of whole grains, fruits, legumes, and nuts was higher in the third tertile of FQS. The high dietary fiber content of whole grains has been attributed to the multitude of health benefits associated with their consumption [
40]. An umbrella review of meta-analyses showed that dietary fiber is related to the improved status of SBP, DBP, TC, LDL-C, and FBG [
41]. Furthermore, the consumption of fruits and vegetables has been consistently associated with a decreased risk of MetS [
42]. Legumes and nuts, owing to their high concentration of monounsaturated fatty acids, polyunsaturated fatty acids, and bioactive compounds, can improve the serum lipid profile, glucose levels, and blood pressure [
43].
Moreover, the lower consumption of unhealthy foods, such as red and processed meat, refined grains, sugar-sweetened beverages, and potatoes, could explain the positive health effects of a higher FQS. Two meta-analysis studies reported that red and processed meat intake was associated with a higher risk of MetS [
44,
45]. Likewise, refined grains [
46] and sugar-sweetened beverages [
47] were also directly linked to a higher risk of MetS.
This cross-sectional study represents the initial attempt, to the best of our knowledge, to examine the relationship between FQS and risk factors of MetS. There are certain limitations to be aware of, though. Establishing a causal relationship between FQS and the odds of MetS risk factors is challenging due to the cross-sectional nature of the research. The dynamic nature of diet and MetS risk factors over time complicates the establishment of causality. Long-term evaluations of these factors would be beneficial in elucidating the causal relationship. Additionally, while FFQs are valuable tools for assessing long-term dietary intake, it is important to note that the data collected through FFQs may be influenced by recall bias. Moreover, dietary records might not always accurately represent dietary nutrient intake.
CONCLUSION
In conclusion, our findings demonstrate a significant association between the highest FQS tertile and a reduced risk of elevated SBP, DBP, FBG, TC, and LDL-C in a model adjusted for age, sex, and BMI. However, more experimental and longitudinal studies are warranted to obtain a holistic perception of the relationship between FQS and the risk factors of MetS.
Tabriz University of Medical Scienceshttps://doi.org/10.13039/501100004366
51534
NOTES
-
Funding: This study received financial support from a grant provided by Tabriz University of Medical Sciences (code: IR.TBZMED.REC.1401.1010, IR.TBZMED.REC.1398.460; grant number: 51534). It is important to note that the funders were not involved in formulating hypotheses, recruitment, or study design.
-
Conflict of Interest: The authors declare that they have no competing interests.
-
Availability of Data and Materials: The datasets created and/or examined during the present study are not publicly accessible in accordance with privacy and ethical considerations. However, these datasets can be made available upon reasonable request from the corresponding author.
-
Author Contributions:
Conceptualization: Abbasalizad Farhangi M.
Data curation: Abbasalizad Farhangi M.
Formal analysis: Abbasalizad Farhangi M.
Investigation: Abbasalizad Farhangi M.
Supervision: Abbasalizad Farhangi M.
Writing - original draft: Hojati A, Abbasalizad Farhangi M.
Writing - review & editing: Hojati A.
ACKNOWLEDGEMENTS
The authors express their sincere gratitude to all the study participants for their collaboration. Additionally, the authors extend their thanks to the Research Undersecretary of Tabriz University of Medical Sciences for their financial support (grant number: 51534).
REFERENCES
- 1. Minhas M, Murphy CM, Balodis IM, Samokhvalov AV, MacKillop J. Food addiction in a large community sample of Canadian adults: prevalence and relationship with obesity, body composition, quality of life and impulsivity. Addiction 2021;116:2870-2879.
- 2. Hruby A, Hu FB. The epidemiology of obesity: a big picture. Pharmacoeconomics 2015;33:673-689.
- 3. World Health Organization. Obesity and overweight. Geneva: World Health Organization; 2021, cited 2023 Aug 7. Available from: https://www.who.int/news-room/fact-sheets/detail/obesity-and-overweight
- 4. GBD 2015 Risk Factors Collaborators. Global, regional, and national comparative risk assessment of 79 behavioural, environmental and occupational, and metabolic risks or clusters of risks, 1990-2015: a systematic analysis for the Global Burden of Disease Study 2015. Lancet 2016;388:1659-1724.
- 5. Pérez-Galarza J, Baldeón L, Franco OH, Muka T, Drexhage HA, Voortman T, Freire WB. Prevalence of overweight and metabolic syndrome, and associated sociodemographic factors among adult Ecuadorian populations: the ENSANUT-ECU study. J Endocrinol Invest 2021;44:63-74.
- 6. Kassi E, Pervanidou P, Kaltsas G, Chrousos G. Metabolic syndrome: definitions and controversies. BMC Med 2011;9:48.
- 7. Cornier MA, Dabelea D, Hernandez TL, Lindstrom RC, Steig AJ, Stob NR, Van Pelt RE, Wang H, Eckel RH. The metabolic syndrome. Endocr Rev 2008;29:777-822.
- 8. Hsu CN, Hou CY, Hsu WH, Tain YL. Early-life origins of metabolic syndrome: mechanisms and preventive aspects. Int J Mol Sci 2021;22:11872.
- 9. Kaur J. Assessment and screening of the risk factors in metabolic syndrome. Med Sci (Basel) 2014;2:140-152.
- 10. Agodi A, Maugeri A, Kunzova S, Sochor O, Bauerova H, Kiacova N, Barchitta M, Vinciguerra M. Association of dietary patterns with metabolic syndrome: results from the Kardiovize Brno 2030 Study. Nutrients 2018;10:898.
- 11. Fabiani R, Naldini G, Chiavarini M. Dietary patterns and metabolic syndrome in adult subjects: a systematic review and meta-analysis. Nutrients 2019;11:2056.
- 12. Suliga E, Kozieł D, Cieśla E, Głuszek S. Association between dietary patterns and metabolic syndrome in individuals with normal weight: a cross-sectional study. Nutr J 2015;14:55.
- 13. Castro-Barquero S, Ruiz-León AM, Sierra-Pérez M, Estruch R, Casas R. Dietary strategies for metabolic syndrome: a comprehensive review. Nutrients 2020;12:2983.
- 14. Saraf-Bank S, Haghighatdoost F, Esmaillzadeh A, Larijani B, Azadbakht L. Adherence to Healthy Eating Index-2010 is inversely associated with metabolic syndrome and its features among Iranian adult women. Eur J Clin Nutr 2017;71:425-430.
- 15. Akhavanfar R, Hojati A, Kahrizi MS, Farhangi MA, Ardekani AM. Adherence to lifelines diet score and risk factors of metabolic syndrome among overweight and obese adults: a cross-sectional study. Front Nutr 2022;9:961468.
- 16. Nicklas TA, O’Neil CE, Fulgoni VL 3rd. Diet quality is inversely related to cardiovascular risk factors in adults. J Nutr 2012;142:2112-2118.
- 17. Fung TT, Pan A, Hou T, Mozaffarian D, Rexrode KM, Willett WC, Hu FB. Food quality score and the risk of coronary artery disease: a prospective analysis in 3 cohorts. Am J Clin Nutr 2016;104:65-72.
- 18. Lavigne-Robichaud M, Moubarac JC, Lantagne-Lopez S, Johnson-Down L, Batal M, Laouan Sidi EA, Lucas M. Diet quality indices in relation to metabolic syndrome in an Indigenous Cree (Eeyouch) population in northern Québec, Canada. Public Health Nutr 2018;21:172-180.
- 19. Darooghegi Mofrad M, Namazi N, Larijani B, Bellissimo N, Azadbakht L. The association of food quality score and cardiovascular diseases risk factors among women: a cross-sectional study. J Cardiovasc Thorac Res 2019;11:237-243.
- 20. Hosseini F, Shab-Bidar S, Ghanbari M, Majdi M, Sheikhhossein F, Imani H. Food quality score and risk of breast cancer among iranian women: findings from a case control study. Nutr Cancer 2022;74:1660-1669.
- 21. Bahrami A, Nikoomanesh F, Khorasanchi Z, Mohamadian M, Ferns GA. The relationship between food quality score with inflammatory biomarkers, and antioxidant capacity in young women. Physiol Rep 2023;11:e15590.
- 22. Darooghegi Mofrad M, Siassi F, Guilani B, Bellissimo N, Suitor K, Azadbakht L. The association of food quality index with mental health in women: a cross-sectional study. BMC Res Notes 2020;13:557.
- 23. Abbasalizad Farhangi M, Vajdi M, Nikniaz L, Nikniaz Z. The interaction between dietary inflammatory index and 6 P21 rs2010963 gene variants in metabolic syndrome. Eat Weight Disord 2020;25:1049-1060.
- 24. Abbasalizad Farhangi M, Vajdi M, Nikniaz L, Nikniaz Z. Interaction between vascular endothelial growth factor-A (rs2010963) gene polymorphisms and dietary diversity score on cardiovascular risk factors in patients with metabolic syndrome. Lifestyle Genom 2020;13:1-10.
- 25. Khodarahmi M, Asghari-Jafarabadi M, Abbasalizad Farhangi M. A structural equation modeling approach for the association of a healthy eating index with metabolic syndrome and cardio-metabolic risk factors among obese individuals. PLoS One 2019;14:e0219193.
- 26. Booth M. Assessment of physical activity: an international perspective. Res Q Exerc Sport 2000;71(Suppl 2):114-120.
- 27. Mirmiran P, Esfahani FH, Mehrabi Y, Hedayati M, Azizi F. Reliability and relative validity of an FFQ for nutrients in the Tehran lipid and glucose study. Public Health Nutr 2010;13:654-662.
- 28. Ghaffarpour M, Houshiar-Rad A, Kianfar H. The manual for household measures, cooking yields factors and edible portion of foods. Tehran: Keshavarzi Press; 1999, pp 42-58.
- 29. Mozaffarian D, Hao T, Rimm EB, Willett WC, Hu FB. Changes in diet and lifestyle and long-term weight gain in women and men. N Engl J Med 2011;364:2392-2404.
- 30. Akhlaghi M. Dietary Approaches to Stop Hypertension (DASH): potential mechanisms of action against risk factors of the metabolic syndrome. Nutr Res Rev 2020;33:1-18.
- 31. Azadbakht L, Mirmiran P, Esmaillzadeh A, Azizi T, Azizi F. Beneficial effects of a Dietary Approaches to Stop Hypertension eating plan on features of the metabolic syndrome. Diabetes Care 2005;28:2823-2831.
- 32. Farhadnejad H, Emamat H, Teymoori F, Tangestani H, Hekmatdoost A, Mirmiran P. Role of Dietary Approaches to Stop Hypertension diet in risk of metabolic syndrome: evidence from observational and interventional studies. Int J Prev Med 2021;12:24.
- 33. Ghorabi S, Salari-Moghaddam A, Daneshzad E, Sadeghi O, Azadbakht L, Djafarian K. Association between the DASH diet and metabolic syndrome components in Iranian adults. Diabetes Metab Syndr 2019;13:1699-1704.
- 34. Joyce BT, Wu D, Hou L, Dai Q, Castaneda SF, Gallo LC, Talavera GA, Sotres-Alvarez D, Van Horn L, Beasley JM, Khambaty T, Elfassy T, Zeng D, Mattei J, Corsino L, Daviglus ML. DASH diet and prevalent metabolic syndrome in the Hispanic Community Health Study/Study of Latinos. Prev Med Rep 2019;15:100950.
- 35. Konikowska K, Bombała W, Szuba A, Różańska D, Regulska-Ilow B. A high-quality diet, as measured by the DASH score, is associated with a lower risk of metabolic syndrome and visceral obesity. Biomedicines 2023;11:317.
- 36. Saneei P, Fallahi E, Barak F, Ghasemifard N, Keshteli AH, Yazdannik AR, Esmaillzadeh A. Adherence to the DASH diet and prevalence of the metabolic syndrome among Iranian women. Eur J Nutr 2015;54:421-428.
- 37. Siervo M, Lara J, Chowdhury S, Ashor A, Oggioni C, Mathers JC. Effects of the Dietary Approach to Stop Hypertension (DASH) diet on cardiovascular risk factors: a systematic review and meta-analysis. Br J Nutr 2015;113:1-15.
- 38. Tzima N, Pitsavos C, Panagiotakos DB, Skoumas J, Zampelas A, Chrysohoou C, Stefanadis C. Mediterranean diet and insulin sensitivity, lipid profile and blood pressure levels, in overweight and obese people; the Attica study. Lipids Health Dis 2007;6:22.
- 39. Bakaloudi DR, Chrysoula L, Kotzakioulafi E, Theodoridis X, Chourdakis M. Impact of the level of adherence to Mediterranean diet on the parameters of metabolic syndrome: a systematic review and meta-analysis of observational studies. Nutrients 2021;13:1514.
- 40. P NPV, Joye IJ. Dietary fibre from whole grains and their benefits on metabolic health. Nutrients 2020;12:3045.
- 41. Fu L, Zhang G, Qian S, Zhang Q, Tan M. Associations between dietary fiber intake and cardiovascular risk factors: an umbrella review of meta-analyses of randomized controlled trials. Front Nutr 2022;9:972399.
- 42. Tian Y, Su L, Wang J, Duan X, Jiang X. Fruit and vegetable consumption and risk of the metabolic syndrome: a meta-analysis. Public Health Nutr 2018;21:756-765.
- 43. Souza RG, Gomes AC, Naves MM, Mota JF. Nuts and legume seeds for cardiovascular risk reduction: scientific evidence and mechanisms of action. Nutr Rev 2015;73:335-347.
- 44. Guo H, Ding J, Liang J, Zhang Y. Association of red meat and poultry consumption with the risk of metabolic syndrome: a meta-analysis of prospective cohort studies. Front Nutr 2021;8:691848.
- 45. Kim Y, Je Y. Meat consumption and risk of metabolic syndrome: results from the Korean population and a meta-analysis of observational studies. Nutrients 2018;10:390.
- 46. Guo H, Ding J, Liang J, Zhang Y. Associations of whole grain and refined grain consumption with metabolic syndrome. a meta-analysis of observational studies. Front Nutr 2021;8:695620.
- 47. Malik VS, Popkin BM, Bray GA, Després JP, Willett WC, Hu FB. Sugar-sweetened beverages and risk of metabolic syndrome and type 2 diabetes: a meta-analysis. Diabetes Care 2010;33:2477-2483.