ABSTRACT
It is generally accepted that diet modification provides beneficial effects on the management of diabetes. In the present study, we evaluated the effects of diet modification on nutrient intake and quality of life in a large sample of diabetic patients. This study was conducted using data from the Korea National Health and Nutrition Examination Survey IV and V (2007-2010). A total of 2,484 of diabetic patients were included in the analysis. Then, we compared the overall quality of dietary intake between diabetic patients with diet modification and those without dietary modification. The result showed that subjects on diabetic diet (DDG) showed lower levels of total cholesterol, triglyceride, and AST before and after the adjustment for covariates (all p < 0.05). The results of nutrient assessment showed that DDG had lower intakes of total energy, fat, and carbohydrate (all p < 0.05), but higher intakes of energy from protein, vitamin B1, vitamin B2, niacin and vitamin C than NDG. (all p < 0.05). In addition, nutritional adequacy ratio of calcium and vitamin B2 were significantly higher in DDG than those in normal diet group (NDG) (p < 0.05). However, we observed no significant differences in quality of life between two groups. In conclusion, diet modification in diabetic patients seemed to be effective to improve blood lipid profile and the adequacy of nutrient intake without sacrificing the quality of life.
-
Keywords: Diet modification; Diabetes; Meal quality; Quality of life
Introduction
Diabetes and its complications have become a major cause of morbidity and mortality in Korea [
1] of which the prevalence has increased from 8.6% in 2001 to 10.5% in 2012 [
2]. The increased prevalence is likely attributable to economic development, and a westernized lifestyle [
3]. The goals of management of diabetes are to restore glucose metabolism and to minimize chronic diabetic complications. Among the management of diabetes in order to achieve the goals, dietary therapy has been high-lightened ranging from nutritional balancing to ambulatory diet care [
4,
5,
6].
It is generally accepted that diet modification provides beneficial effects on metabolic parameter, including blood glucose, blood lipids, blood pressure, and body weight [
7,
8]. A meta-analysis of prospective studies has demonstrated a 20% reduced risk of future type 2 diabetes through the healthy diets [
9]. In addition, clinical trials have reported that diet modification including high consumption of fruit and vegetables, caloric restriction, and consumption of lower glycemic index/glycemic load decreased the levels of hemoglobinA1c (HbA1c) of type 1 and 2 diabetes [
10,
11]. Also, several observational studies have shown that diet modification improved glycemic control [
12,
13], insulin resistance [
14] and reduced risk of cardiovascular disease and overall mortality in diabetic patients [
15].
Despite the beneficial effects of diet modification in diabetes, it has been challenged because of lack of dietary compliance in general practice [
16,
17]. Indeed, lack of dietary compliance was considered as a major limiting factor in achieving glycemic control in type 2 diabetes in clinical settings [
18]. Also, lack of knowledge and understanding of the diet plan was reported to be the highest ranked barrier in the diabetic patients with diet consultation by a nutritionist [
19]. Since dietary recommendations often require diabetic patients to alter behaviors that have been present for a lifetime, and are based upon strong preferences [
20], it can greatly impair their quality of life which is associated with the discontinuation of therapy [
21]. Earlier studies have focused on the prevention of complications and glycemic control of diabetes through diet modification [
22,
23], however, there is limited information on the associations with dietary behavior and nutrient adequacy in Korean diabetic patients and the patients' views of the burden of self-management and life satisfaction due to diet modification in this population [
24].
The aim of this study is to compare the overall quality of dietary intake between diabetic patients with diet modification and those without. Furthermore, we compared patients' views of the burdens of diet modification by examining the quality of life.
Materials and Methods
Study population
This study was based on data from the Korea National Health and Nutrition Examination Survey (KNHANES) IV and V (2007-2010). Details of the KNHANES are available [
25]. The KNHANES is a cross-sectional survey conducted nationwide by a Ministry of Health and Welfare. The KNHANES is composed of the following three sections: a health interview, health examination, and nutrition survey. A nationally representative sample was chosen from the Korean population using household records that were provided by the 2005 Population and Housing Census in Korea. Twenty households were selected from each survey section using a stratified, multistage probability cluster sampling method that considers each participant's geographical area, age, and sex. In the KNHANES IV (2007-2009) and V (2010-2011), 42,347 individuals participated in the examination (response rate: higher than 80% for age ≥ 1 year). Among the participants, we limited our analyses to adults who over 20 years of age and who was diagnosed with diabetes. Subjects who practice the diet due to other complications or illness were excluded. We also excluded subjects with missing data for diabetes diagnosis, diet status, and nutrient intake. Finally, 2,484 subjects were included in the statistical analysis. The institutional review board of the Centers for Disease Control and Prevention in Korea approved the KNHANES. All the participants in the survey provided informed written consent.
We obtained data from KNHANES IV and V, including demographic, anthropometric, and biochemical measurement data. Trained experts obtained anthropometric measurements by following standardized protocols. The body weights and heights of the subjects were measured to the nearest 0.1 kg and 0.1 cm, respectively. Body mass index (BMI) was calculated as weight (kg)/height squared (m2). Waist circumference was measured on the area between the rib cage and the iliac crest to the nearest 0.1 cm. Systolic blood pressure (SBP) and diastolic blood pressure (DBP) were measured by mercury sphyngmomanometer (Baumanometer, NY, USA) on the right arm. Demographic variables that were potential confounders included age, education, monthly income, marital status, smoking, drinking, and exercise. Education level was divided into four categories as elementary school, middle school, high school, or university, according to the subject's highest achieved level. Monthly income was divided into quartiles and reported in the South Korean currency won as follows: lowest (≤ 1 million won; ≤ US $980), lower middle (1 million won ≤ 2 million won; US $980 ≤ $1,970), upper middle (2 million won ≤ 3 million won; $1,970 ≤ $2,950), or highest (> 3 million won; > $2,950). Marital status was divided into two groups of single or married based on questionnaire responses. Subjects who smoked during the survey period were regarded as current smokers, and the mean number of cigarette packs smoked per day was determined. Subjects who drink alcohol at least once a month considered current alcohol consumers. Physical exercise was divided into two categories, either as practice and do not practice, according to whether or not the individual participated in any of the following at least 5 days within each week: intense physical activity for at least 20 minutes, moderate physical activity for at least 30 minutes, or walking for at least 30 minutes.
Biochemical measurements
To assess serum levels of biochemical markers, blood samples were collected through an antecubital vein after 10-12 hour of fasting. Serum levels of insulin (µIU/mL) were measured by an immunoradiometric assay using a 1,470 Wizard Gamma Counter (PerkinElmer, Turku, Finland). Hemoblobin A1c (HbA1c) level was measured with high performance liquid chromatography-723G7 (Tosoh, Tokyo, Japan). Serum levels of fasting glucose (mg/L), total cholesterol (mg/dL), triglyceride (mg/dL), high density lipoprotein (HDL) cholesterol (mg/dL), low density lipoprotein (LDL) cholesterol, aspartate aminotransferase (AST) (IU/L), and alanine aminotransferase (ALT) (IU/L) were measured using a Hitachi Automatic Analyser 7,600 (Hitachi, Tokyo, Japan).
Dietary assessment
Nutrient intake data were obtained from the section of the nutrition survey in the KNHANES (IV-V). Food content and consumed amounts were obtained by the 24-hour recall method; then, the nutrient intake was analyzed using the database from the food composition table made by the Rural Development Administration [
26]. Nutrient intake data include total energy (kcal), carbohydrate (g), protein (g), fat (g), fiber (g), calcium (mg), phosphorous (mg), iron (mg), sodium (mg), potassium (mg), vitamin A (ug RE), vitamin B1 (mg), vitamin B2 (mg), niacin (mg NE), and vitamin C (mg). The ratio of energy intake from each macronutrient to total energy was calculated: percentage of energy intake from carbohydrate (%), percentage of energy intake from fat (%), and percentage of energy intake from protein (%). The intake of other nutrients was also calculated as a value per 1000 calories. Nutrient adequacy ratios (NARs) for 10 selected nutrients (i.e., protein, calcium, iron, fiber, vitamins A, B1, B2, and C, niacin and potassium) were calculated as the percent of the age/gender-specific Recommended Nutrient Intake (RNI) or Adequate Intake (AI) [
27]. NARs were truncated at 1 if the value was over the RNI or AI; values were then averaged for the 10 nutrients to obtain the mean adequacy ratio (MAR).
The psychological health data were obtained from a selfreported mental health questionnaire under the supervision of investigator, which was a section of the health interview. Perceived stress was defined as feeling significant stress in everyday life. Depressive symptoms included feeling sad or despair continuously for > 2 weeks and enough to interfere with daily life during the last year. Suicide ideation was determined by a "yes" or "no" if they had suicidal thoughts. Self-administered questionnaires were used to gather information about disabilities and health conditions. The EQ-5D is a self-reported questionnaire widely used to determine the quality of life of a general population [
28]. The Korean EQ-5D was also developed according to the recommended procedure by the EQ group. The EQ-5D consists of 5 questions evaluating a respondent's current health status in terms of exercise ability, self-management, daily activities, pain/discomfort, and anxiety/depression. In each dimension, a respondent can belong to 1 of 3 categories, and these are classified into "no problems" and "problems," including moderate to severe problems.
Statistical analyses were performed using SPSS version 21.0 (SPSS, Inc., Chicago, IL, USA). Continuous variables were described as means ± standard error, and categorical variables were expressed as percentage of subject. Subjects were divided into two groups according to whether they were on a diabetic diet or not; "diabetic diet" or "normal diet". We compared means of biochemical parameters and nutrient intake according to diet therapy status. Differences in the groups of diet therapy were determined using a general linear model followed by the post hoc with Bonferroni method with and without adjustment for covariates. All analyses were performed after normal distribution test. For all analyses, p-values < 0.05 were considered as significant.
Results
Basic characteristics of study population
The mean age of the total study population was 63.9 ± 0.2 years (range, 21-93 years), and 45.7% of the total subjects were on a diabetic diet (
Table 1). Diabetic diet group (DDG) had higher percentage of female, and high-income bracket (all p < 0.05) compared with normal diet group (NDG). In addition, the subjects in DDG were more likely to exercise, and had lower percentage of current smokers and alcohol consumers (all p < 0.01). The duration of diabetes was relatively longer in the DDG (p < 0.001).
The subjects with diabetic diet (DDG) showed lower levels of total cholesterol, triglyceride, and AST before and after adjustment for sex, income, drinking status, smoking and duration of diabetes (all p < 0.05). In addition, differences in HbA1c levels were observed between the groups, however, the significances disappeared after adjustment (
Table 2).
Based on the differences in biochemical measurements, we decided to compare the nutrient intakes between NDG and DDG (
Table 3). DDG had lower levels of energy from carbohydrate and lower intakes of carbohydrate (p < 0.05 for all). In addition, DDG had higher levels of energy from protein and fat, fat, Ca/P, vitamin B1, vitamin B2, and niacin before and after adjustment (p < 0.05 for all). Furthermore, to evaluate the meal quality, we compared NAR and MAR between DDG and NDG (
Table 4). Nutrients which had an average NAR of at least 100% were protein, iron, vitamin A, vitamin B1, vitamin C, and niacin in the both groups. The NAR of calcium was significantly higher in DDG than those in NDG before and after adjustment (p < 0.05), albeit didn't reach the recommended values. NAR of energy value was lower in DDG after adjustment for confounders (p < 0.05).
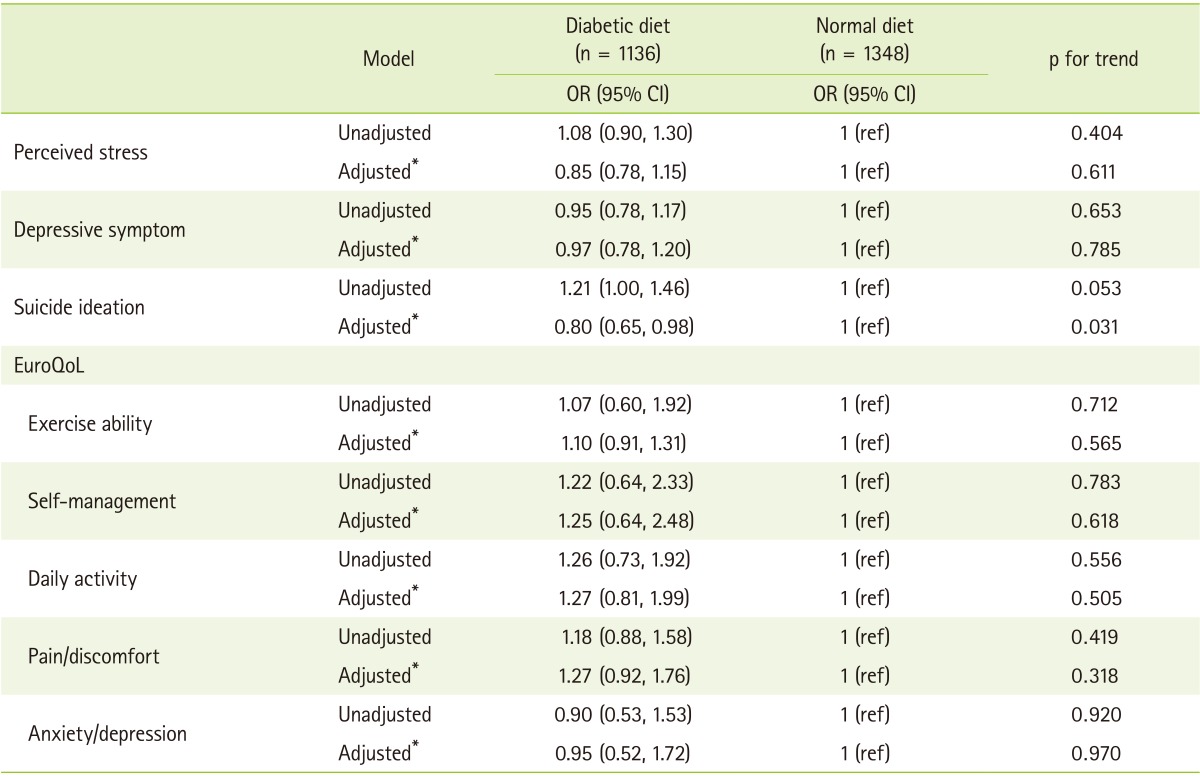
The ORs for quality of life and mental health were examined (
Table 5). The ORs for the mental health, which included perceived stress, and depressive symptoms were not significantly different in any models. The ORs for suicide ideation were slightly lower in DDG in unadjusted model, whereas significantly lower in DDG in adjusted model (OR, 0.80; 95% CI, 0.65-0.98). Diabetic diet was not associated with patient's quality of life before and after adjustment.
Discussion
In the present study, we evaluated the effects of diet modification on biochemical measurements, nutrient intake, and quality of life in a large sample of diabetic patients. The results showed that the implementation of diet modification had beneficial clinical effects and adequate nutrient intakes in diabetic patients. Several previous studies have reported that diabetic diet shows beneficial effects on metabolic status [
29,
30]. For example, Czyżewska-Majchrzak et al. observed that nutrition intervention reduces or preserves the desired levels of total cholesterol [
29]. Another intervention study demonstrated that dietary therapy led to improve lipid control [
30]. In the present study, subjects in DDG showed significantly lower plasma levels of total cholesterol and triglyceride before and after adjustment compared with those in NDG. In accordance with previous studies [
31,
32], our results also found that dietary modification is associated with the change in AST [
33]. These results implicated that dietary modification in diabetic patients might contribute to the reduce risk of diabetic complications, such as cardiovascular disease and liver dysfunction.
Nutrition care has been inconsistently reported to be associated with the controls of glucose metabolism [
10,
34,
35,
36,
37,
38]. It was demonstrated that control of nutrient intake improves fasting blood glucose (FBG) and HbA1c levels [
10,
34]. In contrast, no association with glycemic control by diet modification was observed [
35], which is similar to our results in this study. Furthermore, one study reported that 12 weeks of diet modification unexpectedly aggravates FBG [
36]. This controversy might be attributable to variance of study design and characteristics of population regarding disease duration and medication status. Previous studies have indicated that longer duration of diabetes was associated with poor glycemic control [
37,
38]. In line with this evidence, null effect of diabetic diet on glycemic control in current study is presumably due to the duration of diabetes.
With regard to dietary assessment, DDG had lower intakes of total energy and adequate ratio in macronutrient, which almost met the dietary guideline for diabetic patients recommended by the Korean Diabetes Association; daily energy intake of 50-60% from carbohydrate, 15-20% from protein, and less than 25% from fat [
39]. As reduced energy intake has marked effects on glycemic control [
40,
41] in addition to the favorable effects of a diet low in carbohydrate and high in protein content on glucose homeostasis [
42,
43], these dietary patterns might be associated with better metabolic status in DDG. It was reported that adequate calcium intake reduces the incidence of osteoporosis especially in older subjects with diabetes, who were exposed to higher risk of fracture compared with non-diabetics [
44]. It is also well-known that vitamin B complex is related to insulin resistance and glucose metabolism [
45]. Indeed, the status of vitamin B1, B2 and niacin were negatively correlated with homeostatic model assessment for insulin resistance (HOMA IR), triglyceride, and total cholesterol levels [
46,
47]. In the present study, DDG showed significantly higher intakes of several micronutrients such as calcium, vitamin B1, B2, and niacin than those in NDG, indicating the need for management to restore carbohydrate metabolism and diabetic complications in these subjects.
Despite beneficial effects of diet modification, it holds great burden for the patients. This burden can greatly impair their quality of life (QoL) and leads to failure for the modification [
48]. To prevent discontinuation, assessment of QoL is needed to deal with the problems regarding the dietary modification. In the present study, we observed no significant differences in QoL among two groups, suggesting that diet modification is not significant determinant for QoL of Korean diabetic patients. Furthermore, DDG seems to have favorable mental status regarding suicide ideation compared with that in NDG. Our results implicated that diet modification brings positive effects on lipid control and nutrient intake without affecting the QoL of patients. On the other hand, previous studies have provided conflicting data that diet restrictions have a great influence on the patients' QoL, with positive or negative effect [
19,
49,
50]. Accordingly, determination of the QoL appears to be of great interests, especially in order to prevent discontinuation of diet modification in diabetic patients.
Our study has several limitations. First, this study was cross-sectional; therefore, a causal relationship could not be fully determined. However, "reverse causation" is an unlikely explanation for the main findings since individuals developing worse metabolic status would choose healthier diet. Second, the data related to nutritional factors were self-reported including adherence to diet modification. It is important to distinguish modification performed under controlled feeding conditions from those that use standard diet. Furthermore, although diet education support was considered that improving adherence of diet modification, no indicators regarding glycemic control and QoL exist in the KNHANES. Further study is required for evaluating the effect of dietary modification with the assessment of compliance for therapy and experience of additional training such as diet education.
Despite of these limitations, several strengths should be noted in this study. First, we analyzed a large scale dataset, which provided statistical power to explore the association between diet modification and health outcome in Korean diabetic patients. Second, instead of single outcome, we examined various health status, including metabolic status, nutrient adequacy, and QoL for the first time in Korea. Strength of our study can provide insight toward the promotion of achieving and maintaining diet modification.
In conclusion, diet modification in diabetic patients is effective for improving blood lipid control and nutrients intake, without sacrificing the QoL. Ongoing nutrition education for self-management and monitoring are needed to ensure successful diabetes care.
Acknowledgements
The authors would like to thank all staff members who were involved in conducting the study.
REFERENCES
- 1. Statistics Korea. 2012 statistical results about cause of death. Daejeon: Statistics Korea; 2013.
- 2. Ministry of Health and Welfare. Korea Centers for Disease Control and Prevention. Korea Health Statistics 2011: Korea National Health and Nutrition Examination Survey (KNHANES V-2). Cheongwon: Korea Centers for Disease Control and Prevent; 2012.
- 3. Kim DJ. The epidemiology of diabetes in Korea. Diabetes Metab J 2011;35:303-308.
- 4. Salmerón J, Manson JE, Stampfer MJ, Colditz GA, Wing AL, Willett WC. Dietary fiber, glycemic load, and risk of non-insulin-dependent diabetes mellitus in women. JAMA 1997;277:472-477.
- 5. Khazrai YM, Defeudis G, Pozzilli P. Effect of diet on type 2 diabetes mellitus: a review. Diabetes Metab Res Rev 2014;30(Suppl 1):24-33.
- 6. Burger KN, Beulens JW, van der Schouw YT, Sluijs I, Spijkerman AM, Sluik D, Boeing H, Kaaks R, Teucher B, Dethlefsen C, Overvad K, Tjønneland A, Kyrø C, Barricarte A, Bendinelli B, Krogh V, Tumino R, Sacerdote C, Mattiello A, Nilsson PM, Orho-Melander M, Rolandsson O, Huerta JM, Crowe F, Allen N, Nöthlings U. Dietary fiber, carbohydrate quality and quantity, and mortality risk of individuals with diabetes mellitus. PLoS One 2012;7:e43127.
- 7. Thomas DE, Elliott EJ. The use of low-glycaemic index diets in diabetes control. Br J Nutr 2010;104:797-802.
- 8. Pastors JG, Hope W, Anne D, Marion F, Karmeen K. The evidence for the effectiveness of medical nutrition therapy in diabetes management. Diabetes Care 2002;25:608-613.
- 9. Esposito K, Chiodini P, Maiorino MI, Bellastella G, Panagiotakos D, Giugliano D. Which diet for prevention of type 2 diabetes? A meta-analysis of prospective studies. Endocrine 2014;Forthcoming.
- 10. Franz MJ, Monk A, Barry B, McClain K, Weaver T, Cooper N, Upham P, Bergenstal R, Mazze RS. Effectiveness of medical nutrition therapy provided by dietitians in the management of non-insulin-dependent diabetes mellitus: a randomized, controlled clinical trial. J Am Diet Assoc 1995;95:1009-1017.
- 11. Kulkarni K, Castle G, Gregory R, Holmes A, Leontos C, Powers M, Snetselaar L, Splett P, Wylie-Rosett J. The Diabetes Care and Education Dietetic Practice Group. Nutrition practice guidelines for type 1 diabetes mellitus positively affect dietitian practices and patient outcomes. J Am Diet Assoc 1998;98:62-70.
- 12. Livesey G, Taylor R, Hulshof T, Howlett J. Glycemic response and health--a systematic review and meta-analysis: relations between dietary glycemic properties and health outcomes. Am J Clin Nutr 2008;87:258S-268S.
- 13. Barclay AW, Petocz P, McMillan-Price J, Flood VM, Prvan T, Mitchell P, Brand-Miller JC. Glycemic index, glycemic load, and chronic disease risk--a meta-analysis of observational studies. Am J Clin Nutr 2008;87:627-637.
- 14. Kahleova H, Matoulek M, Malinska H, Oliyarnik O, Kazdova L, Neskudla T, Skoch A, Hajek M, Hill M, Kahle M, Pelikanova T. Vegetarian diet improves insulin resistance and oxidative stress markers more than conventional diet in subjects with Type 2 diabetes. Diabet Med 2011;28:549-559.
- 15. He M, van Dam RM, Rimm E, Hu FB, Qi L. Whole-grain, cereal fiber, bran, and germ intake and the risks of all-cause and cardiovascular disease-specific mortality among women with type 2 diabetes mellitus. Circulation 2010;121:2162-2168.
- 16. Vijan S, Stuart NS, Fitzgerald JT, Ronis DL, Hayward RA, Slater S, Hofer TP. Barriers to following dietary recommendations in Type 2 diabetes. Diabet Med 2005;22:32-38.
- 17. Williamson AR, Hunt AE, Pope JF, Tolman NM. Recommendations of dietitians for overcoming barriers to dietary adherence in individuals with diabetes. Diabetes Educ 2000;26:272-279.
- 18. Al-Kaabi J, Al-Maskari F, Saadi H, Afandi B, Parkar H, Nagelkerke N. Assessment of dietary practice among diabetic patients in the United Arab Emirates. Rev Diabet Stud 2008;5:110-115.
- 19. Nagelkerk J, Reick K, Meengs L. Perceived barriers and effective strategies to diabetes self-management. J Adv Nurs 2006;54:151-158.
- 20. Anderson JW, Gustafson NJ. Adherence to high-carbohydrate, high-fiber diets. Diabetes Educ 1989;15:429-434.
- 21. Shide K, Takada Y, Nakashima A, Tsuji H, Wada K, Kuwabara A, Tanaka K, Inagaki N. Patients' perception on the nutritional therapy for diabetic nephropathy. Jpn Clin Med 2014;5:9-13.
- 22. American Diabetes Association. Bantle JP, Wylie-Rosett J, Albright AL, Apovian CM, Clark NG, Franz MJ, Hoogwerf BJ, Lichtenstein AH, Mayer-Davis E, Mooradian AD, Wheeler ML. Nutrition recommendations and interventions for diabetes: a position statement of the American Diabetes Association. Diabetes Care 2008;31(Suppl 1):S61-S78.
- 23. Brand-Miller J, Hayne S, Petocz P, Colagiuri S. Low-glycemic index diets in the management of diabetes: a meta-analysis of randomized controlled trials. Diabetes Care 2003;26:2261-2267.
- 24. Lee HS, Joo J, Choue R. Study on diet-related quality of life in online self-help diabetes mellitus patients who practice dietary regimen. Korean J Community Nutr 2011;16:136-144.
- 25. Kweon S, Kim Y, Jang MJ, Kim Y, Kim K, Choi S, Chun C, Khang YH, Oh K. Data resource profile: the Korea National Health and Nutrition Examination Survey (KNHANES). Int J Epidemiol 2014;43:69-77.
- 26. Rural Development Administration. Food composition table. 7th ed. Suwon: Rural Development Administration; 2007.
- 27. The Korean Nutrition Society. Dietary reference intakes for Koreans. Seoul: The Korean Nutrition Society; 2010.
- 28. Räsänen P, Roine E, Sintonen H, Semberg-Konttinen V, Ryynänen OP, Roine R. Use of quality-adjusted life years for the estimation of effectiveness of health care: a systematic literature review. Int J Technol Assess Health Care 2006;22:235-241.
- 29. Vitolins MZ, Anderson AM, Delahanty L, Raynor H, Miller GD, Mobley C, Reeves R, Yamamoto M, Champagne C, Wing RR, Mayer-Davis E;. Action for Health in Diabetes (Look AHEAD) trial: baseline evaluation of selected nutrients and food group intake. J Am Diet Assoc 2009;109:1367-1375.
- 30. Laitinen JH, Ahola IE, Sarkkinen ES, Winberg RL, Harmaakorpi-Iivonen PA, Uusitupa MI. Impact of intensified dietary therapy on energy and nutrient intakes and fatty acid composition of serum lipids in patients with recently diagnosed non-insulin-dependent diabetes mellitus. J Am Diet Assoc 1993;93:276-283.
- 31. Vozarova B, Stefan N, Lindsay RS, Saremi A, Pratley RE, Bogardus C, Tataranni PA. High alanine aminotransferase is associated with decreased hepatic insulin sensitivity and predicts the development of type 2 diabetes. Diabetes 2002;51:1889-1895.
- 32. Perry IJ, Wannamethee SG, Shaper AG. Prospective study of serum γ-glutamyltransferase and risk of NIDDM. Diabetes Care 1998;21:732-737.
- 33. Sreenivasa Baba C, Alexander G, Kalyani B, Pandey R, Rastogi S, Pandey A, Choudhuri G. Effect of exercise and dietary modification on serum aminotransferase levels in patients with nonalcoholic steatohepatitis. J Gastroenterol Hepatol 2006;21:191-198.
- 34. Tay J, Luscombe-Marsh ND, Thompson CH, Noakes M, Buckley JD, Wittert GA, Yancy WS Jr, Brinkworth GD. A very low carbohydrate, low saturated fat diet for type 2 diabetes management: A randomized trial. Diabetes Care 2014;Forthcoming.
- 35. Hackett AF, Court S, McCowen C, Parkin JM. Dietary variation in diabetics. Arch Dis Child 1988;63:794-798.
- 36. Barakatun Nisak MY, Ruzita AT, Norimah AK, Kamaruddin NA. Medical nutrition therapy administered by a dietitian yields favourable diabetes outcomes in individual with type 2 diabetes mellitus. Med J Malaysia 2013;68:18-23.
- 37. Austin S, Senécal C, Guay F, Nouwen A. Effects of gender, age, and diabetes duration on dietary self-care in adolescents with type 1 diabetes: a Self-Determination Theory perspective. J Health Psychol 2011;16:917-928.
- 38. Davison KA, Negrato CA, Cobas R, Matheus A, Tannus L, Palma CS, Japiassu L, Carneiro JR, Rodacki M, Zajdenverg L, Araújo NB, Cordeiro MM, Luescher JL, Berardo RS, Nery M, Cani C, do Carmo A Marques M, Calliari LE, Noronha RM, Manna TD, Savoldelli R, Penha FG, Foss MC, Foss-Freitas MC, de Fatima Guedes M, Dib SA, Dualib P, Silva SC, Sepúlveda J, Sampaio E, Rea RR, Faria AC, Tschiedel B, Lavigne S, Cardozo GA, Pires AC, Robles FC, Azevedo M, Canani LH, Zucatti AT, Coral MH, Pereira DA, Araujo LA, Pedrosa HC, Tolentino M, Prado FA, Rassi N, Araujo LB, Fonseca RM, Guedes AD, Mattos OS, Faria M, Azulay R, Forti AC, Façanha CF, Montenegro R Jr, Montenegro AP, Melo NH, Rezende KF, Ramos A, Felicio JS, Santos FM, Jezini DL, Gomes MB. Brazilian Type 1 Diabetes Study Group (BrazDiab1SG). Relationship between adherence to diet, glycemic control and cardiovascular risk factors in patients with type 1 diabetes: a nationwide survey in Brazil. Nutr J 2014;13:19.
- 39. Sargrad KR, Homko C, Mozzoli M, Boden G. Effect of high protein vs high carbohydrate intake on insulin sensitivity, body weight, hemoglobin A1c, and blood pressure in patients with type 2 diabetes mellitus. J Am Diet Assoc 2005;105:573-580.
- 40. Brinkworth GD, Noakes M, Keogh JB, Luscombe ND, Wittert GA, Clifton PM. Long-term effects of a high-protein, low-carbohydrate diet on weight control and cardiovascular risk markers in obese hyperinsulinemic subjects. Int J Obes Relat Metab Disord 2004;28:661-670.
- 41. Promintzer M, Krebs M. Effects of dietary protein on glucose homeostasis. Curr Opin Clin Nutr Metab Care 2006;9:463-468.
- 42. Tremblay F, Lavigne C, Jacques H, Marette A. Role of dietary proteins and amino acids in the pathogenesis of insulin resistance. Annu Rev Nutr 2007;27:293-310.
- 43. Schwartz AV, Sellmeyer DE, Ensrud KE, Cauley JA, Tabor HK, Schreiner PJ, Jamal SA, Black DM, Cummings SR. Study of Osteoporotic Features Research Group. Older women with diabetes have an increased risk of fracture: a prospective study. J Clin Endocrinol Metab 2001;86:32-38.
- 44. Mahalle N, Kulkarni MV, Naik SS, Garg MK. Association of dietary factors with insulin resistance and inflammatory markers in subjects with diabetes mellitus and coronary artery disease in Indian population. J Diabetes Complications 2014;28:536-541.
- 45. Hooper PL, Hooper EM, Hunt WC, Garry PJ, Goodwin JS. Vitamins, lipids and lipoproteins in a healthy elderly population. Int J Vitam Nutr Res 1983;53:412-419.
- 46. Thornalley PJ. The potential role of thiamine (vitamin B1) in diabetic complications. Curr Diabetes Rev 2005;1:287-298.
- 47. Rabbani N, Thornalley PJ. Emerging role of thiamine therapy for prevention and treatment of early-stage diabetic nephropathy. Diabetes Obes Metab 2011;13:577-583.
- 48. Rubin RR, Peyrot M. Psychological issues and treatments for people with diabetes. J Clin Psychol 2001;57:457-478.
- 49. Bradley C, Speight J. Patient perceptions of diabetes and diabetes therapy: assessing quality of life. Diabetes Metab Res Rev 2002;18(Suppl 3):S64-S69.
- 50. Korean Diabetes Association. Treatment guideline for diabetes. 3rd ed. Seoul: Korean Diabetes Association; 2013.
Table 1Characteristics of the subjects
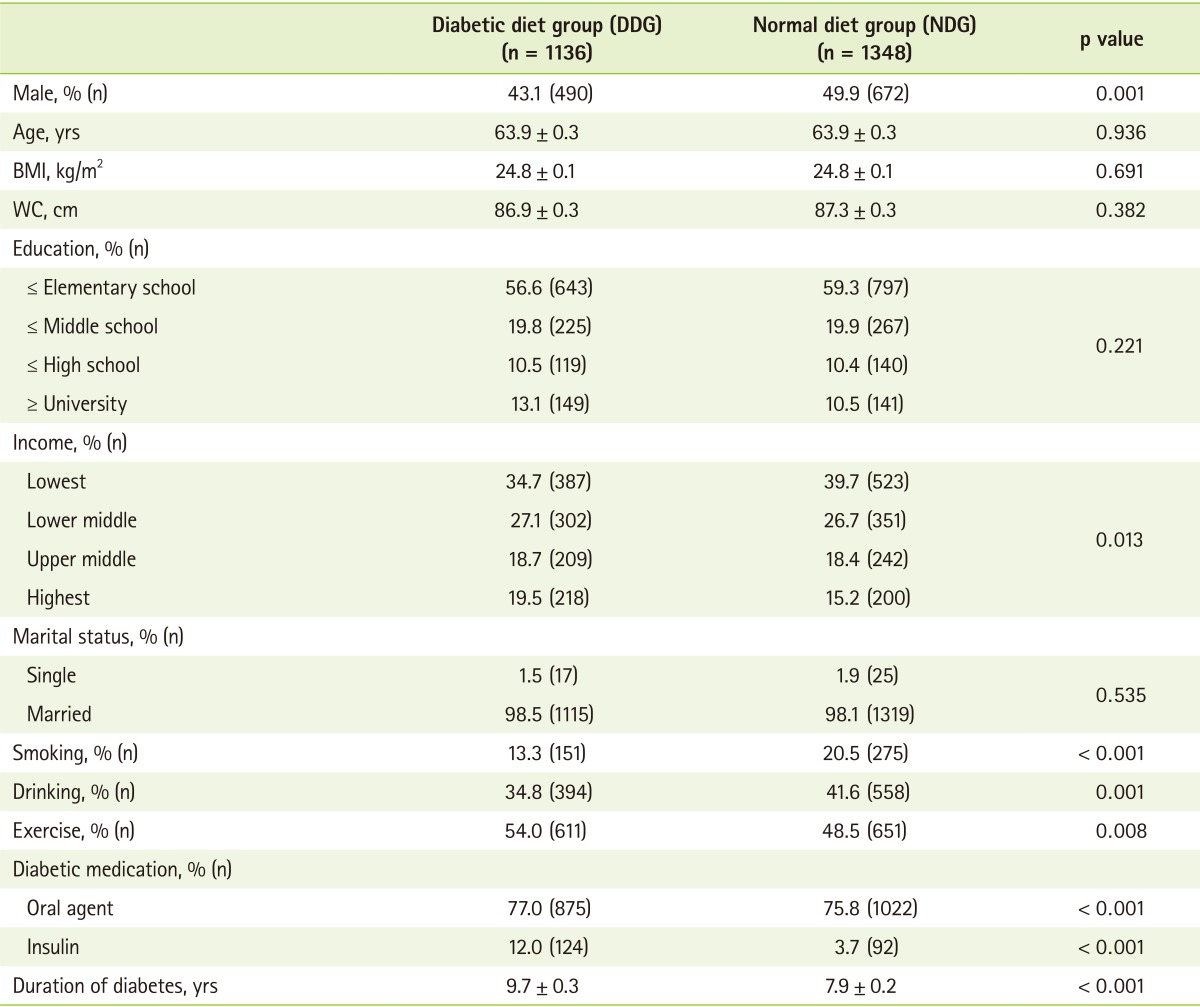
Table 2Blood pressure and biochemical markers of study subjects
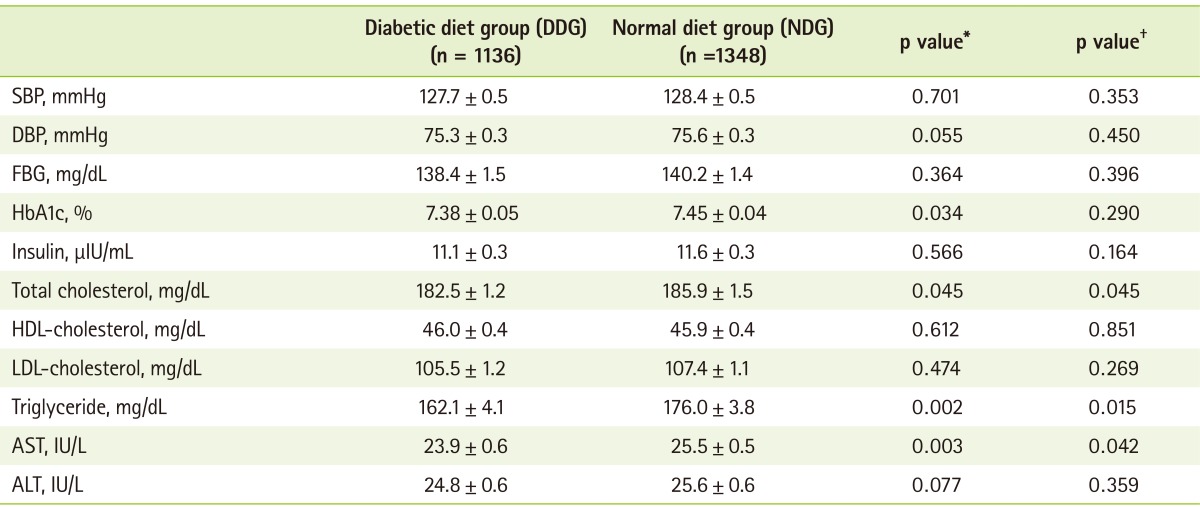
Table 3The nutrients intakes of study subjects
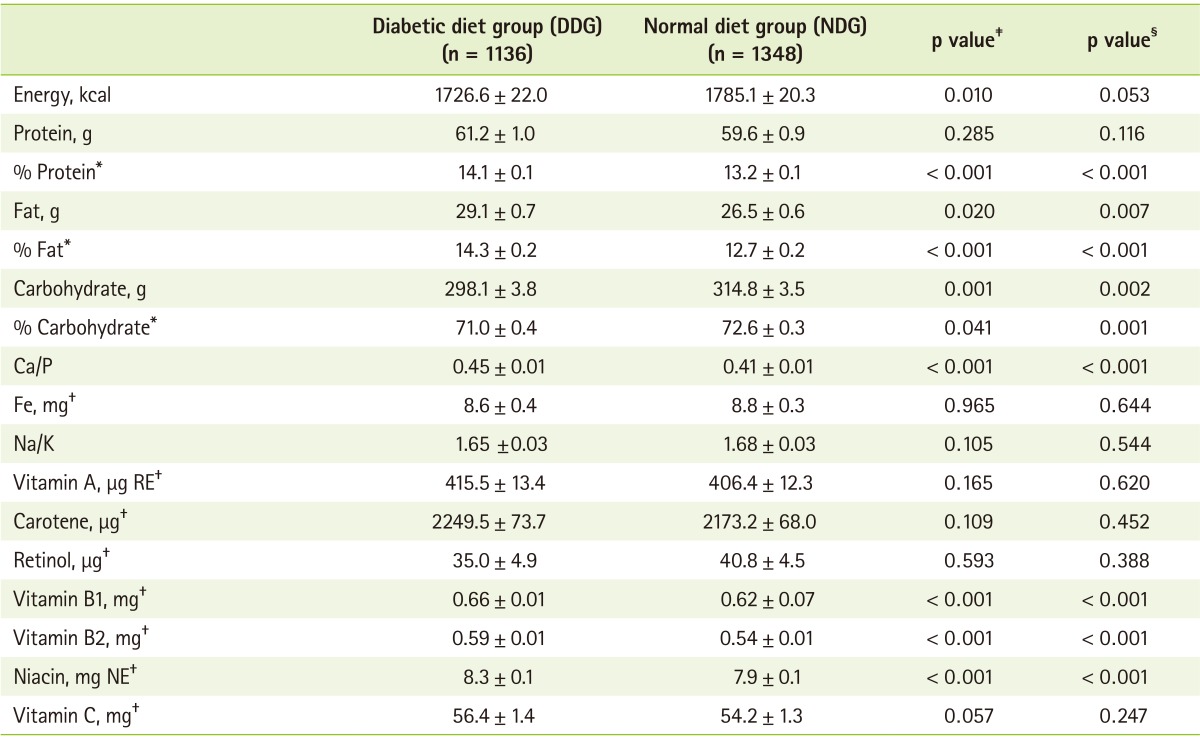
Table 4The nutrients adequacy ratio (NAR) and mean adequacy ratio (MAR) of study subjects
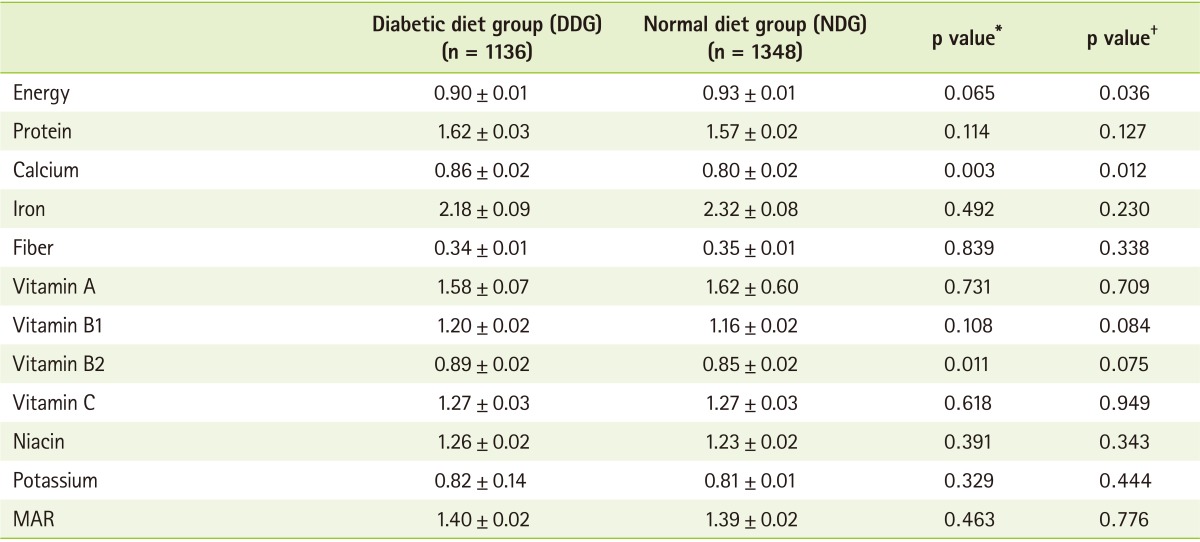
Table 5Association between diet therapy and quality of life