ABSTRACT
This study compared the effects of 12 weeks of intensive nutrition education (IE) using the 5A's behavioral change model and basic nutrition education (BE) on nutritional knowledge and nutrient intake among Korean adolescent athletes. This study included elite adolescent athletes (IE group: n = 65, BE group: n = 65) at a physical education high school in Seoul. In this prospective, randomized, controlled trial, the athletes' body composition, nutritional knowledge, nutrient intake, and self-management practices were evaluated at the beginning and end of the intervention. Both groups had increased levels of nutrition knowledge between pre- and post-test, but the change in total score for nutrition knowledge was significantly higher in the IE group than in the BE group (p < 0.001). Energy intake post-test increased significantly in the IE group (from 2,185 to 2,651 kcal/day, p < 0.001) but not in the BE group. The intake of carbohydrates, protein, and fat also increased significantly in the IE group (carbohydrates: from 298 to 352 g/day, protein: from 86 to 106 g/day, fat: from 71 to 88 g/day, all p < 0.001), but the change in the BE group was not significant. Additionally, the IE group showed a significant overall increase in vitamins and minerals compared to the BE group at post-test. Adolescent athletes in the IE group showed improved nutritional knowledge and intake compared to those in the BE group 12 weeks after the intervention.
-
Keywords: Athletes; Energy intake; Health education; Nutritional status
INTRODUCTION
Strategies for healthy nutrition can help athletes improve exercise performance [
1]. A healthy, balanced diet for adolescent athletes plays an important role in meeting nutritional needs for growth, health promotion, and athletic performance [
2]. Despite understanding the importance of nutrition, many athletes’ diets do not meet recommendations for sports nutrition and general health [
3].
Athletes are increasingly interested in sports nutrition to improve performance in high-level sports competitions [
4]. Although the importance of nutrition education is emphasized by international sporting organizations, the effects of nutrition education on adolescent athletes have not been well studied [
2,
5]. A systematic review acknowledged the lack of nutrition knowledge among adult and adolescent athletes [
6]. Nutrition education for adolescent athletes is necessary because the eating habits and behaviors that develop during adolescence generally continue into adulthood [
7].
Exercise performance is optimized by increasing lean muscle, reducing body fat, and consuming adequate fuel before, during, and after training and competition [
8]. To optimize athletic performance, athletes need to know how to consume a healthy and balanced diet, including the timing of food intake, and to apply sports nutrition strategies during training and competitions [
1]. Furthermore, nutrition education programs for athletes must be designed to improve nutrient intake, health, and nutrition knowledge to enhance performance [
9]. Moreover, adolescent athletes generally require more energy intake than non-athletes. Despite this need, many athletes attempt to lose weight by limiting energy intake or skipping meals [
10].
The 5A's (Assess, Advise, Agree, Assist, and Arrange) model, which was originally developed as a smoking cessation program, is a counseling technique with verified effectiveness in weight control programs [
11]. Given that optimal weight control and nutrient intake are crucial for enhancing athletic performance, there has been limited exploration of nutrition counseling techniques specifically tailored for adolescent athletes [
12]. Therefore, we evaluated whether 12 weeks of intensive nutrition education (IE) applying the 5A's behavior change model improved the nutritional knowledge, nutrient intake, and self-management practices of adolescent athletes in South Korea.
MATERIALS AND METHODS
Participants and study design
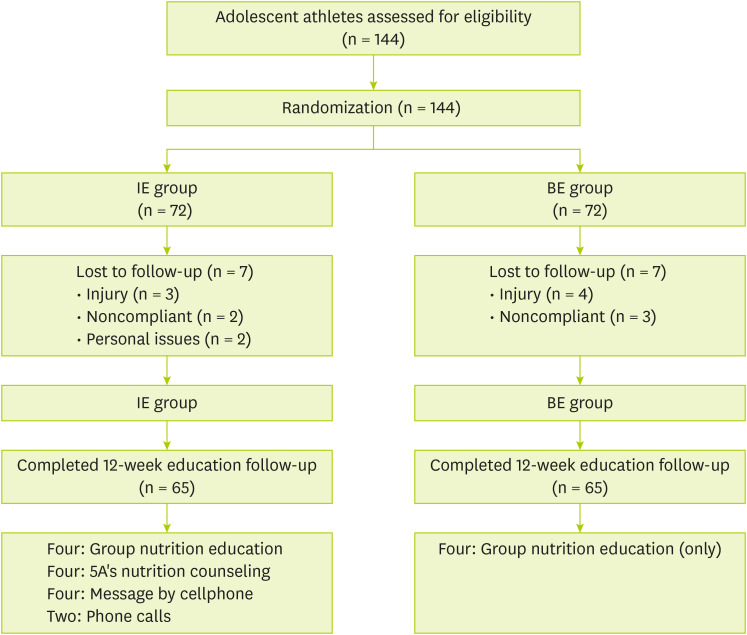
This prospective, controlled clinical trial was conducted at a high school in Seoul, South Korea, from May to September 2018. The participants were 144 adolescent athletes (16–18 years; boys: 86, girls: 58). The inclusion criteria were adolescent athlete training for sports competitions, agreeing to participate in the study, and voluntarily signing written consent. The exclusion criteria were not currently exercising due to injury, disease, or a history of illness or who participated in a nutrition education program within 3 months of the study.
Participants were divided into two groups. The IE group received four sessions of group nutrition education, four face-to-face meetings (approximately 20 minutes each) with an expert who applied the behavior change model of the 5A’s, four mobile messages, and two phone calls. The basic nutrition education (BE) group received only four sessions of group nutrition education.
During the intervention, 14 participants withdrew due to injury, noncompliance, transfer, or study schedules. Therefore, data from 130 participants (65 each in the IE and BE groups) were analyzed. At the beginning and end of the study, anthropometric characteristics, nutritional knowledge, nutrient intake, and self-management practices were surveyed.
Figure 1 presents a flow chart of the participants. All the athletes provided written consent, including legal representatives. This study was approved by the Institutional Review Board (IRB) under expedited review (IRB number: IRB-18-006), and written consent was obtained from all participants.
Figure 1
Flow chart of participants of the study.
IE, intensive nutrition education; BE, basic nutrition education.

Nutrition intervention process
The nutritional interventions differed between groups. The BE group received only group nutrition education at 1, 4, 7, and 11 weeks. Nutrition experts designed and developed four topics and 16 content areas for group nutrition education. This curriculum used “The Performance Nutrition Curriculum,” which was developed in previous research, to be suitable for and easy for adolescent athletes to understand [
13].
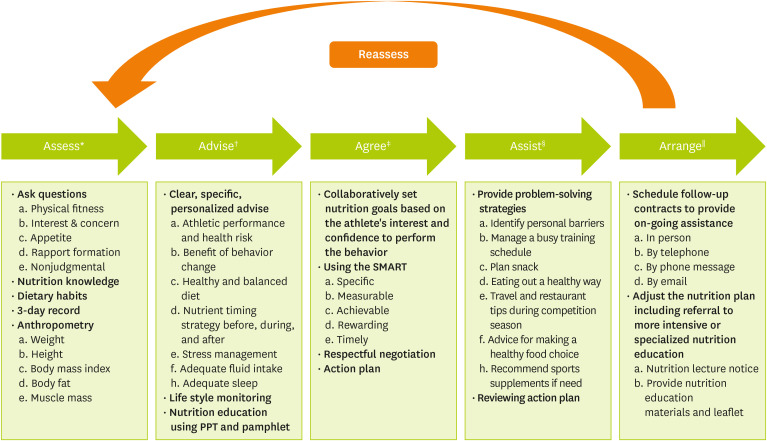
Nutritional interventions in the IE group varied in content and frequency. The IE group received the four group nutrition education sessions provided to the BE group with customized nutritional counseling applying the 5A's behavior change model (
Figure 2). Each 5A’s counseling sessions included five steps: assess, advise, agree, assist, and arrange. The IE group was additionally provided 10 multidimensional nutritional interventions, including four meetings with clinical dietitians, four phone messages after nutrition education, and two phone calls between sessions. The sessions lasted 20–30 minutes each and were provided by a qualified clinical dietitian to minimize bias [
14]. Nutrition counseling for the IE group was individually personalized based on their athletic goals, following a previously reported approach [
15]. In each session, the IE group was provided with 10 healthy eating habits for adolescent athletes that could improve health and athletic performance, including 1) eating food evenly at every meal; 2) eating enough for breakfast; 3) eating milk or dairy products 2–3 times a day; 4) eating enough protein and iron-rich food; 5) eating 2–3 snacks in addition to three meals per day; 6) drinking water before, during, and after exercise; 7) eating carbohydrates before exercise; 8) eating food for recovery within 30 minutes after high-intensity exercise; 9) getting enough sleep; and 10) consulting with an expert about choosing a sports supplement.
Figure 2
Nutrition counseling sample applying the 5A’s behavior change model with adolescent athletes in this study.
*The phase to inform the participant about risk and the need to change their lifestyle; †The phase to suggest motivational counseling and education; ‡The phase to set goals collaboratively; §The phase to present a specific action plan; ∥The phase to follow-up.
Assessment
General and anthropometric characteristics
Age, sex, anthropometric indices, sleep duration, daily exercise duration, and duration of training were investigated. Body composition (height, body weight, lean body mass, body mass index, fat weight, and percent body fat) was assessed using an Inbody 720 (Biospace Co. Ltd., Seoul, Korea).
Assessment of nutritional knowledge
To assess changes in nutritional knowledge, we utilized a valid and reliable nutrition knowledge questionnaire by Furber et al. [
16]. The questionnaires comprised questions on carbohydrates (23), proteins (18), fats (23), macronutrients (25), vitamins/minerals (25), fluid intake (6), and exercise/supplements (14). The total number of questions was 109; each item could be answered as "yes," "no," or "not sure." The score for each question was coded as 1 for a correct response and 0 for an incorrect or “unsure” response. The sum of the scores obtained from items 1 to 109 was the total score, with higher scores indicating better nutritional knowledge.
Assessment of nutrient intake
To assess participants’ nutrient intake, 3-day food records were examined before and after the intervention. The 3-day food record consisted of 2 weekdays and 1 weekend day to reflect their average intake and provide valid results [
17]. Participants were educated on the weight of food provided by a well-trained clinical dietitian, and after recording their food intake, they confirmed and corrected their forms using the direct interview method. Statistical analysis of the participants’ nutrient intake was performed using CAN-Pro (Computer Aided Nutritional Analysis Program, version 5.0; The Korean Nutrition Society, Seoul, Korea).
Assessment of athlete self-management practices
To evaluate changes in self-management, the athlete self-management practices questionnaire developed by Kim [
18] was used. The athlete self-management practices questionnaire was developed to measure six areas: mental readiness management (8 items), daily living management (8 items), personal routine management (5 items), training management (6 items), interpersonal relationship management (3 items), and physical conditioning management (5 items). It has a total of 35 questions, all of which are composed of positive language. Each item is answered using a 5-point scale (1: not at all, 5: very much). The average score of each factor was used to compare the factors because the number of items differed by factor.
All the data are reported as the mean ± standard deviation or as a percentage. Group differences in age, body composition, and duration of training were assessed using independent sample t tests at baseline. Independent samples t tests were also used to compare differences in pre- and post-test nutrient intake and nutritional knowledge. The associations between categorical variables were assessed using the chi-squared test. A paired t test was used to identify differences in the means of continuous data within each group pre- and post-test; between-group comparisons were analyzed using the independent t test. Statistical analysis was performed using Statistical Package for the Social Sciences (SPSS) version 23 (IBM, Seoul, Korea); p values < 0.05 indicated statistical significance.
RESULTS
General and anthropometric characteristics
The baseline characteristics of both groups are shown in
Table 1. No significant differences were noted between the IE and BE groups.
Table 1General and anthropometric characteristics of the study participants at baseline
Table 1
|
Variables |
IE group (n = 65) |
BE group (n = 65) |
p value |
|
Age (yr) |
16.5 ± 1.0 |
16.8 ± 1.0 |
0.108 |
|
Sex |
|
|
0.235 |
|
Boys |
43 (66) |
38 (58) |
|
Girls |
22 (34) |
27 (42) |
|
Anthropometric |
|
|
|
|
Height (cm) |
171.3 ± 7.7 |
170.8 ± 7.4 |
0.744 |
|
Weight (kg) |
67.9 ± 16.8 |
71.3 ± 16.7 |
0.240 |
|
Body mass Index (kg/m2) |
22.9 ± 4.2 |
24.3 ± 4.6 |
0.073 |
|
Lean body mass (kg) |
55.2 ± 10.9 |
57.4 ± 11.5 |
0.254 |
|
Body fat (%) |
17.9 ± 5.3 |
18.9 ± 5.9 |
0.290 |
|
Fat mass (kg) |
12.7 ± 7.0 |
13.9 ± 7.2 |
0.329 |
|
Sleep time (hr) |
6.9 ± 0.6 |
6.7 ± 0.8 |
0.063 |
|
Aerobic exercise* (days/wk) |
5.3 ± 2.6 |
5.3 ± 2.7 |
0.949 |
|
Vigorous exercise† (days/wk) |
5.4 ± 1.2 |
5.5 ± 1.3 |
0.646 |
|
Daily exercise time (hr) |
4.5 ± 1.3 |
5.0 ± 0.8 |
0.022 |
|
Duration of training (yr) |
5.3 ± 2.2 |
5.3 ± 1.6 |
0.982 |
Nutrition knowledge of the participants
Table 2 shows the average nutritional knowledge of the IE and BE groups in the pre- and post-tests. At the post-test, both groups showed significant improvement in total nutritional knowledge compared with their respective pre-tests (p < 0.001), but the IE group had a much greater increase than the BE group (the IE group improved from 26.9 to 63.9, whereas the BE group improved from 28.5 to 48.1) (p < 0.001). Changes in carbohydrate scores were significantly higher in the IE group than in the BE group (p < 0.001). Knowledge about protein increased significantly in the post-test (p < 0.001), and the increase in the IE group was significantly higher than that in the BE group (p < 0.05). Fat-related knowledge increased significantly in both groups in the post-test (p < 0.001), but the percentage of correct answers was <50%. In both groups, the percentage of correct answers in the nutrient category was only approximately 25% pre-tests; a significant increase was observed post-test (60% for the IE group vs 43% for the BE group) (p < 0.001). At pre-test, sports nutrition knowledge had the lowest correct answer rate among the six categories, and the number of correct answers increased significantly post-test (p < 0.001), although the percentage of correct answers remained low (of the 14 items, 8.5 for the IE group and 6.2 for the BE group).
Table 2Pre- and post-test scores for nutritional knowledge in the IE and BE groups
Table 2
|
Variables |
IE group (n = 65) |
BE group (n = 65) |
p value‡
|
|
Pre-test |
Post-test |
Change |
Pre-test |
Post-test |
Change |
|
Carbohydrate (n = 23) |
5.5 ± 3.5 |
15.6 ± 4.6†
|
10.1 ± 5.2 |
5.6 ± 3.2 |
10.6 ± 4.7†
|
5.0 ± 4.3 |
< 0.001 |
|
Protein (n = 18) |
5.9 ± 3.7 |
10.4 ± 2.5†
|
4.5 ± 3.9 |
6.0 ± 3.1 |
8.3 ± 3.3†
|
2.3 ± 3.8 |
0.001 |
|
Fat (n = 23) |
4.2 ± 3.7 |
11.0 ± 4.5†
|
6.7 ± 5.8 |
5.7 ± 5.1 |
9.9 ± 5.3†
|
4.1 ± 5.6 |
0.010 |
|
Nutrient (n = 25) |
6.4 ± 4.5 |
15.0 ± 3.6†
|
8.6 ± 4.9 |
6.3 ± 4.0 |
10.7 ± 4.4†
|
4.4 ± 4.1 |
< 0.001 |
|
Fluid (n = 6) |
1.7 ± 1.4 |
3.4 ± 1.2†
|
1.7 ± 1.6 |
1.7 ± 1.3 |
2.4 ± 1.2*
|
0.7 ± 1.7 |
0.001 |
|
Sports nutrition (n = 14) |
3.2 ± 2.7 |
8.5 ± 2.4†
|
5.4 ± 3.0 |
3.1 ± 2.5 |
6.2 ± 2.5†
|
3.0 ± 2.8 |
< 0.001 |
|
Total (n = 109) |
26.9 ± 14.1 |
63.9 ± 12.7†
|
37.0 ± 16.7 |
28.5 ± 14.6 |
48.1 ± 17.2†
|
19.6 ± 14.8 |
< 0.001 |
Nutrient intake of participants
The nutrient intake of the participants pre- and post-test is summarized in
Table 3. The IE group exhibited a significant post-test increase in energy intake (p < 0.001), while the BE group showed no significant changes. Daily energy intake significantly increased in the IE group but decreased in the BE group (p < 0.001). Carbohydrate intake increased significantly in the IE group (p < 0.001) but decreased in the BE group. The daily protein intake of the IE group was significantly higher than that of the BE group (p < 0.01). At post-test, the fat intake of the IE group significantly increased (p < 0.001), while that of the BE group decreased. Both groups maintained the recommended ranges for carbohydrate, protein, and fat intake. The vitamin A intake was lower than the Korean dietary reference intake 2015 (KDRI) for both the pre- and post-test. At pre-test, the BE group had adequate vitamin D intake, while the IE group consumed only 43% of the recommended levels. Both groups showed significantly lower vitamin D intake post-test. The vitamin C intake was below the KDRI for both groups. The intake of vitamin E, thiamin, riboflavin, folic acid, and vitamin B12 was higher than that of the KDRI at pre- and post-test. However, the levels of vitamins A, D, and C remained lower than those in the KDRI despite the intervention. Calcium, potassium, magnesium, and manganese intakes were lower than the KDRIs at both pre- and post-test in both groups. Conversely, phosphorus, sodium, iron, zinc, and selenium intakes all met the KDRI. The change in average intake of all minerals investigated in this study was significantly higher in the IE group than in the BE group (p ≤ 0.001).
Table 3Differences in total energy and nutrient intake between the IE and BE groups pre- and post-test
Table 3
|
Variables |
IE group (n = 65) |
BE group (n = 65) |
p value§
|
|
Pre-test |
Post-test |
Change |
Pre-test |
Post-test |
Change |
|
Total energy (kcal) |
2,184.8 ± 671.7 |
2,651.3 ± 593.1‡
|
466.5 ± 478.8 |
2,199.6 ± 551.6 |
2,140.3 ± 546.1 |
−59.3 ± 796.3 |
< 0.001 |
|
Carbohydrate |
|
|
|
|
|
|
|
|
Total carbohydrate (g) |
297.6 ± 97.4 |
352.2 ± 80.5‡
|
54.6 ± 73.6 |
296.2 ± 64.9 |
283.0 ± 73.6 |
−13.2 ± 97.9 |
< 0.001 |
|
Carbohydrate g/kg body weight |
4.5 ± 1.6 |
5.4 ± 1.4‡
|
0.8 ± 1.2 |
4.3 ± 1.3 |
4.1 ± 1.1 |
−0.2 ± 1.5 |
< 0.001 |
|
Carbohydrate percentage (%) |
54.3 ± 4.8 |
53.3 ± 4.4 |
−0.9 ± 6.6 |
54.5 ± 4.8 |
53.0 ± 4.9 |
−1.5 ± 6.8 |
0.610 |
|
Protein |
|
|
|
|
|
|
|
|
Total protein (g) |
85.9 ± 24.5 |
106.0 ± 27.8‡
|
20.0 ± 22.3 |
85.3 ± 24.2 |
88.3 ± 24.7 |
2.9 ± 35.2 |
0.001 |
|
Protein g/kg body weight |
1.3 ± 0.4 |
1.6 ± 0.5*
|
0.3 ± 0.4 |
1.2 ± 0.4 |
1.3 ± 0.4 |
0.0 ± 0.5 |
< 0.001 |
|
Protein percentage (%) |
15.9 ± 1.8 |
15.9 ± 1.7 |
0.0 ± 2.3 |
15.4 ± 1.4 |
16.5 ± 2.0‡
|
1.1 ± 2.2 |
0.005 |
|
Fat |
|
|
|
|
|
|
|
|
Total fat (g) |
70.8 ± 24.2 |
88.3 ± 22.4‡
|
17.5 ± 24.1 |
72.2 ± 24.7 |
68.6 ± 21.0 |
−3.6 ± 33.8 |
< 0.001 |
|
Fat percentage (%) |
29.4 ± 4.4 |
29.1 ± 4.2 |
29.9 ± 3.3 |
28.7 ± 3.6 |
0.5 ± 5.3 |
−0.4 ± 5.6 |
0.325 |
|
Vitamin |
|
|
|
|
|
|
|
|
Vitamin A (μg) |
694.2 ± 326.1 |
538.7 ± 146.7‡
|
−155.5 ± 299.4 |
479.3 ± 137.0 |
411.3 ± 161.9*
|
−68.0 ± 212.4 |
0.057 |
|
Vitamin D (μg) |
4.3 ± 3.0 |
5.2 ± 3.8 |
0.8 ± 5.3 |
9.7 ± 4.4 |
3.7 ± 3.0‡
|
−6.0 ± 5.8 |
< 0.001 |
|
Vitamin E (mg) |
18.2 ± 6.5 |
22.5 ± 7.4‡
|
4.4 ± 8.0 |
21.8 ± 7.6 |
18.1 ± 6.5*
|
−3.8 ± 9.2 |
< 0.001 |
|
Vitamin C (mg) |
60.6 ± 27.6 |
64.8 ± 25.6 |
4.2 ± 31.4 |
52.0 ± 14.4 |
58.6 ± 32.6 |
6.6 ± 34.5 |
0.677 |
|
Thiamin (mg) |
2.0 ± 0.8 |
2.6 ± 0.7‡
|
0.6 ± 0.7 |
2.1 ± 0.6 |
2.0 ± 0.6 |
−0.1 ± 0.8 |
< 0.001 |
|
Riboflavin (mg) |
1.7 ± 0.9 |
3.3 ± 3.1‡
|
1.6 ± 3.3 |
1.7 ± 0.8 |
1.6 ± 1.2 |
0.0 ± 1.4 |
< 0.001 |
|
Niacin (mg) |
14.7 ± 4.8 |
18.5 ± 5.6*
|
3.8 ± 4.9 |
15.7 ± 5.0 |
16.3 ± 5.1 |
0.5 ± 7.3 |
0.003 |
|
Folate (μg) |
416.8 ± 142.8 |
548.7 ± 140.6‡
|
131.9 ± 148.1 |
443.7 ± 130.4 |
402.3 ± 156.9 |
−41.4 ± 185.3 |
< 0.001 |
|
Vitamin B12 (μg) |
7.1 ± 2.9 |
9.7 ± 4.5‡
|
2.7 ± 5.3 |
7.2 ± 3.6 |
7.8 ± 3.8 |
0.6 ± 5.5 |
0.034 |
|
Mineral |
|
|
|
|
|
|
|
|
Calcium (mg) |
529.2 ± 183.3 |
666.3 ± 167.3‡
|
137.1 ± 209.8 |
540.5 ± 202.3 |
487.6 ± 215.6 |
−52.8 ± 344.7 |
< 0.001 |
|
Phosphorus (mg) |
1,246.0 ± 324.0 |
1,542.9 ± 372.6‡
|
297.0 ± 326.0 |
1,290.3 ± 341.6 |
1,214.1 ± 343.4 |
−76.2 ± 504.4 |
< 0.001 |
|
Sodium (mg) |
3,836.4 ± 1,131.5 |
5,317.0 ± 1,460.9‡
|
1,480.6 ± 1,309.4 |
3,808.9 ± 1,012.8 |
3,768.8 ± 1,278.6 |
−40.1 ± 1,490.7 |
< 0.001 |
|
Potassium (mg) |
2,597.4 ± 727.8 |
3,420.7 ± 812.3‡
|
823.2 ± 804.2 |
2,637.6 ± 733.8 |
2,492.1 ± 832.8 |
−145.6 ± 1,073.8 |
< 0.001 |
|
Magnesium (mg) |
112.2 ± 39.1 |
154.3 ± 51.4‡
|
42.1 ± 54.1 |
117.3 ± 44.7 |
94.2 ± 44.5†
|
−23.1 ± 58.2 |
< 0.001 |
|
Iron (mg) |
19.1 ± 15.0 |
35.8 ± 42.0‡
|
16.7 ± 34.0 |
17.4 ± 7.2 |
16.0 ± 6.7 |
−1.3 ± 9.7 |
< 0.001 |
|
Zinc (mg) |
12.0 ± 3.8 |
14.0 ± 3.5‡
|
2.0 ± 3.2 |
14.0 ± 5.3 |
11.6 ± 3.7 |
−2.4 ± 6.7 |
< 0.001 |
|
Copper (mg) |
753.4 ± 446.6 |
1,183.1 ± 1,166.4‡
|
429.6 ± 924.4 |
719.2 ± 268.1 |
694.7 ± 581.3 |
−24.5 ± 628.5 |
0.001 |
Assessment of athlete self-management practices
Table 4 shows the athlete self-management practices of the IE and BE groups. The IE group exhibited a significant post-test improvement in mental readiness management and daily living, personal routine, training, and physical conditioning management (p < 0.05), while the BE group showed no significant changes. Nonetheless, there was no significant difference in change between the groups.
Table 4Athlete self-management practices between the IE and BE groups at the pre- and post-tests
Table 4
|
Variables |
IE group (n = 65) |
BE group (n = 65) |
p value†
|
|
Baseline |
12 weeks |
Change |
Baseline |
12 weeks |
Change |
|
Mental readiness management |
4.1 ± 0.7 |
4.3 ± 0.6*
|
0.2 ± 0.6 |
3.9 ± 0.8 |
4.0 ± 0.6 |
0.1 ± 0.9 |
0.357 |
|
Daily living management |
4.1 ± 0.5 |
4.2 ± 0.6*
|
0.1 ± 0.5 |
3.8 ± 0.8 |
3.9 ± 0.6 |
0.1 ± 0.8 |
0.570 |
|
Personal routine management |
3.5 ± 0.7 |
3.6 ± 0.7*
|
0.2 ± 0.6 |
3.2 ± 0.9 |
3.2 ± 0.7 |
0.0 ± 0.7 |
0.405 |
|
Training management |
4.0 ± 0.6 |
4.1 ± 0.6*
|
0.1 ± 0.5 |
3.7 ± 0.8 |
3.7 ± 0.6 |
0.1 ± 0.7 |
0.491 |
|
Interpersonal relationship management |
4.3 ± 0.7 |
4.5 ± 0.6 |
0.2 ± 0.7 |
4.1 ± 0.8 |
4.1 ± 0.7 |
0.0 ± 0.9 |
0.280 |
|
Physical conditioning management |
3.8 ± 0.6 |
4.0 ± 0.6*
|
0.2 ± 0.5 |
3.6 ± 0.8 |
3.6 ± 0.6 |
0.0 ± 0.8 |
0.159 |
DISCUSSION
Compared with those in the control group, the nutritional knowledge and total energy and nutrient intake of athletes who participated in the 12-week intensive nutrition intervention in the 5A’s behavioral change model increased. This IE program was developed and applied to improve adolescent athletes' nutritional knowledge and nutrient intake.
At the pre-test, both the IE and BE groups exhibited low nutritional knowledge. Both groups had significantly improved nutritional knowledge at post-test, but the improvement was significantly higher in the IE group. Previous studies have shown that the nutritional knowledge of athletes and coaches is inadequate [
5,
19]. Similar to prior studies, the results of this study revealed that nutrition education significantly improved the nutrition knowledge of athletes [
17,
20]. Nutritional knowledge and the eating habits of athletes are related, and the frequency of nutrition education can affect nutritional knowledge [
5]. In this study, nutritional knowledge at pre-test was low, with correct answers given to fewer than one-third of the questions in both groups. Even in the BE group, only four sessions of nutrition education, without nutrition counseling, increased nutrition knowledge, which is evidence that nutrition education is necessary for athletes.
At post-test, the IE group reported improved intake of energy and macronutrients, but the BE group did not. Adolescent athletes need enough energy to meet both their individual growth and development needs and the demands of their general physical activity, training, and competitions [
2]. At pre-test, despite the considerable amount of regular exercise time, both groups had significantly lower daily energy intake than indicated by the sports nutrition recommendation (SNR) [
21] and the KDRI [
22]. A systematic review reported that adolescent athletes frequently consume insufficient energy, despite recommendations [
2]. This low intake can cause health issues such as delayed puberty, weakened bones, irregular menstruation, eating disorders, stunted growth, and increased injury risk [
23]. Adequate intake of macronutrients such as carbohydrates, proteins, and fats is known to aid in the generation of both fat free mass (FFM) and fat mass (FM), which in turn affects the increase in basal metabolic rate [
24]. Furthermore, FFM has approximately five times more influence than FM [
24]. Moreover, the intake of carbohydrates and proteins has a greater thermogenic effects compared to fat, which plays a crucial role in the strength and endurance performance of athletes [
25]. Although athletic performance was not directly evaluated in this study, previous research strongly suggests that the improvements in energy and macronutrient intake observed in the IE group likely contributed to better athletic performance.
At post-test, the IE group consumed energy at the level of the KDRI, but the BE group showed little change from pre-test. Both groups maintained sufficient protein intake throughout. Inadequate energy intake can use protein as an energy substrate, and total energy intake must be considered when assessing protein requirements [
26]. Both groups needed to increase their total energy intake beyond the increased energy requirements. The carbohydrate intake guide for training and competition suggests that athletes training in a high-intensity exercise program for 1–4 hours a day should consume 30–60 g of carbohydrates per kg/day [
27]. In this study, although carbohydrate intake was significantly elevated in the IE group at post-test, both groups still had substantially lower carbohydrate intake than the SNR. Previous studies have frequently examined the lack of carbohydrate intake among adolescent athletes [
27,
28]. As carbohydrates provide important fuel for exercise and brain function, carbohydrate replenishment between high-intensity workouts is important [
2]. Therefore, the importance of carbohydrate intake needs to be emphasized for adolescent athletes.
The dietary fat intake recommendations for adolescent athletes are generally determined by public health guidelines, which suggest fat intake within 30% of the total energy intake [
2]. Both at pre- and post-tests, both groups consumed approximately 30% of their daily energy intake from fats, a reasonable level.
At the post-test, the average daily intake of vitamins and minerals in the IE group significantly improved, except for vitamin A, but the intake in the BE group did not improve. Compared with the KDRI, both groups reported insufficient calcium, vitamin D, vitamin C, vitamin A, and magnesium intake at both the pre- and post-tests. Common food sources of these nutrients include vegetables such as leafy greens and mushrooms, as well as fish [
29,
30]. The primary cause of nutrient deficiencies among modern athletes are their low preference for vegetables and fish [
31]. Additionally, the deficiency is exacerbated by the difficulty of maintaining a balanced diet due to busy schedules filled with training, competitions, and academic responsibilities, which often leads to reliance on fast food and snacks [
32]. Therefore, it is essential to identify effective nutritional management strategies that support a balanced diet, including nutrition planning, guidance from nutritionists, and meals provided in cafeterias, while accommodating demanding schedules [
32]. Furthermore, with the exception of vitamin A, the intake of most nutrients tends to increase following nutritional counseling. Sustaining such counseling over the long term is expected to positively influence the nutrient intake of adolescent athletes. In particular, iron and calcium deficiencies are often mentioned as common problems for adolescent athletes [
21]. According to the pre- and post-tests of this study, both groups reported consuming adequate iron, the micronutrient most likely to be deficient in athletes in previous studies [
2,
21]. The subjects in this study might have had enough iron intake because they ate at the school cafeteria, and the dietitians there took care to provide protein- and iron-rich diets full of meat, eggs, fish, and legumes. Calcium and vitamin D are essential to an adolescent athlete's bone health, but their intake of calcium and vitamin D has often been reported to be low. Coaches and nutrition specialists should regularly monitor athletes' calcium and vitamin D intake to support bone health and exercise performance [
2].
This study is the first intervention study with adolescent athletes to use the 5A's counseling model, a new tool used by healthcare providers to induce behavioral changes in overweight and obese people [
33]. This model has gained trust for counseling behavior changes such as smoking cessation, dietary changes, alcohol reduction, and weight control [
34]. Athletes often pursue weight loss to enhance the strength-to-mass ratio, locomotive efficiency, or aesthetic appearance, favoring reduced body fat while preserving lean mass [
35]. Despite the necessity for adequate diets to maintain health and optimize growth and performance, many adolescent athletes follow fad diets instead of SNR. This study applied the 5A's model to encourage behavioral changes in adolescent athletes' nutritional intake, replacing each 'A' with cooperative, person-centered behavior (e.g., goal setting), aligning with patient-centered care principles [
36]. In the "assess" phase, items that directly or indirectly affect athletic performance were measured, and trends were observed. The ‘advise’ phase provided specific, personalized advice about the assessment. In terms of nutrition, the ‘agree’ phase was used to collaboratively select goals based on the athlete’s interest and motivation to change. This collaboration is at the heart of the model and helped to drive the athlete’s actual behavioral changes in this study. For athletes who lacked nutrition knowledge, ‘10 healthy eating plan samples’ for athletic performance improvement helped them set their own goals. The ‘assist’ phase provided a concrete way to practice the personal action plan. The ‘arrange’ phase provided continual follow-ups to allow the athletes to maintain and improve their behavior.
This study has notable strengths. First, this study is the first to apply the 5A's behavior change model to athlete nutrition counseling, potentially laying the groundwork for future behavioral studies in athletes, including dietary habits. Second, it highlights the benefits of combining individual nutritional counseling with education, an area underexplored in sports nutrition. Research on the effects of diet manipulation and nutritional intervention among adolescent athletes is scarce because of ethical considerations and potential adverse effects on the growth and maturation of adolescent participants [
21]. However, this study also has several limitations, including potential bias toward compliance among participants receiving both education and counseling, and the study's sample was limited to one physical education high school, possibly not fully representing all Korean adolescent athletes. Moreover, although the study did not consider the nutritional differences between male and female athletes, there were no significant gender differences between the groups, which supports a general assessment of the nutritional requirements of adolescent athletes. Therefore, future research should focus on exploring the specific nutritional needs of athletes, taking into consideration factors such as gender and age, to provide a more comprehensive understanding of their requirements.
Currently, nutrition education for children and adolescents is primarily school-based, with interventions generally providing educational materials such as posters, pamphlets, and videos, or sporadic nutrition education sessions led by nutritionists in each class [
37,
38,
39,
40]. However, providing nutrition knowledge alone seldom leads to sustained behavior change, these nutrition education models primarily emphasize information sharing which results in diminished motivation among students and poses significant limitations to their active engagement and behavioral change [
41,
42]. In contrast, our nutritional intervention employs the 5A's model, developed for physician-led counseling aimed at promoting behavioral changes in patients for weight management [
16]. Unlike Typically school-based education, our intervention focused on personalized, multidimensional nutritional education through periodic telephone and in-person counseling sessions with clinical dietitians. This approach is an effective method for providing deeper knowledge about nutrition and promoting dietary behavior change beyond simple information dissemination [
17,
43]. Additionally, providing personalized, regular nutrition feedback, it plays a more effective role in improving overall nutritional status and nutrient intake [
44]. These characteristics are expected to apply to athletes from various sports disciplines and may also expect positive outcomes for non-athlete children and adolescents.
CONCLUSION
The intensive nutritional intervention for Korean adolescent athletes improved their nutrition knowledge and nutrient intake compared to those who only received group education. If this intensive nutrition intervention protocol is applied to athletes in different fields, it could detect early nutritional issues among adolescents, reduce stress, improve quality of life, and enhance athletic performance.
NOTES
-
Conflict of Interest: The authors declare that they have no competing interests.
-
Author Contributions:
Conceptualization: Lim H, Lee S.
Formal analysis: Lee S.
Investigation: Lee S.
Methodology: Lim H, Lee S.
Supervision: Lim H.
Writing - original draft: Lee S, Hwang Y.
Writing - review & editing: Lim H, Hwang Y.
ACKNOWLEDGEMENTS
We thank all the adolescent athletes at the physical education high school in Seoul, Republic of Korea, who participated in this study.
REFERENCES
- 1. Thomas DT, Erdman KA, Burke LM. American College of Sports Medicine joint position statement. Nutrition and athletic performance. Med Sci Sports Exerc 2016;48:543-568.
- 2. Desbrow B, McCormack J, Burke LM, Cox GR, Fallon K, et al. Sports Dietitians Australia position statement: sports nutrition for the adolescent athlete. Int J Sport Nutr Exerc Metab 2014;24:570-584.
- 3. Zuniga KE, Downey DL, McCluskey R, Rivers C. Need for and interest in a sports nutrition mobile device application among Division I collegiate athletes. Int J Sport Nutr Exerc Metab 2017;27:43-49.
- 4. Partida S, Marshall A, Henry R, Townsend J, Toy A. Attitudes toward nutrition and dietary habits and effectiveness of nutrition education in active adolescents in a private school setting: a pilot study. Nutrients 2018;10:1260.
- 5. Hornstrom GR, Friesen CA, Ellery JE, Pike K. Nutrition knowledge, practices, attitudes, and information sources of Mid-American Conference college softball players. Food Nutr Sci 2011;2:109-117.
- 6. Trakman GL, Forsyth A, Devlin BL, Belski R. A systematic review of athletes’ and coaches’ nutrition knowledge and reflections on the quality of current nutrition knowledge measures. Nutrients 2016;8:570.
- 7. Mikkilä V, Räsänen L, Raitakari OT, Pietinen P, Viikari J. Consistent dietary patterns identified from childhood to adulthood: the cardiovascular risk in Young Finns Study. Br J Nutr 2005;93:923-931.
- 8. American Dietetic Association. Dietitians of Canada. American College of Sports Medicine. Rodriguez NR, Di Marco NM, et al. American College of Sports Medicine position stand. Nutrition and athletic performance. Med Sci Sports Exerc 2009;41:709-731.
- 9. Spronk I, Heaney SE, Prvan T, O’Connor HT. Relationship between general nutrition knowledge and dietary quality in elite athletes. Int J Sport Nutr Exerc Metab 2015;25:243-251.
- 10. Carl RL, Johnson MD, Martin TJ. Council on Sports Medicine and Fitness. Promotion of healthy weight-control practices in young athletes. Pediatrics 2017;140:e20171871.
- 11. Welzel FD, Stein J, Pabst A, Luppa M, Kersting A, et al. Five A’s counseling in weight management of obese patients in primary care: a cluster-randomized controlled trial (INTERACT). BMC Fam Pract 2018;19:97.
- 12. Manore MM, Patton-Lopez MM, Meng Y, Wong SS. Sport nutrition knowledge, behaviors and beliefs of high school soccer players. Nutrients 2017;9:350.
- 13. Parks RB, Helwig D, Dettmann J, Taggart T, Woodruff B, et al. Developing a performance nutrition curriculum for collegiate athletics. J Nutr Educ Behav 2016;48:419-424.e1.
- 14. Van Voorhees BW, Fogel J, Reinecke MA, Gladstone T, Stuart S, et al. Randomized clinical trial of an Internet-based depression prevention program for adolescents (Project CATCH-IT) in primary care: 12-week outcomes. J Dev Behav Pediatr 2009;30:23-37.
- 15. Nascimento M, Silva D, Ribeiro S, Nunes M, Almeida M, et al. Effect of a nutritional intervention in athlete’s body composition, eating behaviour and nutritional knowledge: a comparison between adults and adolescents. Nutrients 2016;8:535.
- 16. Furber MJW, Roberts JD, Roberts MG. A valid and reliable nutrition knowledge questionnaire for track and field athletes. BMC Nutr 2017;3:36.
- 17. Valliant MW, Emplaincourt HP, Wenzel RK, Garner BH. Nutrition education by a registered dietitian improves dietary intake and nutrition knowledge of a NCAA female volleyball team. Nutrients 2012;4:506-516.
- 18. Kim BJ. Measuring self-management practices in Korean athletes. Korean J Sport Sci 2003;14:125-140.
- 19. Juzwiak CR, Ancona-Lopez F. Evaluation of nutrition knowledge and dietary recommendations by coaches of adolescent Brazilian athletes. Int J Sport Nutr Exerc Metab 2004;14:222-235.
- 20. Abood DA, Black DR, Birnbaum RD. Nutrition education intervention for college female athletes. J Nutr Educ Behav 2004;36:135-137.
- 21. Smith JW, Holmes ME, McAllister MJ. Nutritional considerations for performance in young athletes. J Sports Med (Hindawi Publ Corp) 2015;2015:734649.
- 22. Kweon S, Kim Y, Jang MJ, Kim Y, Kim K, et al. Data resource profile: the Korea National Health and Nutrition Examination Survey (KNHANES). Int J Epidemiol 2014;43:69-77.
- 23. Bass S, Inge K. Nutrition for special populations: children and young athletes. In: Burke LM, Deakin V, editors. Clinical sports nutrition. Sydney: McGraw-Hill; 2006. p. 589-632.
- 24. Johnstone AM, Murison SD, Duncan JS, Rance KA, Speakman JR. Factors influencing variation in basal metabolic rate include fat-free mass, fat mass, age, and circulating thyroxine but not sex, circulating leptin, or triiodothyronine. Am J Clin Nutr 2005;82:941-948.
- 25. Pesta DH, Samuel VT. A high-protein diet for reducing body fat: mechanisms and possible caveats. Nutr Metab (Lond) 2014;11:53.
- 26. Jäger R, Kerksick CM, Campbell BI, Cribb PJ, Wells SD, et al. International Society of Sports Nutrition position stand: protein and exercise. J Int Soc Sports Nutr 2017;14:20.
- 27. Baker LB, Heaton LE, Nuccio RP, Stein KW. Dietitian-observed macronutrient intakes of young skill and team-sport athletes: adequacy of pre, during, and postexercise nutrition. Int J Sport Nutr Exerc Metab 2014;24:166-176.
- 28. Nikić M, Pedišic Ž, Šatalic Z, Jakovljević S, Venus D. Adequacy of nutrient intakes in elite junior basketball players. Int J Sport Nutr Exerc Metab 2014;24:516-523.
- 29. Ministry of Health and Welfare. Korea Centers for Disease Control and Prevention. 2020 Dietary reference intakes for Koreans: vitamins. Seoul: Ministry of Health and Welfare; 2020.
- 30. Ministry of Health and Welfare. Korea Centers for Disease Control and Prevention. 2020 Dietary reference intakes for Koreans: minerals. Seoul: Ministry of Health and Welfare; 2020.
- 31. Cherian KS, Gavaravarapu SM, Sainoji A, Yagnambhatt VR. Coaches’ perceptions about food, appetite, and nutrition of adolescent Indian athletes - a qualitative study. Heliyon (Lond) 2020;6:e03354.
- 32. Diehl K, Yarmoliuk T, Mayer J, Zipfel S, Schnell A, et al. Eating patterns of elite adolescent athletes: results of a cross-sectional study of 51 Olympic sports. Dtsch Z Sportmed 2013;64:126-131.
- 33. Sherson EA, Yakes Jimenez E, Katalanos N. A review of the use of the 5 A’s model for weight loss counselling: differences between physician practice and patient demand. Fam Pract 2014;31:389-398.
- 34. Whitlock EP, Orleans CT, Pender N, Allan J. Evaluating primary care behavioral counseling interventions: an evidence-based approach. Am J Prev Med 2002;22:267-284.
- 35. Trexler ET, Smith-Ryan AE, Norton LE. Metabolic adaptation to weight loss: implications for the athlete. J Int Soc Sports Nutr 2014;11:7.
- 36. Sturgiss E, van Weel C. The 5 As framework for obesity management: do we need a more intricate model? Can Fam Physician 2017;63:506-508.
- 37. Raut S, Kc D, Singh DR, Dhungana RR, Pradhan PM, et al. Effect of nutrition education intervention on nutrition knowledge, attitude, and diet quality among school-going adolescents: a quasi-experimental study. BMC Nutr 2024;10:35.
- 38. Wang D, Stewart D, Chang C, Shi Y. Effect of a school-based nutrition education program on adolescents’ nutrition-related knowledge, attitudes and behaviour in rural areas of China. Environ Health Prev Med 2015;20:271-278.
- 39. Franciscato SJ, Janson G, Machado R, Lauris JR, Andrade SM, et al. Impact of the nutrition education program Nutriamigos® on levels of awareness on healthy eating habits in school-aged children. J Hum Growth Dev 2019;29:390-402.
- 40. Nyma Z, Rahman M, Das S, Alam MA, Haque E, et al. Dietary diversity modification through school-based nutrition education among Bangladeshi adolescent girls: a cluster randomized controlled trial. PLoS One 2023;18:e0282407.
- 41. Nguyen T, de Brauw A, van den Berg M, Do HTP. Testing methods to increase consumption of healthy foods: evidence from a school-based field experiment in Viet Nam. Food Policy 2021;101:102047.
- 42. Hackman RM, Aggarwal BB, Applebaum RS, deVere White RW, Dubick MA, et al. Forecasting nutrition research in 2020. J Am Coll Nutr 2014;33:340-346.
- 43. Hoevenaars FPM, Berendsen CMM, Pasman WJ, van den Broek TJ, Barrat E, et al. Evaluation of food-intake behavior in a healthy population: personalized vs. one-size-fits-all. Nutrients 2020;12:2819.
- 44. Celis-Morales C, Livingstone KM, Petermann-Rocha F, Navas-Carretero S, San-Cristobal R, et al. Frequent nutritional feedback, personalized advice, and behavioral changes: findings from the European Food4Me internet-based RCT. Am J Prev Med 2019;57:209-219.