ABSTRACT
Nutrition fact labels (NFLs) have advantages because they are an intuitive tool that provides unified information regulated by the government and does not require any devices or special skills. During pandemic, with increased interest in information about healthy food choices and optimum nutrition, frequent exposure to NFLs on pre-packaged foods and dietary supplements may have helped consumers become aware of and/or use NFLs. We aimed to evaluate NFL usage changes from the pre- and early to the late pandemic years in the Korean adult population, using data from the Korean Community Health Survey (3-year total respondents n = 687,610) conducted from 2019 to 2021. NFL awareness, effect, and utilization ratios in each subgroup (sex, age, diabetes mellitus/hypertension, subjective health status, and physical activity) were analyzed for the 3 years by the cross-tabulation test of weighted complex sample analysis. Despite the declining awareness of NFLs in the Korean population, the proportion of individuals who were affected by the NFL content in the entire population and the utilization ratio among those who were aware of NFLs increased continuously during the early and late pandemic periods. Thus, Nutrition experts and policy-makers need to increase efforts to maintain interest in NFLs that emerged during the pandemic. NFLs, a conventional but well-regulated and effective tool, may have enabled the Korean population to make healthy food choices during the pandemic.
-
Keywords: Pandemics; Nutrient intake; Nutrition labeling; COVID-19; Healthy eating
INTRODUCTION
The unexpected emergence of the coronavirus disease 2019 (COVID-19) pandemic and the appearance of new COVID-19 mutations caused considerable socioeconomic and health disruptions. Lockdown and social distancing policies led to unfavorable eating habits and unhealthy lifestyle changes. At the same time, dietary recommendations suitable for the pandemic period, such as a diet based predominantly on fruits, vegetables, whole grains, low-fat dairy sources, and healthy fats (olive oil and fish oil), and limiting the intake of sugary drinks and processed foods high in calories and salt were emphasized [
1]. In this context, interest in information about healthy food choices and optimum nutrition increased [
2].
Moreover, to achieve an adequate diet in the pandemic era, various non-face-to-face health interventions, including online nutrition education, social media campaigns, and dietary supplement promotions, emerged. Online or computer-based dietary counsel and mobile apps that provide nutrition information were utilized; however, overall, their accessibility is frequently challenged due to technical illiteracy or inaccurate information. Additionally, an excess of information (both true and false) makes it difficult for people to obtain valid guidance for decision-making regarding food choices [
3]. Thus, because of these challenges, tools that provide accessible and reliable information to all people in all sectors of society are needed to prevent unhealthy diet habits in the pandemic era. Also, considering that packaged foods such as ready meals and home meal replacements were more frequently consumed than farmers’ market groceries [
4], along with the increased dependency on dietary supplements for nutritional intake during pandemic [
5], the expanded selection of nutrition fact labels (NFLs)—mandatory nutrition-labeled foods—suggests that the pandemic is related to compliance with nutrition label usage.
In this respect, NFLs have advantages because they are an intuitive tool that provides unified information regulated by the government and does not require any devices or special skills. NFLs are nutrition and food-related information displayed on food packaging and have been mandatory for more than 20 years not only in Asian countries such as Korea but also in the United States (US) and European Union countries. Furthermore, there are reports that the use of NFLs is directly related to healthier food intake [
6] and improved nutritional status [
7].
Considering the points mentioned above, NFLs may have credibility and a role as a useful tool during a prolonged health crisis. Therefore, this study hypothesized that the use of NFLs increased compared to before the pandemic. Previous studies on NFL use during the pandemic had limitations, such as including only one sex or certain age groups, not analyzing long-term changes or lacking national representativeness.
The aim of this study was to: 1) analyze the changes in awareness of NFLs before and after the pandemic in Korea among the entire population. Therefore, this national-level, weighted, complex sample cross-sectional study used data from the Korean Community Health Survey (KCHS), which provides stratified health statistics and serves as a basis for national health projects in Korea. It included responses from more than 200,000 participants each year, totaling 687,610 participants over 3 years: 2019 (pre-pandemic), 2020 (early pandemic) and 2021 (late pandemic); 2) analyze the change in the ratio of subjects affected by NFL information in each subgroup (sex, age, disease status, subjective health status, and level of physical activity) because NFLs are commonly used by patients following restricted diets [
8], and the use of NFLs has been reported to be related to sex [
9], subjective health status [
10], and regular exercise [
11]; and 3) evaluate changes in the utilization rate of NFLs among subjects who were aware of NFLs.
MATERIALS AND METHODS
Data collection and study participants
This was a national-level cross-sectional study using 3 years of data from the KCHS (2019–2021). The KCHS was designed to establish health statistics for implementing appropriate health services for various population groups with different health levels among communities in Korea. The KCHS has been conducted annually since 2008 by the Korea Disease Control and Prevention Agency (KCDA). This nationwide survey is based on Article 4 of the Regional Public Health Act and is a government-designated survey based on the Statistical Act (approval number 117075) in Korea. Using data from the Ministry of the Interior and Safety for resident registration and the Ministry of Land, Infrastructure and Transport for housing, a population sampling frame of the KCHS was created. The sample distribution was an average of 900 people per public health center, and samples were allocated by region (urban/rural) and housing type. A computer-assisted personal interview survey was conducted at 255 public health centers and supervised by 34 responsible universities in 17 provinces. For verification of questionnaire responses, 13% of the subjects were randomly selected, and secondary telephone interviews were conducted by a third party, with the results reported to the KCDA. The survey period was from August to October of each year. In 2019, 2020, and 2021, data were collected from 229,099, 229,269 and 229,242 participants, respectively.
Ethical review
The KCHS was approved by the Institutional Review Board of the KCDA (2016-10-01-T-A) and was conducted in accordance with the tenets of the Declaration of Helsinki. Written informed consent was obtained from all subjects before survey participation. All data were deidentified for research purposes, and the analysis was conducted in accordance with the guidelines and regulations of the KCDA.
Inclusion criteria and subgroups according to medical history, subjective health, and physical activity
The inclusion criterion was Korean adults aged 19 and over. The subjects were divided into 3 age groups within the male and female categories: 19–49 years (young), 50–64 years (middle-aged), and 65 years and over (elderly), which was similar to the tertile distribution of all populations. Thus, participants in this study were divided into the following subgroups: the healthy group vs. the diabetes mellitus (DM)/hypertension (HTN) group; the good subjective health status group vs. the poor subjective health status group; and the high physical activity group vs. the low physical activity group.
Subjects diagnosed with DM and/or HTN by a doctor were classified into the DM/HTN group, while the other subjects were classified into the healthy group. Second, to investigate subjective health status, the question “How do you usually feel about your health?” was asked, with the possible answer choices being very good, good, normal, bad, very bad, and refuse to answer. Subjects who answered very good or good were classified as having good subjective health status in this study, while those who responded bad or very bad were classified as having poor subjective health status. Third, for the physical activity survey, the question “In the week prior to the survey, how many days did you engage in at least 10 minutes of moderate-intensity physical activity?” was posed, and the response ranged from a maximum of 7 days to a minimum of 0 days. Subjects who answered 5–7 days were classified as having a high physical activity level, while those who responded 0–2 days were classified as having a low physical activity level.
Prepandemic (2019) vs. early pandemic (2020) vs. late pandemic (2021) comparison
The current study compared the prepandemic (2019), early pandemic (2020), and late pandemic (2021) periods in terms of NFL use. The prepandemic year was the most recent year before the outbreak of COVID-19 in Korea; therefore, 2019 was regarded as the ‘prepandemic’ reference year.
The year 2020 was set as the ‘early pandemic’ year. On January 20, 2020, the first COVID-19 patient in Korea was diagnosed, and soon after, on March 11, 2020, the World Health Organization declared COVID-19 a ‘pandemic.’ The early pandemic year included the first wave (early February to early August 2020) and the second wave (mid-August to mid-November 2020) of COVID-19. In 2020, a total of 60,740 cases were reported in Korea, the incidence rate was 117 per 100,000 people, and the number of deaths was 1.58 per 100,000 people. As nationwide outbreaks began, national campaigns on strict social distancing (postponing or canceling gatherings, dining out, events, and travel, postponement of school openings, sufficient rest at home, refraining from going out, avoiding physical contact such as shaking hands, maintaining a healthy distance of 2 m, etc.) were implemented during the early pandemic period.
In 2021, even though strong restrictions and policies regarding COVID-19 were eased, COVID-19 was still prevalent. As of October 23, 2021, 70% national vaccination coverage was achieved, but even until the end of 2021, hygiene rules such as mask-wearing were maintained in all places, including public transportation and restaurants, in Korea. The late pandemic year included the third wave (mid-November 2020 to the end of January 2021) and the fourth wave (early July 2021 to mid-January 2022), when Delta variant mutations became dominant, and omicron variant mutations appeared and spread. In 2021, a total of 570,111 confirmed cases were reported, and among them, 4,663 people died, with a fatality rate of 0.82%. Thus, this study uses 2021 as the ‘late pandemic’ year. Summarizing the above, these 3 years reflected the special circumstances of each year before and after the pandemic.
Socioeconomic and health behavior survey
Regarding socioeconomic data, household type, housing type, annual income, occupation, and education level were surveyed. Regarding health behavior data, quality of life, smoking and drinking status, safety consciousness, dietary and nutritional behaviors, weight control, oral health, and mental health were surveyed.
NFL information and policies in Korea
NFLs display information about nutrients, such as the amount of nutrients contained in a food, food additives, functional foods and livestock products (Act on Labeling and Advertising of Foods, Republic of Korea Act No. 18445). The first country to propose the NFL system was the US. In the US, nutrition labeling was made mandatory for all packaged foods by the Nutrition Labeling and Education Act in 1990 and has been applied since 1994 [
12]. Shortly thereafter, nutrition labeling of processed foods was first enacted in Korea in 1996 by a Ministry of Health and Welfare notice (No. 95-67). The latest version of the Labeling Standards of Foods of Korea is provided and can be accessed in English from the Korea Ministry of Food and Drug Safety website (Notification No. 2019-97, revised on October 28, 2019).
To survey the level of NFL use, 2 NFL-related questions were asked. For all participants, “Are you aware of/Do you know about NFLs?” was asked, and for those who had awareness of NFLs, “Do NFLs affect your food choices?” was asked. According to the answers to both questions, the current study used 3 NFL usage ratios to evaluate the increase in NFL usage for each group between 2019, 2020, and 2021: the awareness, effect, and utilization ratios. Definitions of the ratios are provided in
Table 1. The ‘awareness’ ratio was the ratio of subjects who responded that they were aware of NFLs, regardless of whether they used NFL content, among the total participants. The ‘effect’ ratio was the ratio of subjects who responded that they used NFLs and that their food choices were affected (influenced) by NFLs among the total participants. The ‘utilization’ ratio was the ratio of subjects who responded that they used NFLs and that their food choices were affected by NFLs among the participants with NFL awareness.
Table 1Definition of the NFL use ratio in the current study
Complex sample weighted analysis and statistical method
A complex sample statistical analysis was conducted to account for the multi-stage stratified sampling design of the Korea Community Health Survey (KCHS). In the overall analysis, the weighted method was used to adjust for inclusion errors due to differences in the number of households and populations in the sample design and survey periods, the unequal extraction rate, and the nonresponse error of nonparticipants in the survey. The main weights included the household selection rate and the weight reflecting the household rate by housing type (household weight). Then, based on the resident population, weights (adjusted weights) corrected for the demographic structure by sex and age were applied. Regarding the general characteristics and survey results, noncontinuous variables are presented as numerical values and percentages, whereas continuous variables are presented as averages and means ± standard errors. The statistical significance of the awareness, effect, and utilization ratios of the years for each subgroup was evaluated by cross-tabulation. All data were analyzed using SPSS version 26.0 (IBM Corp., Armonk, NY, USA), and a 2-tailed p value of less than 0.05 was considered statistically significant.
RESULTS
Basic characteristics of the participants
Table 2 outlines the basic characteristics of all the included participants in 2019, 2020, and 2021. For each year, the mean age was from 54.23 to 54.98 years, and male subjects accounted for 44.8 to 45.6% of the total subjects in each year. The percentage of residents living in urban areas ranged from 56.2% to 56.4%. In the total population in 2019, 56.6% of subjects were aware of NFLs, and 19.0% of subjects’ food choices were affected by NFL content compared to 55.4% and 19.8% and 55.7% and 21.2% in 2020 and 2021, respectively. Additionally, smoking, alcohol consumption, DM and HTN, subjective health status, and physical activity were also analyzed each year. All p value among the 3 years were not significant.
Table 2Basic characteristics of the participants
Table 2
|
Characteristics |
Pre-pandemic (2019; n = 229,099) |
Early pandemic (2020; n = 229,269) |
Late pandemic (2021; n = 229,242) |
|
Age*
|
|
|
|
|
Mean age (yr) |
54.98 ± 0.37 |
54.23 ± 0.37 |
54.89 ± 0.37 |
|
Young |
37.5 (86,006) |
38.1 (87,414) |
37.5 (85,964) |
|
Middle |
29.9 (68,546) |
30.1 (69,043) |
30.0 (68,786) |
|
Elderly |
32.5 (74,547) |
31.8 (72,812) |
32.5 (74,492) |
|
Sex |
|
|
|
|
Male |
44.8 (102,572) |
45.3 (103,894) |
45.6 (124,744) |
|
Female |
55.2 (126,527) |
54.7 (125,375) |
54.4 (124,744) |
|
Region of residence |
|
|
|
|
Urban area |
56.2 (128,724) |
56.3 (129,042) |
56.4 (129,191) |
|
Rural area |
43.8 (100,375) |
43.7 (100,227) |
43.6 (100,051) |
|
Smoking |
|
|
|
|
Never, ex-smoker |
83.4 (191,133) |
83.7 (191,838) |
83.8 (192,229) |
|
Current smoker |
16.6 (37,966) |
16.3 (37,431) |
16.2 (37,013) |
|
Alcohol drinking |
|
|
|
|
Never, ex-drinker |
42.4 (97,073) |
44.6 (102,333) |
42.3 (96,895) |
|
≥ 1 glass a month |
57.6 (132,026) |
55.4 (126,936) |
57.7 (132,347) |
|
NFL use†
|
|
|
|
|
Awareness |
56.6 (129,723) |
55.3 (126,855) |
55.7 (127,578) |
|
Effect |
19.0 (43,602) |
19.8 (45,296) |
21.2 (48,544) |
|
Disease status |
|
|
|
|
Diabetes mellitus |
11.6 (26,502) |
11.7 (26,839) |
12.4 (28,477) |
|
Hypertension |
28.6 (65,601) |
27.9 (64,022) |
28.9 (66,271) |
|
Subjective health status |
|
|
|
|
Good |
34.0 (77,806) |
48.0 (109,967) |
40.6 (93,038) |
|
Normal |
44.7 (102,443) |
38.5 (88,391) |
42.5 (97,386) |
|
Poor |
21.3 (48,823) |
13.5 (30,903) |
16.9 (38,812) |
|
Physical activity‡
|
|
|
|
|
High (5–7 days/week) |
34.6 (79,325) |
36.1 (82,820) |
33.6 (76,930) |
|
Moderate (3–4 days/week) |
16.9 (38,605) |
17.2 (39,530) |
17.7 (40,473) |
|
Low (0–2 days/week) |
48.5 (111,144) |
46.6 (106,858) |
48.8 (111,781) |
NFL awareness ratios in the pre-, and pandemic years
Table 3 shows the comparison of the awareness ratios in 2019, 2020 and 2021. Overall, the awareness ratio showed a downward trend, and several groups showed a continuous downward trend.
Table 3Comparison of the NFL awareness ratios in 2019, 2020 and 2021
Table 3
|
Age*
|
Male |
Female |
|
2019 |
2020 |
2021 |
|
2019 |
2020 |
2021 |
|
|
Disease status |
|
|
|
|
|
|
|
|
|
Healthy |
|
|
|
|
|
|
|
|
|
|
Y*
|
69.0a (24,904) |
67.2b (25,055) |
61.7c (24,308) |
↓↓ |
81.7a (35,386) |
79.0b (34,351) |
78.6c (33,415) |
↓↓ |
|
|
M*
|
54.0a (9,836) |
51.2b (9,861) |
51.6c (9,649) |
↓ |
75.0a (18,916) |
72.2b (18,443) |
73.2c (18,493) |
↓ |
|
|
E*
|
33.8a (604) |
31.8b (3,820) |
33.2c (4,006) |
↓ |
40.1a (5,303) |
38.9b (5,228) |
42.6c (5,585) |
→ |
|
DM and/or HTN |
|
|
|
|
|
|
|
|
|
|
Y*
|
66.4a (2,728) |
65.4b (2,793) |
63.0b (2,960) |
↓↓ |
77.9a (1,600) |
75.3b (1,712) |
78.6c (1,722) |
→ |
|
|
M*
|
51.7a (6,066) |
49.6a (6,014) |
51.4b (6,255) |
↓ |
69.1a (7,662) |
66.0b (7,284) |
68.7c (7,570) |
↓ |
|
|
E*
|
33.4a (5,828) |
31.2b (5,184) |
33.2c (5,763) |
↓ |
33.3a (7,574) |
31.5b (7,110) |
33.5c (7,852) |
→ |
|
Subjective health status |
|
|
|
|
|
|
|
|
|
Good |
|
|
|
|
|
|
|
|
|
|
Y*
|
70.5a (13,961) |
68.5b (18,257) |
67.9c (15,557) |
↓↓ |
83.0a (16,443) |
80.0b (21,385) |
79.6bc (17,623) |
↓↓ |
|
|
M*
|
56.6a (6,497) |
53.0b (8,659) |
54.0bc (7,716) |
↓ |
77.2a (8,402) |
73.4b (11,870) |
74.4c (9,992) |
↓ |
|
|
E*
|
39.5a (3,105) |
35.7b (4,165) |
38.6c (3,944) |
↓ |
48.2a (2,717) |
42.1b (4,158) |
45.6c (3,632) |
↓ |
|
Poor |
|
|
|
|
|
|
|
|
|
|
Y*
|
66.4a (2,728) |
65.4b (2,793) |
63.0c (2,960) |
↓↓ |
77.9a (1,600) |
75.3b (1,712) |
78.6c (1,722) |
↓ |
|
|
M*
|
51.7a (6,066) |
49.6a (6,014) |
51.4b (6,255) |
↓ |
69.1a (7,662) |
66.0b (7,284) |
68.7c (7,570) |
↓ |
|
|
E*
|
33.4a (5,828) |
31.2b (5,184) |
33.2c (5,763) |
↓ |
33.3a (7,574) |
31.5b (7,110) |
33.5c (7,852) |
→ |
|
Physical activity†
|
|
|
|
|
|
|
|
|
|
High |
|
|
|
|
|
|
|
|
|
|
Y*
|
70.9a (15,482) |
68.6b (1,4084) |
68.2c (14,425) |
↓↓ |
82.7a (18,311) |
80.3b (15,258) |
79.8c (16,197) |
↓↓ |
|
|
M*
|
54.7a (7,670) |
51.7b (7,766) |
53.0ac (8,064) |
↓ |
74.0a (13,046) |
71.7b (12,383) |
73.1ac (12,980) |
↓ |
|
|
E*
|
35.6a (5,277) |
33.3b (4,945) |
35.0c (5,497) |
↓ |
40.7a (6,500) |
38.4b (6,293) |
41.1c (7,077) |
→ |
|
Low |
|
|
|
|
|
|
|
|
|
|
Y*
|
64.7a (8,134) |
64.3b (9,206) |
63.9c (8,358) |
↓↓ |
79.6a (11,642) |
77.6b (13,477) |
76.3c (11,519) |
↓↓ |
|
|
M*
|
50.5a (5,561) |
48.8b (5,468) |
47.8c (5,161) |
↓↓ |
71.1a (8,233) |
67.6b (8,158) |
69.0ac (7,741) |
↓ |
|
|
E*
|
27.4a (2,863) |
25.7b (2,538) |
28.1c (2,680) |
→ |
26.5a (3,917) |
26.4b (3,788) |
27.5c (3,735) |
→ |
In the healthy male group, the young subjects’ awareness ratio continuously decreased. In addition, the awareness ratio continuously decreased among young male subjects in the DM/HTN group. In the good subjective health status and male group, the awareness ratio of young subjects decreased continuously. In the poor subjective health and male group, the awareness ratio of young subjects decreased continuously. In the high physical activity and male group, the awareness ratio of young subjects decreased continuously. In addition, middle-aged subjects in the poor subjective health group showed a downward trend. In the low physical activity group, the awareness ratio of young male subjects decreased.
The trend of continuous decline was also shown in the subgroup of female subjects. In the healthy female group, young subjects’ awareness ratio continuously decreased. The awareness ratio of young subjects in the good subjective health status and female group also decreased continuously. In the high physical activity group, young subjects’ awareness ratio showed a continuous downward trend. In the low physical activity and female group, the awareness ratio of young subjects also decreased continuously (all p < 0.05).
NFL effect ratios in the pre-, and pandemic years
Table 4 shows a comparison of the effect ratios of NFL use in 2019, 2020 and 2021 in each group among all participants. Overall, the effect ratio showed an upward trend, and most groups showed a 3-year continuous upward trend.
Table 4Comparison of the NFL effect ratios in 2019, 2020 and 2021
Table 4
|
Age*
|
Male |
Female |
|
2019 |
2020 |
2021 |
|
2019 |
2020 |
2021 |
|
|
Disease status |
|
|
|
|
|
|
|
|
|
Healthy |
|
|
|
|
|
|
|
|
|
|
Y*
|
19.5a (6,665) |
21.5b (7,613) |
23.5c (8,146) |
↑↑ |
40.8 (17,363) |
40.4 (17,184) |
40.5 (17,055) |
NS |
|
|
M*
|
10.2a (1,702) |
11.8b (2,058) |
12.8c (19,088) |
↑↑ |
32.1a (7,507) |
32.6b (7,775) |
35.6c (8,504) |
↑↑ |
|
|
E*
|
6.3a (604) |
6.6b (701) |
8.2c (877) |
↑↑ |
23.2a (43,602) |
23.7b (45,296) |
25.0c (48,544) |
↑↑ |
|
DM and/or HTN |
|
|
|
|
|
|
|
|
|
|
Y*
|
20.2a (791) |
21.8b (880) |
22.4b (982) |
↑ |
41.3a (837) |
39.1a (840) |
41.7bb (889) |
↑ |
|
|
M*
|
10.0a (1,086) |
11.6b (1,257) |
13.2c (1,439) |
↑↑ |
26.8a (2,718) |
27.4b (2,753) |
30.9c (3,169) |
↑↑ |
|
|
E*
|
6.1a (992) |
6.2b (929) |
7.0c (1,158) |
↑↑ |
9.3a (1,907) |
9.0a (1,758) |
10.4b (2,253) |
↑ |
|
Subjective health status, % (n) |
|
|
|
|
|
|
|
|
|
Good |
|
|
|
|
|
|
|
|
|
|
Y*
|
21.6a (4,006) |
23.0b (5,830) |
25.3c (5,572) |
↑↑ |
43.0 (8,373) |
42.1 (10,998) |
42.3 (9,293) |
NS |
|
|
M*
|
12.0a (1,251) |
13.4b (1,986) |
14.9c (1,909) |
↑↑ |
35.2a (3,537) |
33.2b (5,137) |
37.9c (4,799) |
→ |
|
|
E*
|
8.3a (579) |
8.3b (847) |
9.9c (912) |
↑↑ |
16.3a (834) |
14.8b (1,316) |
17.9c (1,321) |
→ |
|
Poor |
|
|
|
|
|
|
|
|
|
|
Y*
|
18.5a (490) |
20.0b (310) |
23.1c (484) |
↑↑ |
37.7 (1,331) |
36.8 (769) |
37.6 (1,188) |
NS |
|
|
M*
|
8.6a (340) |
11.0bc (229) |
10.1c (301) |
↑ |
24.2a (1,431) |
23.5b (789) |
27.5c (1,264) |
→ |
|
|
E*
|
3.9a (346) |
3.2b (187) |
4.1a (287) |
→ |
5.9a (941) |
5.5b (521) |
6.8c (873) |
→ |
|
Physical activity†
|
|
|
|
|
|
|
|
|
|
High |
|
|
|
|
|
|
|
|
|
|
Y*
|
22.2a (4,684) |
24.2b (4,800) |
25.5c (5,300) |
↑↑ |
42.5 (9,360) |
43.2 (8,025) |
43.1 (8,473) |
NS |
|
|
M*
|
11.6a (1,547) |
13.3b (1,795) |
15.0c (2,065) |
↑↑ |
32.6a (5,350) |
32.6b (5,296) |
36.1c (6,078) |
↑↑ |
|
|
E*
|
7.1a (937) |
7.2b (960) |
8.6c (1,262) |
↑↑ |
12.7a (1,840) |
12.5b (1,813) |
14.9c (2,347) |
→ |
|
Low |
|
|
|
|
|
|
|
|
|
|
Y*
|
14.4a (1,666) |
16.6b (2,250) |
18.2c (2,210) |
↑↑ |
36.2 (5,170) |
36.3 (6,177) |
35.5 (5,331) |
NS |
|
|
M*
|
7.5a (750) |
8.6b (892) |
8.9c (892) |
↑↑ |
25.3a (2,732) |
27.4b (2,983) |
29.0c (3,044) |
↑↑ |
|
|
E*
|
3.7a (373) |
4.2b (365) |
4.8c (431) |
↑↑ |
6.4a (839) |
6.9b (855) |
7.8c (953) |
↑↑ |
The healthy male group showed an increasing effect ratio over 3 consecutive years across all age groups. The good subjective health status and male group showed an increasing effect ratio for the 3 years in all age groups. Additionally, the high physical activity and male group showed an increasing effect ratio for 2019, 2020 and 2021 in all age groups. The low physical activity and male group also showed an increasing effect ratio for the 3 years in all age groups (all p < 0.05).
In the subgroup of female subjects, there was a 3-year consecutive increase from 2019 to 2021, mainly in the middle-aged and elderly groups. The healthy female group showed an increasing effect ratio for the 3 consecutive years in the middle-aged and elderly groups. The low physical activity and female group showed an increasing effect ratio for 3 consecutive years in the middle-aged and elderly groups (all p < 0.05).
NFL utilization ratios in the pre-, and pandemic years
The utilization ratio of NFLs among those who were aware of NFLs was evaluated, and the overall results showed an increase in the ratio from 2019 to 2021.
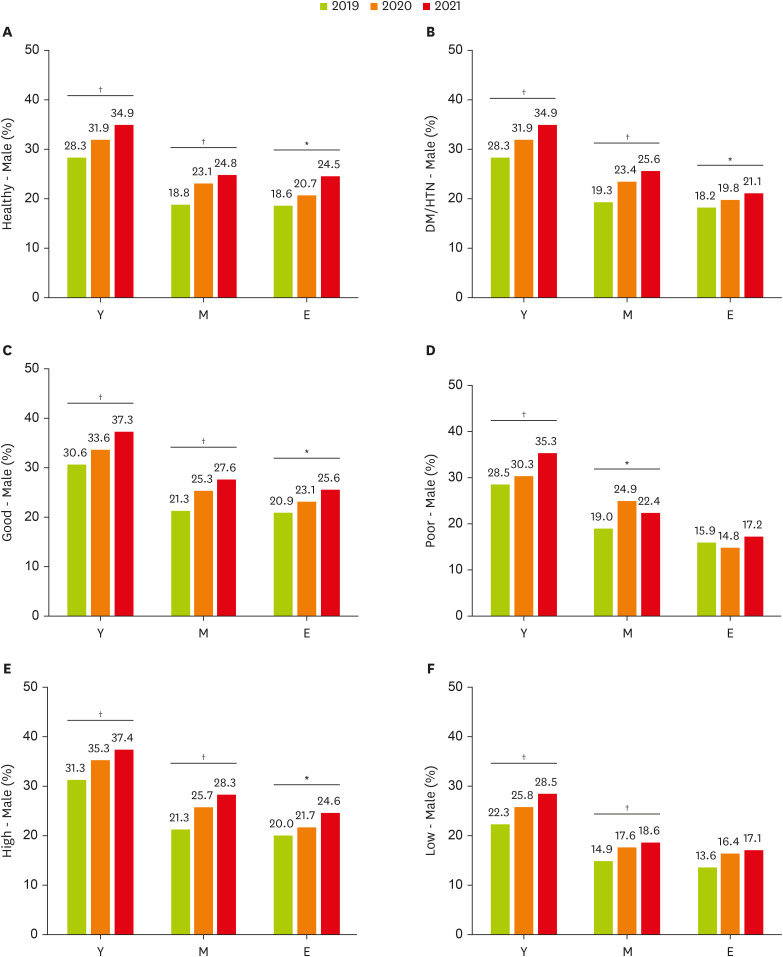
The NFL utilization ratio comparisons in the 3 years within subgroups of male subjects are presented in
Figure 1. Among healthy men, all age groups showed consecutive increases in the NFL utilization ratio; the ratio in the young group increased by 6.6%, the ratio in the middle-aged group increased by 6.0%, and the ratio in the elderly group increased by 5.9% in 2021 compared to 2019. Among males with DM/HTN, all age groups showed consecutive increases in the NFL utilization ratio; the ratio in the young group increased by 6.6%, the ratio in the middle-aged group increased by 6.3%, and the ratio in the elderly group increased by 2.9% in 2021 compared to 2019. Among men with a good subjective health status, all age groups showed consecutive increases in the NFL utilization ratio; the ratio in the young group increased by 6.6%, that in the middle-aged group increased by 6.3%, and that in the elderly group increased by 4.7% in 2021 compared to 2019. Among men with high physical activity levels, all age groups showed a consecutive increase in the NFL utilization ratio; the ratio in the young group increased by 6.1%, that in the middle-aged group increased by 7.0%, and that in the elderly group increased by 4.6% in 2021 compared to 2019 (all p < 0.05).
Figure 2 shows NFL utilization ratio comparisons among female subjects in 2019, 2020 and 2021. Among healthy women, all age groups showed consecutive increases in the NFL utilization ratio; the ratio in the young group increased by 1.7%, the ratio in the middle-aged group increased by 5.9%, and the ratio in the elderly group increased by 7.6% in 2021 compared to 2019. Among women with high physical activity levels, all age groups showed a consecutive increase in the NFL utilization ratio; the ratio in the young group increased by 2.5%, that in the middle-aged group increased by 5.3%, and that in the elderly group increased by 5.1% in 2021 compared to 2019 (all p < 0.05). Some female subgroups showed a decreasing utilization ratio, but it was not statistically significant.
DISCUSSION
The COVID-19 pandemic has brought about a new era, especially in terms of nutrition intake and food consumption. Given the role of NFLs in healthy eating [
13], it is worth investigating the increase in NFL usage during the pandemic.
This study showed that despite the declining awareness of NFLs in the Korean population, the proportion of those who were affected by the NFL content in the entire population and the utilization ratio among those who were aware of NFLs increased continuously during the early and late pandemic periods. This study has the following novel characteristics. First, using a nationally stratified weighted sample, the data of more than 600,000 subjects from Korea were surveyed/analyzed for 3 consecutive years. In addition, time-series analysis was performed in each subgroup according to factors that influenced NFL awareness and usage, such as sex, age, DM/HTN, subjective health status, and physical activity.
NFL awareness decreased as the pandemic progressed in this study. Because NFLs are a government-driven policy, campaigns and promotions/publicity in public health centers and national health insurance agencies are important for raising awareness of NFLs. During the pandemic, given that most countries focused their capacity on preventing the spread of the pandemic and reducing COVID-19 morbidity and mortality [
14], campaigns or education that could increase the awareness of NFLs were not possible. At that time, urgent government policies induced citizens to pay more attention to other information, such as hygiene rules, quarantine policies, and lifestyle modifications, rather than NFLs [
15]. In Korea, due to the surge in COVID-19 infections, public health centers suspended all public services except for essential COVID-19 testing and patient management for approximately 2 years since the COVID-19 outbreak in early 2020, and general health classes, nutrition counseling, basic checkups, and health programs for children/pregnant women/elderly individuals were resumed sequentially beginning in July 2022. Thus, it can be assumed that the decrease in awareness during the study period might have been due to the lack of government-oriented NFL education during the pandemic.
Notably, the utilization ratio, which is defined as the ratio of use and influence of NFL content among the subjects who reported that they were aware of NFLs in this study, increased continuously from 2019 to 2021. This indicates that a larger percentage of people in the early and late pandemic years than in the prepandemic year understood nutritional information and made informed decisions for a healthy diet through NFLs. The reason for Korea’s increased NFL utilization during the pandemic could be due to the following aspects: lasting perceived pandemic risk and fear, growing nutritional knowledge, a shift to online grocery shopping, and the expansion of new food product purchases.
First, how people perceived COVID-19 risk could have affected NFL utilization. Perceived risk is a concept that encompasses the likelihood of harm or expected mortality to the complexity of uncertain fear and catastrophic potential [
16]. Bruine de Bruin and Bennett [
17] reported that during the early pandemic in May 2020, more protective health behaviors were adopted by people who felt at greater risk of contracting COVID-19. A study reported that the risk perception of COVID-19 was uniformly high across all national surveys in Spain, Chile, and the United Kingdom (UK), which led to higher consumer interest and attitudes toward health claims [
18]. Although no study has investigated changes in the perceived pandemic risk in Korea over time, a comparison of the perceived pandemic risk in China and Korea revealed that the risk perception of infection in Korea was larger than that in China, the epicenter of COVID-19 [
19]. Therefore, Korea’s high risk perception of COVID-19 fundamentally increased health consciousness and led to healthier dietary behaviors, such as those influenced by NFL content.
Moreover, the fear of the pandemic itself may have led to improvements in nutritional behaviors and NFL usage. Kowalczuk and Gebski’s study [
20] revealed that Polish adults who reported a fear of the pandemic ate more regularly and had greater interest in the nutritional quality of their food than subjects who were moderately afraid. In particular, the group that feared the pandemic showed favorable changes in food consumption, with notable decreases in animal fat, alcoholic beverage, snack, and soft drink consumption, while the moderate fear group showed a decrease in the consumption of eggs, meat, fish, juice, and dietary supplements and an increase in animal fat intake. Moreover, Grunert et al. [
21] reported a tendency of food consumers in the UK to use NFLs more when they chose healthier products, with high rates of yogurt (38%) and meal replacement cereal (34%) consumption, whereas they had low utilization rates of NFLs when consuming products such as salty snacks (22%) and confectioneries (16%). Additionally, Kim et al. [
22] analyzed the mediating effect of COVID-19 psychiatric factors on the information-seeking and prevention behaviors of 1,970 Korean participants during the early pandemic. The results of the study showed that time spent seeking information was positively associated with fear of COVID-19 (men: β = 0.145, p < 0.001; women: β = 0.168, p < 0.001), and fear of COVID-19 was found to mediate the association with information-seeking preventive behaviors (men: effect size [ES], 0.034; women: ES, 0.052). Thus, the fear caused by the pandemic would have made people choose healthier foods, and in this context, they would have increased their use of NFLs.
Second, exploring the increase in nutritional knowledge could support the greater use of NFLs. Arfaoui et al. [
23] reported an association between nutritional knowledge and frequency of NFL use. In the study, 88% of the subjects in the always/sometimes NFL use group had a high and moderate nutrition knowledge score, whereas the ratio in the rarely/never NFL use group was only 74%, and the relationship between knowledge and use was significant in the regression model. Moreover, as the pandemic unfolded, the public was exposed to a great deal of health-related knowledge, and nutritional information was continuously sought and delivered through the internet. Google Trends has been used in many studies to analyze the search behavior and interest of the public during the pandemic. A study conducted in Italy analyzed Google Trends for a 234-week prepandemic to pandemic (January 2018 to June 2022) period [
24]. In that study, public interest in fruit, vegetables, milk, and whole grains surged as a trigger for the COVID-19 outbreak, and the highest search peak was observed during the first COVID-19 lockdown. Additionally, Hamulka et al. [
2] analyzed the worldwide correlation between cumulative COVID-19 cases/deaths and immune-related nutrients and bioactive compounds with a search query relative search value. Moderate and strong correlations were observed for vitamin C, vitamin D, zinc, lactoferrin, onion, garlic, ginger, turmeric, and honey. Considering that internet searches were usually the only source of nutrition knowledge in a non-face-to-face situation, the consistency of nutrition/dietary information seeking during the pandemic supported the increased utilization of NFLs.
Third, an increase in the purchase of packaged food and the frequency of the purchase of foods with NFLs could be another explanation for the higher utilization of NFLs after the pandemic. NFLs are primarily found on packaged and distributed foods, and it has been reported that most foods have an NFL or are exempt. Recently, purchasing groceries online has become more popular in the wake of COVID-19. Additionally, the frequency of grocery shopping has increased due to the expansion of home cooking during the pandemic [
25]. Furthermore, modified dietary habits due to the pandemic have led to the consumption of new food products such as retort pouches, ready-to-eat meals, and delivered and cooked dishes [
26]. Thus, given that most of the food that can be ordered online is packaged, this shift in food purchasing channels and increased possibilities of new food product purchases would undoubtedly increase the opportunity for people to encounter and utilize foods with NFLs.
The framework of this study analyzed NFL awareness and utilization ratios by disease status, subjective health status, and physical activity level groups. Overall, in all divided groups, NFL awareness ratios decreased during the pandemic period, while NFL effect and utilization ratios increased, so it can be said that NFL awareness and use did not differ across subgroups. This suggests that the presumed situations, such as pandemic fear and new food product purchases mentioned above, may have had a stronger uniform effect on NFL awareness and use than the individual’s health status.
NFLs on food packages are an important source of nutritional information but are usually underutilized. In the current study, the proportion of subjects who said they were aware of NFLs ranged from 25.7% (the group of elderly men with low physical activity levels) to 83.0% (the group of young women with good subjective health status) in the total population. Are these ratios high or low? There was no analysis of NFL usage by subgroup during the pandemic, so I was unable to make a numerical comparison of these results. However, there are limited but point-in-time results from other Asian countries during the pandemic. According to an online survey conducted with a convenience sample of Malaysian residents [
27], 45% reported always reading NFLs, and 28% responded that they occasionally read NFLs when buying food during lockdown. Additionally, Luo et al. [
28] conducted a study examining the knowledge of food safety and nutrition among 2,272 adults in 27 provinces of China during the COVID-19 pandemic by online survey, and 55.9% of respondents reported being aware of NFLs. The average NFL awareness of all subjects in 2020-2021 in this study was 55.6%, which is in line with the results above. However, these results, including the KCHS data in this study, may be higher than the actual use of NFLs. This is because self-reported behaviors sometimes lead to excessive reporting of behaviors in the case of retrospective responses [
29]. In one in-store observation study, only 27% of shoppers were found to have looked at the nutrition information on NFLs [
21], which is significantly lower than self-reported results. Therefore, it is necessary to consider that self-reported results might be higher than the actual use of NFLs when interpreting the results of the current study.
This study has the following limitations, and thus the results should be interpreted with caution. The cross-sectional design did not allow causation to be determined, and this study was only able to demonstrate an association between increased NFL utilization and the COVID-19 pandemic. However, since this study collected data from more than 600,000 people and analyzed 3 consecutive years, the cross-sectional research method can be considered a time- and cost-effective method for evaluating responses from a large population. Although inferred reasons for the decrease in NFL awareness and increase in NFL utilization were sufficiently derived from the discussions above, further research is needed with the use of experimental or deductive methods. In particular, this study could not analyze how the intake of the 9 nutrients listed in the NFLs was affected by the pandemic due to the absence of actual intake data from the KCHS. However, given recent research suggesting that NFL awareness and use may increase actual dietary intake of other micronutrients beyond those listed on the NFL during the pandemic period [
30], the increased effect and utilization ratio of NFL over the 3-year period in this study may have had a positive effect on adequate intake of both mandatory and non-mandatory NFL-labeled nutrients.
Despite its limitations, this study has the following implications. First, this study highlights the need for more education and public awareness programs to enhance NFL use for the adoption of healthy dietary choices. Next, nutrition experts and policy-makers need to make efforts to maintain interest in NFL use, which increased in the wake of the pandemic, and it is necessary to develop NFLs into communication tools that provide in-depth information and accurate health claims in non-face-to-face situations. Last, in an era in which pandemics may occur in the future, NFLs can be an effective and simple method of urgent food information distribution, so the movement to establish an international standard for NFLs can be expected.
CONCLUSION
In conclusion, despite the decrease in awareness of NFLs in the overall Korean population, the utilization of NFLs among subjects who were aware of NFLs continued to increase during the pre-, early, and late pandemic periods. A conventional but well-regulated and effective tool, NFLs may have enabled the Korean population to make healthy food choices during the pandemic.
National Research Foundation of Koreahttps://doi.org/10.13039/501100003725
2022R1I1A1A01066215
NOTES
-
Funding: This research was supported by the Basic Science Research Program through the National Research Foundation of Korea (NRF) funded by the Ministry of Education (2022R1I1A1A01066215).
-
Conflict of Interest: The author declares that they have no competing interests.
REFERENCES
- 1. de Faria Coelho-Ravagnani C, Corgosinho FC, Sanches FF, Prado CM, Laviano A, et al. Dietary recommendations during the COVID-19 pandemic. Nutr Rev 2021;79:382-393.
- 2. Hamulka J, Jeruszka-Bielak M, Górnicka M, Drywień ME, Zielinska-Pukos MA. Dietary supplements during COVID-19 outbreak. Results of google trends analysis supported by PLifeCOVID-19 online studies. Nutrients 2020;13:54.
- 3. García-Saisó S, Marti M, Brooks I, Curioso WH, González D, et al. The COVID-19 infodemic. Rev Panam Salud Publica 2021;45:e56.
- 4. O’Hara JK, Woods TA, Dutton N, Stavely N. COVID-19’s impact on farmers market sales in the Washington, DC, area. J Agric Appl Econ 2021;53:94-109.
- 5. Cho JM. Increased dependency on dietary supplements for calcium, vitamin B1 and vitamin C intake during the COVID-19 pandemic among healthy adults: data from the eighth Korea National Health and Nutrition Examination Survey (2019–2020). Hum Nutr Metab 2024;36:200252.
- 6. Buyuktuncer Z, Ayaz A, Dedebayraktar D, Inan-Eroglu E, Ellahi B, et al. Promoting a healthy diet in young adults: the role of nutrition labelling. Nutrients 2018;10:1335.
- 7. Kollannoor-Samuel G, Shebl FM, Hawley NL, Pérez-Escamilla R. Nutrition label use is associated with lower longer-term diabetes risk in US adults. Am J Clin Nutr 2017;105:1079-1085.
- 8. Filippou CD, Tsioufis CP, Thomopoulos CG, Mihas CC, Dimitriadis KS, et al. Dietary approaches to stop hypertension (DASH) diet and blood pressure reduction in adults with and without hypertension: a systematic review and meta-analysis of randomized controlled trials. Adv Nutr 2020;11:1150-1160.
- 9. Kyle TK, Thomas DM. Consumers believe nutrition facts labeling for added sugar will be more helpful than confusing. Obesity (Silver Spring) 2014;22:2481-2484.
- 10. Roseman MG, Joung HW, Littlejohn EI. Attitude and behavior factors associated with front-of-package label use with label users making accurate product nutrition assessments. J Acad Nutr Diet 2018;118:904-912.
- 11. Kempen EL, Muller H, Symington E, Van Eeden T. A study of the relationship between health awareness, lifestyle behaviour and food label usage in Gauteng. South Afr J Clin Nutr 2012;25:15-21.
- 12. Weimer J. Accelerating the trend toward healthy eating: public and private efforts. In: Frazao E, editor. America’s eating habits: changes and consequences. Washington, D.C.: US Department of Agriculture, Economic Research Service, 1999. p. 385-401.
- 13. Song J, Brown MK, Tan M, MacGregor GA, Webster J, et al. Impact of color-coded and warning nutrition labelling schemes: a systematic review and network meta-analysis. PLoS Med 2021;18:e1003765.
- 14. Emanuel EJ, Osterholm M, Gounder CR. A national strategy for the “new normal” of life with COVID. JAMA 2022;327:211-212.
- 15. Kang J, Jang YY, Kim J, Han SH, Lee KR, et al. South Korea’s responses to stop the COVID-19 pandemic. Am J Infect Control 2020;48:1080-1086.
- 16. Slovic P. Understanding perceived risk: 1978–2015. Environment 2016;58:25-29.
- 17. Bruine de Bruin W, Bennett D. Relationships between initial COVID-19 risk perceptions and protective health behaviors: a national survey. Am J Prev Med 2020;59:157-167.
- 18. Bou Fakhreddine L, Martínez MG, Sánchez M, Schnettler B. Consumers’ willingness to pay for health claims during the COVID-19 pandemic: a moderated mediation analysis. J Agric Food Res 2023;11:100523.
- 19. Chen Y, Feng J, Chen A, Lee JE, An L. Risk perception of COVID-19: a comparative analysis of China and South Korea. Int J Disaster Risk Reduct 2021;61:102373.
- 20. Kowalczuk I, Gębski J. Impact of fear of contracting COVID-19 and complying with the rules of isolation on nutritional behaviors of polish adults. Int J Environ Res Public Health 2021;18:1631.
- 21. Grunert KG, Wills JM, Fernández-Celemín L. Nutrition knowledge, and use and understanding of nutrition information on food labels among consumers in the UK. Appetite 2010;55:177-189.
- 22. Kim K, Yang J, Jeon YJ, Lee YJ, Lee Y, et al. The effects of information-seeking behaviours on prevention behaviours during the COVID-19 pandemic: the mediating effects of anxiety and fear in Korea. Epidemiol Health 2021;43:e2021085.
- 23. Arfaoui L, Alkhaldy A, Alareeshi A, AlSaadi G, Alhendi S, et al. Assessment of knowledge and self-reported use of nutrition facts labels, nutrient content, and health claims among Saudi adult consumers. J Multidiscip Healthc 2021;14:2959-2972.
- 24. Maugeri A, Barchitta M, Perticone V, Agodi A. How COVID-19 pandemic has influenced public interest in foods: a Google Trends analysis of Italian data. Int J Environ Res Public Health 2023;20:1976.
- 25. Gerritsen S, Egli V, Roy R, Haszard J, De Backer C, Teunissen L, et al. Seven weeks of home-cooked meals: changes to New Zealanders’ grocery shopping, cooking and eating during the COVID-19 lockdown. J R Soc N Z 2021;51:S4-S22.
- 26. AlTarrah D, AlShami E, AlHamad N, AlBesher F, Devarajan S. The impact of coronavirus COVID-19 pandemic on food purchasing, eating behavior, and perception of food safety in Kuwait. Sustainability (Basel) 2021;13:8987.
- 27. Khuan WS, Lin PKC. COVID-19 pandemic: Malaysians on food label and purchase amid lockdown. Proceedings of International Conference on Advanced Marketing (ICAM)-2021. Sri Lanka: University of Kelaniya; 2021.
- 28. Luo Y, Chen L, Xu F, Gao X, Han D, et al. Investigation on knowledge, attitudes and practices about food safety and nutrition in the China during the epidemic of corona virus disease 2019. Public Health Nutr 2021;24:267-274.
- 29. Cowburn G, Stockley L. Consumer understanding and use of nutrition labelling: a systematic review. Public Health Nutr 2005;8:21-28.
- 30. Cho JM. Nutrition fact label (NFL) use is related to meeting the requirements for vitamins and minerals not listed on NFLs: data from the Korea National Health and Nutritional Examination Survey VIII (2019-2021) for the prepandemic and pandemic periods. PLoS One 2023;18:e0296268.


 ), 2020 (
 ) and 2021 (
 ) among males. Values are presented as percentages (%, weighted results). The p values of the NFL utilization ratio in the different years for each group are derived from the χ2 test of complex sample analysis. Age group: Y (young, 19 to 49 years old); M (middle aged, 50 to 64 years old); E (elderly, 65 years and older).