ABSTRACT
As the proportion of the elderly population increases rapidly, interest in musculoskeletal health is also emerging. Here, we investigated how antioxidant vitamin intake and musculoskeletal health are related. Adults aged 50 to 80 years with a body mass index (BMI) of 18.5 to 27.0 kg/m2 were included. Bone mineral density (BMD), lean mass (LM), appendicular skeletal muscle mass index (ASMI) were measured using dual-energy X-ray absorptiometry (DXA), and the grip strength and knee extension using hand dynamometer. Nutrient intakes were measured using a 24-hour recall questionnaire. A total of 153 adults (44 men and 109 women) participated in this study. A partial correlation analysis showed a significant positive relationship between vitamin E and BMD and between vitamin C and LM/Height. Participants were classified into three groups according to whether their vitamin E and C intake met the recommended intake for Dietary Reference Intakes for Koreans (KDRIs). The prevalence of having low T-score (< −1.0) and low ASMI (< 7.0 for men and < 5.4 for women) was 51.3% and 15.4% in the group with vitamins C and E intakes below KDRIs. After adjusting for sex, smoking status and energy, protein, vitamin D, and calcium intake, the group with vitamins C and E both below the KDRIs displayed a significantly lower BMD at all test sites and LM/Height compared with vitamin C and/or E intake above the KDRIs groups. We conclude that sufficient intake of vitamin E and C is important for maintaining BMD and lean mass in Korean adults over 50 years of age.
-
Keywords: Antioxidants; Vitamin E; Vitamin C; Bone density; Dietary Reference Intake
INTRODUCTION
South Korea is one of the fastest aging countries in the world. According to the Korean Statistical Information Service, the population of elderly 65 years of age or older accounted for 15.7% in 2020; it is expected to exceed 20.0% in 2025, at which point it will become a super-aged society [
1]. Along with these demographic changes, the aging of the musculoskeletal system is emerging as a major concern in public health. For example, the prevalence of osteoporosis and related fractures are increasing at a much faster rate than the increase in the elderly population in Korea [
2]. Since being registered under the International Classification of Diseases, Tenth Revision (ICD-10) code in 2016, efforts to treat and diagnose sarcopenia have been increasing worldwide [
3]. South Korea has recently included the diagnosis code for sarcopenia in its 8th revision of the Korean classification of diseases [
4].
Adults over the age of 50 years commonly experience a decline of bone density and muscle mass as they age. In particular postmenopausal women experience bone loss associated with lower levels of sex steroids in their 50s [
5]. Their rate of muscle mass loss is around 1.0%–2.0% per year, and their resulting muscle strength is lost at a rate of 1.5%–3.0% per year [
6]. Importantly, both the structural properties of bone and muscle and their functional properties show a significant decline with aging [
7]. With time, older adults pass generally through a state of pre-frailty than can lead to frailty and disability [
8]. In real terms, the risk of falls and a loss of autonomy increases in the elderly, which can lead to a corresponding increase in morbidity and medical costs [
9,
10].
Though there is no current agreement on the biological mechanisms that explain the aging of the musculoskeletal system, it is becoming progressively more important to clarify relevant mechanisms in order to prevent or treat related disorders. As one of the possible mechanisms, there is a hypothesis that oxidative stress induced by increased reactive oxygen species (ROS) due to mitochondrial dysfunction can lead to cellular damage, which can explain age-dependent changes in both bone and muscle [
11]. In terms of bone structural integrity, the increased ROS inhibits the proliferation and maturation of osteoblasts, resulting in a reduced bone matrix mineralization [
11,
12]. In one study, there was a significantly increased level of oxidative stress-related biomarkers in the osteoporosis population compare to the control group [
13]. This increase in ROS not only damages mitochondrial DNA, leading to the apoptosis of muscle fibers [
11,
14], but also induces the expression of inflammatory cytokines such as interleukin-6 and C-reactive protein, which increases the risk of a decrease in muscle strength in older men and women [
15]. The fact that the muscles in older adults have an increase in oxidative stress biomarkers supports this hypothesis [
16]. Thus, the imbalance between the production of ROS and the antioxidant defense system in older adults can be posited to be associated with age-related musculoskeletal disorders.
As oxidative stress has been reported to affect the age-related loss of bone and muscle, the possible role of dietary antioxidants to neutralize effects on free radicals has also been discussed. However, definitive conclusions from this research remains unclear, with most studies focusing on the intake of vitamins C and E. One of the reasons for lack of research on other antioxidant vitamins pertains to the difficulty of estimating the exact intake of flavonoids due to the different molecular structure and bioavailability of flavonoid types [
17] and the lack of a comprehensive food database [
18]. Carotenoids, natural pigment in plants, are classified into two types depending on whether they can be converted to retinol (vitamin A). Few studies have shown that a higher bone mineral density (BMD) was significantly related with the intake of total carotenoids, β-carotene, or lycopene [
19,
20]. The low intake or concentration of carotenoids was reported to be associated with low muscle strength or physical performance [
21,
22]. On the other hand, vitamin A, a known antioxidant vitamin, has been reported to reduce BMD and ultimately increase the risk of hip fractures when consumed in an excessive amount [
23].
An adequate intake of antioxidant vitamins is, therefore, proposed as one of the ways to prevent or treat musculoskeletal disorders caused by aging [
24]. These vitamins, including vitamin A, vitamin E, and vitamin C, effectively scavenge ROS [
25], and in particular vitamin C in important as it regenerates vitamin E from radicals [
26]. In addition, vitamin C is also involved in synthesizing collagen and carnitine, as well as stimulating the formation osteoblasts [
27]. And as vitamin E is a lipid-soluble antioxidant, it can repair plasma membrane damage during senescence [
28] The use of retinol is still uncertain, though it is known that it participates in the processes of protein metabolism, collagen formation, and lipid oxidation [
29].
Since no effective pharmacological treatment is available once osteoporosis or sarcopenia has already progressed, it becomes important to attenuate bone or muscle loss by modifying lifestyle in advance. Until now, only nutrients such as protein, vitamin D, and calcium have been highlighted for use in the prevention or treatment of osteoporosis or sarcopenia. Studies on antioxidant vitamin intake and musculoskeletal health remain insufficient, with inconsistent results. Therefore, this study investigates the following: i) what type of antioxidant vitamins are closely related to bone and muscle health of those aged from 50–80 years, and ii) whether their antioxidant vitamin intake relative to the Dietary Reference Intakes for Korean (KDRIs) is related to these musculoskeletal parameters.
MATERIALS AND METHODS
Study population
Participants were healthy adults aged from 50 to 80 years recruited between July 2019 and January 2020. Measurements and tests were conducted at Ajou University Hospital in Suwon, Gyeonggi-do, Korea. This study was approved by the Ethics Committee of Ajou University Hospital (No. AJIRB-MED-FOD-19/048).
Inclusion criteria included adults aged from 50 to 80 years and those with a body mass index (BMI) range of 18.5 to 27.0 kg/m2. Those who consume more than 1,000 IU of vitamin D per day or take steroid drugs, those who are on a therapeutic diet for disease management, and those with other chronic disease such as diabetes and cirrhosis were excluded from this study. All participants were informed about this study and voluntarily agreed to participate in the study.
Measurement
General information
A questionnaire was used to obtain general information, and included smoking status, education level, living status, and weight history. Participants who currently smoke even a single cigarette were considered as ‘currently smoking’. ‘Education level’ was classified into elementary school graduation or lower, middle school graduation, high school graduation, and college graduation or higher. ‘Living status’ was classified as those living with their family and those living alone. For ‘weight history’, we asked participants to recall their weight at the age of 25, and weight was categorized into 3 groups: weight losers (> 3.0% loss), weight maintainers (± 3.0%), and weight gainers (> 3.0% gain).
Dual-energy X-ray absorptiometry (DXA) scan and anthropometric measurement
Body composition and BMD were measured using a DXA system (Lunar iDXA; Ge Health Care, Madison, WI, USA). BMD (g/cm
2) was measured at the lumbar spine, femur, and total body. Participants with T-score less than −1.0 at the lumbar spine or femur sites were defined as having low T-score [
30]. The total mass (weight, kg), lean body mass (LM) (kg), appendicular skeletal muscle mass (ASM) (kg), and percent body fat (%) were also measured by DXA scans, and then adjusted for body size using the following calculations: BMI = Weight (kg)/Height(m
2), LM/Height = LM (kg)/Height (m
2), Appendicular Skeletal Muscle Mass Index (ASMI) = ASM (kg)/Height(m
2), ASM/BMI = ASM (kg)/BMI (kg/m
2). Participants were defined as having a low ASMI if the ASMI was < 7.0 kg/m
2 for men and < 5.4 kg/m
2 for women, based on criteria of the Asian Working Group for Sarcopenia [
31].
Height was measured using an electronic scale (GL-150; G-tech International, Uijeongbu, Korea), and recorded to the nearest 0.1 cm.
Muscle strength & physical activity
To evaluate muscle strength, grip strength and knee extension were used as indexes. We used grip strength, as worldwide the criteria for diagnosing sarcopenia includes the measurement of grip strength [
32]. Although knee extension is also known to reflect limb muscle strength in older adults, it is less used than grip strength because of its difficulty of measurement.
The grip strength (kg) of both hands was assessed three times using a hand grip dynamometer (Jamar Plus+ Digital Hand Dynamometer; Jamar, Anaheim, CA, USA), and we used the highest score for analysis. Participants were defined as having low grip strength if their grip strength was < 28.0 kg in men and < 18.0 kg in women, according to criteria of the Asian Working Group for Sarcopenia [
31,
32]. Knee extension strength was assessed using a hand-held dynamometer (MicroFET2, HOGGAN Ergo; Hoggan Scientific LLC, Salt Lake City, UT, USA), obtained by measuring both sides three times, in which the highest score was again used for analysis. This method more easily measures the knee extension strength and has been proven to be more valid and reliable compared to an isokinetic dynamometer [
33].
Physical activity was assessed based on the International Physical Activity Questionnaire (IPAQ). The time of physical activity over the last 7 days was investigated according to the intensity of activity, and then converted to metabolic equivalents (MET) (min/week). Those having a MET above 600 were considered physically active [
34].
Quality of life
Health-related quality of life was evaluated by the Korean Health-related Quality of Life Instrument with 8 Items (HINT-8), which gives weights for each quality of life area [
35]. HINT-8 consists of items asking participants about their degree of difficulty in climbing stairs, working, sleeping, and remembering, and their current status pertaining to feeling pain, vitality, depression, and happiness. It was developed by the Korea Centers for Disease Control & Prevention to more accurately measure a health-related quality of life that fits the characteristics of Koreans, and to be used in the Korea National Health and Nutrition Examination Survey (KNHANES). The higher its score, the higher the quality of life.
Eating habits & dietary intake
Nutrient intake, including total energy, protein, vitamin, and mineral intake, were measured using a 24-hour recall method. A trained dietitian investigated meal intake of the day before the test.
Daily eating habits and the use of vitamin supplements were investigated through a questionnaire.
The web-based Computer Nutrition Analysis Program (CAN-Pro) version 5.0 (The Korean Nutrition Society, Seoul, Korea) was used for the diet analysis.
After a correlation analysis to determine which antioxidant vitamin is related to musculoskeletal indices, the participants were grouped according to whether the vitamin intake met the requirements for adequate intake (AI) or the reference nutrient intake (RNI), as stated in the 2020 KDRIs [
36].
Results are expressed as mean (standard deviation, SD) or number of participants (%). Normal distribution tests were performed on all continuous variables. Between-group differences were evaluated using an independent t-test for continuous variables and a χ2 test for categorical variables. An analysis of variance (ANOVA) and analysis of covariance (ANCOVA) were also used, and Bonferroni’s post hoc analysis was conducted in order to evaluate the between-group differences. The relationship between vitamin intake and variables such as BMD, muscle mass, and strength was then analyzed using the partial correlation coefficient, after adjusting for age, sex, BMI, physical activity, energy intake, and supplement uses.
All statistical analysis was performed using the Statistical Package for the Social Sciences (SPSS) software version 25.0 (IBM Corp., Armonk, NY, USA). Two-sided p values of < 0.05 were considered as being statistically significant.
RESULTS
Characteristics of study population
A total of 153 participants were included, consisting of 44 men and 109 women. The participants’ characteristics are summarized in
Table 1. The mean age of the participants was about 62.0 years for men and 59.5 years for women. The proportion of current smokers accounted for 4.4% of all participants. The mean BMI of men was 23.7 kg/m
2, which was significantly higher than that of women (22.8 kg/m
2). The body composition variables such as BMD, ASM, and LM were all significantly higher in men than in women. The mean ASMI of the study participants was 7.5 kg/m
2 for men and 5.9 kg/m
2 for women. The prevalence of having a low T-score was significantly higher in women, but there was no significant difference in the prevalence of having a low ASMI. The mean grip strength of men was 38.6 kg, and 6.8% had a low grip strength. The mean grip strength of women was 25.8 kg, and 6.4% had a low grip strength, which is not significantly different from the prevalence of low grip strength in men. The mean value of knee extension was 211.6 N in men and 181.7 N in women. About 80.0% of all participants were found to be physically active.
Table 1Anthropometric and socio-demographic characteristics of participants according to sex
Table 1
|
Variables |
Total (n = 153) |
Men (n = 44) |
Women (n = 109) |
p value |
|
Age |
60.2 ± 6.7 |
62.0 ± 7.5 |
59.5 ± 6.2 |
0.035*
|
|
Current smoker |
6 (4.4) |
4 (10.8) |
2 (2.0) |
0.025*
|
|
Education level |
|
|
|
0.009*
|
|
Elementary school |
6 (4.5) |
2 (5.4) |
4 (4.1) |
|
Middle school |
12 (9.0) |
2 (5.4) |
10 (10.3) |
|
High school |
66 (49.3) |
11 (29.7) |
55 (56.7) |
|
College |
50 (37.3) |
22 (59.5) |
28 (28.9) |
|
Lives with |
|
|
|
0.129 |
|
Family |
128 (95.5) |
36 (100.0) |
92 (93.9) |
|
Alone |
6 (4.5) |
0 |
6 (6.1) |
|
Weight history |
|
|
|
0.006*
|
|
Weight losers (> 3% loss) |
8 (6.1) |
5 (13.9) |
3 (3.1) |
|
Weight maintainers (± 3%) |
17 (12.9) |
8 (22.2) |
9 (9.4) |
|
Weight gainers (> 3% gain) |
107 (81.1) |
23 (63.9) |
84 (87.5) |
|
Weight (kg) |
59.5 ± 7.7 |
67.3 ± 6.7 |
56.4 ± 5.6 |
0.000*
|
|
Height (cm) |
160.4 ± 7.1 |
168.3 ± 5.2 |
157.1 ± 4.9 |
0.000*
|
|
BMI (kg/m2) |
23.1 ± 2.1 |
23.7 ± 1.9 |
22.8 ± 2.1 |
0.013*
|
|
Bone Mineral Density (BMD) |
|
|
|
|
|
Lumbar spine (mg/cm2) |
1.1 ± 0.2 |
1.2 ± 0.2 |
1.1 ± 0.1 |
0.000*
|
|
Femur (mg/cm2) |
0.9 ± 0.1 |
1.0 ± 0.1 |
0.9 ± 0.1 |
0.000*
|
|
Total body(left) (mg/cm2) |
1.1 ± 0.1 |
1.2 ± 0.1 |
1.0 ± 0.1 |
0.000*
|
|
Low T-score‡
|
63 (41.2)†
|
12 (27.3) |
51 (46.8) |
0.026*
|
|
Appendicular Skeletal muscle Mass (ASM) |
|
|
|
|
|
ASMI (kg/m2) |
6.4 ± 0.9 |
7.5 ± 0.6 |
5.9 ± 0.5 |
0.000*
|
|
ASM/Weight (%) |
27.6 ± 3.3 |
31.7 ± 1.9 |
25.9 ± 1.9 |
0.000*
|
|
ASM/BMI [kg/(kg/m2)] |
0.7 ± 0.1 |
0.9 ± 0.1 |
0.6 ± 0.1 |
0.000*
|
|
Low ASMI§
|
27 (17.6) |
10 (22.7) |
17 (15.6) |
0.295 |
|
Lean mass (LM) |
|
|
|
|
|
LM (kg) |
38.3 ± 6.9 |
47.7 ± 4.0 |
34.6 ± 3.2 |
0.000*
|
|
LM/Weight (%) |
64.2 ± 6.1 |
71.0 ± 4.1 |
61.5 ± 4.4 |
0.000*
|
|
LM/Height (kg/m2) |
14.8 ± 1.6 |
16.8 ± 1.1 |
14.0 ± 1.0 |
0.000*
|
|
Muscle strength |
|
|
|
|
|
Grip strength (kg) |
29.4 ± 7.8 |
38.6 ± 6.2 |
25.8 ± 5.0 |
0.000*
|
|
Low grip strength∥
|
10 (6.5) |
3 (6.8) |
7 (6.4) |
0.135 |
|
Knee extension (N) |
189.6 ± 52.3 |
211.6 ± 56.4 |
181.7 ± 48.6 |
0.003*
|
|
Physical activity (IPAQ) |
1,763.1 ± 1,195.3 |
2,016.3 ± 1,388.8 |
1,675.8 ± 1,116.6 |
0.180 |
|
≥ 600 METs |
107 (79.9) |
31 (86.1) |
76 (77.6) |
0.274 |
|
Quality of life (HINT-8)¶
|
0.87 (0.04) |
0.88 (0.03) |
0.87 (0.05) |
0.140 |
Table 2 shows the nutrient intakes of participants, which are closely related to bone and muscle health. The average energy intake was 1,798.7 kcal for men and 1,428.2 kcal for women, and the rates of meeting the estimated energy requirement (EER) were 5.6% in men and 19.0% in women. The total protein intake was significantly higher in men, though the mean value of protein intake/weight was 0.95 g/kg, which was similar between both sexes. The average vitamin E intake of the participants was 14.7 mg α-TE, which was above the AI, though the proportion of participants who met the AI was 61.8%. The average vitamin C intake of the participants was 66.7 mg, which was less than the RNI of 100 mg. Vitamin E and C supplements users were 12.9% and 27.2% of the total participants, respectively. The average intakes of vitamin D, calcium, potassium, and magnesium did not reach KDRIs levels.
Table 2Musculoskeletal health-related nutrient intakes of participants according to sex
Table 2
|
Variables |
KDRIs |
Total (n = 136) |
Men (n = 36) |
Women (n = 100) |
p value |
|
Energy intake (kcal/d) |
1,600–2,200†
|
1,524.7 ± 300.8 |
1,798.7 ± 232.3 |
1,428.2 ± 260.9 |
0.000*
|
|
≥ EER |
|
21 (15.4) |
2 (5.6) |
19 (19.0) |
0.056 |
|
Protein intake (g/d) |
50–60‡
|
56.6 ± 13.7 |
66.0 ± 10.9 |
51.5 ± 13.0 |
0.000*
|
|
Protein intake/Weight (g/kg/d) |
|
1.0 ± 0.2 |
1.0 ± 0.2 |
0.9 ± 0.3 |
0.642 |
|
Antioxidant vitamins |
|
|
|
|
|
|
Vitamin A intake (µg RAE/d) |
600–750§
|
431.5 ± 343.6 |
508.4 ± 342.4 |
405.8 ± 342.9 |
0.126 |
|
Retinol (µg/d) |
|
118.5 ± 111.2 |
128.6 ± 118.5 |
114.9 ± 108.8 |
0.528 |
|
β-carotene (µg/d) |
|
3,731.5 ± 3,900.9 |
4,500.16 ± 4,123.4 |
3,454.8 ± 3,801.0 |
0.169 |
|
Vitamin E intake (mg α-TE/d) |
12 |
14.7 ± 7.0 |
17.76 ± 8.0 |
13.7 ± 6.4 |
0.003*
|
|
|
≥ AI |
|
84 (61.8) |
28 (77.8) |
56 (56.0) |
0.021*
|
|
Vitamin C intake (mg/d) |
100 |
66.7 ± 42.3 |
76.2 ± 45.9 |
63.6 ± 40.7 |
0.126 |
|
|
≥ EAR |
|
46 (33.8) |
17 (47.2) |
29 (29.0) |
0.048*
|
|
|
≥ RNI |
|
22 (16.2) |
9 (25.0) |
13 (13.0) |
0.094 |
|
Vitamin E supplement users |
|
15 (12.9) |
4 (12.9) |
11 (12.9) |
0.996 |
|
Vitamin C supplement users |
|
37 (27.2) |
10 (27.0) |
27 (27.3) |
0.977 |
|
Bone health-related nutrients |
|
|
|
|
|
|
Vitamin D intake (µg/d) |
10–15∥
|
2.8 ± 3.1 |
2.8 ± 3.2 |
2.8 ± 3.1 |
0.966 |
|
Calcium intake (mg/d) |
700–800¶
|
423.2 ± 175.5 |
438.5 ± 199.5 |
419.1 ± 167.1 |
0.578 |
|
Potassium intake (mg/d) |
3,500 |
2,359.3 ± 751.7 |
2,579.5 ± 687.2 |
2,280.1 ± 761.3 |
0.040*
|
|
Magnesium intake (mg/d) |
280–370**
|
96.0 ± 51.1 |
104.0 ± 48.3 |
93.1 ± 52.0 |
0.272 |
Association between antioxidant vitamin intake and bone and muscle health-related parameters
A partial correlation analysis between antioxidant vitamin intake and various parameters related to bone and muscle health was performed, and results are presented in
Table 3. The BMD at the femur site was seen to be significantly related to the vitamin E intake. Also, there was a significant correlation observed between vitamin C intake and LM/Height. No significant association was found between the antioxidant vitamin intake and muscle strength variables.
Table 3Partial correlation coefficients (r) between antioxidant vitamin intakes and musculoskeletal health-related variables
Table 3
|
Partial correlation coefficients (r) |
Vitamin A (µg RAE/d) |
Retinol (µg/d) |
β-carotene (µg/d) |
Vitamin E (mg/d) |
Vitamin C (mg/d) |
|
BMD |
|
|
|
|
|
|
Lumbar spine (mg/cm2) |
0.075 |
−0.022 |
0.079 |
0.081 |
0.080 |
|
Femur (mg/cm2) |
0.094 |
−0.042 |
0.098 |
0.220*
|
0.180 |
|
Total body(left) (mg/cm2) |
0.090 |
−0.010 |
0.086 |
0.177 |
0.176 |
|
ASM |
|
|
|
|
|
|
ASMI (kg/m2) |
0.022 |
−0.120 |
0.053 |
0.029 |
0.134 |
|
ASM/Weight (%) |
0.030 |
−0.117 |
0.060 |
0.048 |
0.106 |
|
ASM/BMI [kg/(kg/m2)] |
0.097 |
−0.049 |
0.108 |
−0.011 |
0.034 |
|
LM |
|
|
|
|
|
|
LM (kg) |
0.149 |
0.017 |
0.140 |
0.013 |
0.105 |
|
LM/Weight (%) |
0.092 |
−0.044 |
0.100 |
0.093 |
0.171 |
|
LM/Height (kg/m2) |
0.098 |
−0.035 |
0.104 |
0.088 |
0.203*
|
|
Muscle strength |
|
|
|
|
|
|
Grip strength (kg) |
−0.090 |
−0.063 |
−0.084 |
−0.223 |
−0.092 |
|
Knee extension (N) |
0.083 |
0.018 |
0.076 |
0.013 |
0.086 |
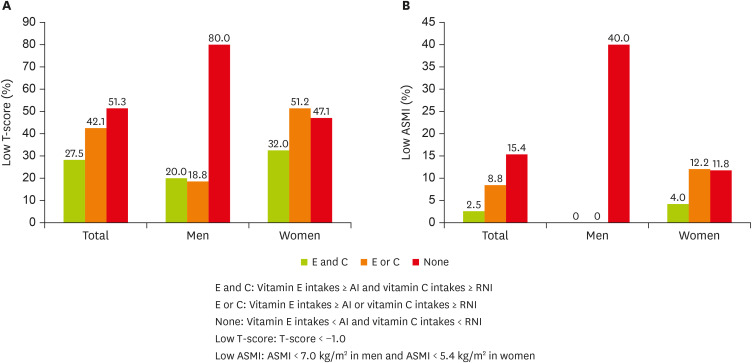
Figure 1 presents the prevalence of low T-scores and low ASMIs in the study participants according to whether or not their daily vitamin E and C intake meets AI or RNI standards. The figure also includes those who meet the KDRIs by taking supplements. More than half of the group with a vitamins C and E intake both under KDRIs (n = 39) are seen to have a low T-score, and the prevalence of having a low ASMI was 15.4% in that group. Notably, in men, 80.0% of the group having a vitamins E and C intake both under the KDRIs had osteopenia or osteoporosis, and 40.0% of the same group had sarcopenia. In women, there was no significant difference between the 3 groups. The prevalence of sarcopenia was not significantly different between the three groups in women, though none of the men with sarcopenia met the KDRIs for vitamin E or vitamin C.
Figure 1
Prevalence of (A) low T-score and (B) low ASMI according to whether daily vitamin E and/or C intake meets AI or RNI.
ASMI, appendicular skeletal muscle mass index; AI, adequate intake; RNI, reference nutrient intake.

Difference of general characteristics and musculoskeletal health-related nutrient intake according to whether vitamin E or C intake meet KDRIs
The participants’ BMD and muscle mass and strength according to whether their vitamin E and/or C intake satisfies the AI or RNI are shown in
Table 4. Meeting the KDRIs of vitamin E and C was significantly associated with a higher BMD at all sites and for muscle mass related parameters, excluding ASM/BMI. In the adjusted model, however, this significance became attenuated. Only the BMD of the total body and LM/Height were significantly different among three groups. The muscle strength did not show a significant difference, according to whether participants’ vitamin intake met the KDRIs.
Table 4Musculoskeletal health-related variables according to whether vitamin E and/or C intake meets KDRIs
Table 4
|
Variables |
Vitamin E & C intake both above KDRIs (n = 40) |
Vitamin E or C intake above KDRIs (n = 57) |
Vitamin E & C intake both under KDRIs (n = 39) |
p value |
|
BMD |
|
|
|
|
|
Lumbar spine (mg/cm2) |
|
|
|
|
|
|
Unadjusted |
1.1 ± 0.2a
|
1.1 ± 0.1 |
1.0 ± 0.2b
|
0.032*
|
|
|
Adjusted |
1.1 ± 0.0 |
1.1 ± 0.0 |
1.1 ± 0.0 |
0.103 |
|
Femur (mg/cm2) |
|
|
|
|
|
|
Unadjusted |
1.0 ± 0.1a
|
1.0 ± 0.1 |
0.9 ± 0.1b
|
0.018*
|
|
|
Adjusted |
1.0 ± 0.0 |
0.9 ± 0.0 |
0.9 ± 0.0 |
0.093 |
|
Total body(left) (mg/cm2) |
|
|
|
|
|
|
Unadjusted |
1.1 ± 0.1a
|
1.1 ± 0.1 |
1.0 ± 0.1b
|
0.005*
|
|
|
Adjusted |
1.2 ± 0.0 |
1.1 ± 0.0 |
1.0 ± 0.0 |
0.047*
|
|
ASM |
|
|
|
|
|
ASMI (kg/m2) |
|
|
|
|
|
|
Unadjusted |
6.7 ± 1.1a
|
6.5 ± 0.9 |
6.2 ± 0.8b
|
0.004*
|
|
|
Adjusted |
6.6 ± 0.1 |
6.5 ± 0.1 |
6.3 ± 0.1 |
0.097 |
|
ASM/Weight (%) |
|
|
|
|
|
|
Unadjusted |
28.6 ± 3.3a
|
27.7 ± 3.6 |
26.9 ± 2.8b
|
0.021*
|
|
|
Adjusted |
28.0 ± 0.3 |
27.5 ± 0.3 |
27.5 ± 0.3 |
0.434 |
|
ASM/BMI [kg/(kg/m2)] |
|
|
|
|
|
|
Unadjusted |
0.8 ± 0.1 |
0.7 ± 0.1 |
0.7 ± 0.1 |
0.080 |
|
|
Adjusted |
0.7 ± 0.0 |
0.7 ± 0.0 |
0.7 ± 0.0 |
0.125 |
|
LM |
|
|
|
|
|
LM (kg) |
|
|
|
|
|
|
Unadjusted |
40.6 ± 7.9a
|
38.5 ± 6.3 |
37.0 ± 6.1b
|
0.020*
|
|
|
Adjusted |
39.2 ± 0.6 |
38.3 ± 0.5 |
38.4 ± 0.6 |
0.379 |
|
LM/Weight (%) |
|
|
|
|
|
|
Unadjusted |
65.8 ± 5.7a
|
64.3 ± 6.8 |
62.9 ± 5.6b
|
0.041*
|
|
|
Adjusted |
64.7 ± 0.8 |
64.2 ± 0.6 |
63.8 ± 0.8 |
0.732 |
|
LM/Height (kg/m2) |
|
|
|
|
|
|
Unadjusted |
15.4 ± 1.9a
|
15.2 ± 1.6a
|
14.4 ± 1.4b
|
0.000*
|
|
|
Adjusted |
15.1 ± 0.2 |
15.1 ± 0.1a
|
14.6 ± 0.2b
|
0.023*
|
|
Muscle strength |
|
|
|
|
|
Grip strength (kg) |
|
|
|
|
|
|
Unadjusted |
30.5 ± 8.5 |
29.4 ± 7.9 |
28.5 ± 7.2 |
0.383 |
|
|
Adjusted |
28.8 ± 0.9 |
29.2 ± 0.7 |
30.1 ± 0.9 |
0.618 |
|
Knee extension (N) |
|
|
|
|
|
|
Unadjusted |
197.4 ± 61.5 |
190.3 ± 51.1 |
183.8 ± 46.4 |
0.260 |
|
|
Adjusted |
195.5 ± 9.3 |
189.9 ± 7.6 |
184.3 ± 9.3 |
0.726 |
DISCUSSION
Although it has been suggested that antioxidant vitamins have a close relationship with musculoskeletal health, there has always been interest in nutrients such as protein, calcium, vitamin D, and magnesium. Therefore, this study explored the relationship between antioxidant vitamin intake and the musculoskeletal health status of healthy individuals aged 50 to 80 years. First, from among various antioxidant vitamins we examined which vitamins are related to musculoskeletal health, and we found that vitamin E and vitamin C showed positive correlations with BMD and lean mass. Then we investigated whether dietary vitamin E and/or C intake or supplement use at a level stated in KDRIs would help individuals maintain bone mineral density, muscle mass, or strength, and found that the group consuming vitamin E above AI and vitamin C above RNI had significantly higher BMD at all test sites, LM, and ASM when adjusted for height and weight (ASMI and ASM/Weight). Although significance was attenuated after adjusting for related factors, we could posit that the sufficient intake of both vitamin E and C could contribute greatly to maintaining BMD and muscle mass in preparation for healthy aging.
In our study, we found only a significant relationship between vitamin E intake and BMD, and the association of vitamin C intake and lean mass—after adjusting musculoskeletal health-related variables. Since we also included participants whose vitamin intake was through supplements, it is possible that significance was found only between vitamins C and E, which were frequently consumed through supplement use. Also, previous studies mostly investigated participants’ dietary intake using a food-frequency questionnaire, which usually estimates the daily consumption more sensitively compared to the 24-hour recall method. In this case, the main sources of antioxidant vitamin intake were vegetables and fruits, which vary widely from season to season.
Also, there are some cross-sectional studies with Korean women and men, and they showed significant positive association between dietary vitamin C intake and BMD [
37,
38,
39]. Furthermore, in a meta-analysis of vitamin C intake and osteoporosis incidence, higher vitamin C intake had an inverse correlation with the risk of osteoporosis [
40]. And two cohort studies among older adults have shown that low intake or low serum level of vitamin E (α-tocopherol) also increases the risk of fracture [
41,
42] On the other hand, a cross-sectional study of women with osteoporosis showed a dietary antioxidant quality score had no relationship with BMD [
43]. It suggests taking antioxidant vitamins cannot help keeping bone health when osteoporosis have already progressed. Therefore, in the current study, those who had already been diagnosed with osteoporosis were excluded from screening. In older adults who were not diagnosed with osteoporosis, we found a significant association of antioxidant vitamin intake with BMD at all testing sites, even after adjusting for confounding factors.
In this study, we found a positive association between sufficient intakes of vitamins E and C and muscle mass index including ASMI, ASM/Weight and LM, LM/Weight and LM/Height, although it disappeared after adjusting confounding factors. However, further research is needed to examine effects of long-term antioxidant vitamin intake on muscle mass.
In terms of muscle strength, few cross-sectional studies showed higher consumption of vitamin C was associated with higher muscle power (leg explosive power) [
24] and physical function such as walking and chair rise time [
44]. A higher vitamin E concentration in older adults was reported to be related with greater muscle strength [
21], a lower likelihood of being frail [
45]. The current study, however, did not show any relationships between vitamins C or E intake and muscle strength. We speculate that this was possibly because the grip strength of participants was already within the normal range. And additionally, since the average IPAQ score of the participants was 1,675 METs for women and 2,016 METs for men, which is higher than those of other Korean adults aged 30–64 years (1,560 METs for women and 1,782 METs for men), we could suggest that the antioxidant could not exert further effect on the muscular strength.
In our study, unadjusted model showed the group with vitamins E and C intake both above the KDRIs had significantly higher BMD, ASMI, and LM than the group with vitamins E and C intake both under the KDRIs, though the significance disappeared after adjusting the confounders. This finding indicates the potential importance for both vitamins E and C intake, in terms of being able to meet the standards.
Despite the potential advantages of antioxidant vitamins, the consumption of vitamin C in older adults of South Korea was 61.54 mg, which means it did not reach the estimated average requirement (EAR) [
46]. In our study, participants consumed 66.65 mg of vitamin C through diet, very similar to the average intake investigated by KHNANES. The half of the group whose vitamin E and vitamin C intake were both above KDRIs consumed less vitamin C from diet than EAR and met RNI by using supplements. Considering the vitamin C intake, it is thus deemed necessary to consider supplement use in order to satisfy the RNI of vitamin C when it is difficult to consume sufficient vitamin C through diet alone. On the other hand, though vitamin E intake is known to be sufficient in South Korea, we should remember vitamin E content is expressed as the total of all forms of vitamin E. The United States of America (USA), for example, uses only α-tocopherol as the active vitamin E for setting the recommended intake, considering the affinity of α-tocopherol transportation protein [
47]. In our study, approximately 60% of participants appeared to be consuming enough vitamin E through diet alone. However, in the USA, about 75% of the population over age 71 years consumed less vitamin E than recommended by the EAR [
48], suggesting that more accurate indicators, such as blood levels of vitamin E, should also be studied together.
Although previous studies failed to draw a dose-response curve between vitamin C dose including supplements and the BMD at any site [
49], the result of this study emphasizes bone health and the importance of an intake of vitamins E and C that is even higher the recommended intake. Therefore, further research on the dose-response relationship between the intake of vitamins E and C and musculoskeletal indicators is needed, at several different levels of the DRI recommendation.
To the best of our knowledge, this is the first study to investigate meeting KDRIs for both vitamins E and C and their relationship to bone and muscle health. Another strength of this study is that we investigated a full range of musculoskeletal health by measuring muscle strength, as well as BMD and appendicular muscle mass measured using DXA, which is considered as the gold standard.
However, this study has several limitations. This was a cross-sectional study, which means it is difficult to identify a direct causal relationship between antioxidant vitamin intake and outcome variables. Also, we could not obtain data about the blood levels of antioxidant vitamins, but only collected the nutrient intake through just one day 24-hour recall questionnaire. Lastly, the adopted inclusion criteria of participants seems to limit the possibility of generalization because about 80% were physically active, indicating that they were a health-conscious group.
Overall, we found that antioxidant vitamins E and C were related to BMD and lean mass. We thus could conclude that the adequate intake of vitamins E and C above the KDRIs is important for maintaining the BMD in adults over 50, and that this intake shows potential for the protection of skeletal muscle mass decline.
Maeil Dairies Co., Ltd
NOTES
-
Funding: This research was supported by grants from Maeil Dairies Co., Ltd.
-
Conflict of Interest: The authors declare that they have no competing interests.
-
Author Contributions:
Conceptualization: Kim N, Park YK.
Data curation: Kim N, Kang Y, Choi YJ.
Formal analysis: Kim N, Park YK, Lee Y.
Funding acquisition: Park YK, Chyung YS, Lee Y.
Investigation: Park YK, Chyung YS, Lee Y.
Methodology: Kim N, Kang Y, Choi YJ, Park HS, Park YK.
Project administration: Park YK, Chung YS.
Resources: Park SJ, Park HS, Park YK, Kwon M.
Supervision:.
Writing - original draft: Kim N, Park YK.
Writing - review & editing: name. Kwon M, Kim N, Park YK.
REFERENCES
- 1. Statistics Korea. Estimated future population. Daejeon: Statistics Korea; 2020.
- 2. Ha Y. Epidemiology of osteoporosis in Korea. J Korean Med Assoc 2016;59:836-841.
- 3. Anker SD, Morley JE, von Haehling S. Welcome to the ICD-10 code for sarcopenia. J Cachexia Sarcopenia Muscle 2016;7:512-514.
- 4. Statistics Korea. The 7th revision of Korean standard classification of diseases (KCD-8). Daejeon: Statistics Korea; 2020.
- 5. Riggs BL, Melton LJ 3rd, Robb RA, Camp JJ, Atkinson EJ, McDaniel L, Amin S, Rouleau PA, Khosla S. A population-based assessment of rates of bone loss at multiple skeletal sites: evidence for substantial trabecular bone loss in young adult women and men. J Bone Miner Res 2008;23:205-214.
- 6. Lang T, Streeper T, Cawthon P, Baldwin K, Taaffe DR, Harris TB. Sarcopenia: etiology, clinical consequences, intervention, and assessment. Osteoporos Int 2010;21:543-559.
- 7. Frontera WR. Physiologic changes of the musculoskeletal system with aging: a brief review. Phys Med Rehabil Clin N Am 2017;28:705-711.
- 8. Dent E, Morley JE, Cruz-Jentoft AJ, Woodhouse L, Rodríguez-Mañas L, Fried LP, Woo J, Aprahamian I, Sanford A, Lundy J, Landi F, Beilby J, Martin FC, Bauer JM, Ferrucci L, Merchant RA, Dong B, Arai H, Hoogendijk EO, Won CW, Abbatecola A, Cederholm T, Strandberg T, Gutiérrez Robledo LM, Flicker L, Bhasin S, Aubertin-Leheudre M, Bischoff-Ferrari HA, Guralnik JM, Muscedere J, Pahor M, Ruiz J, Negm AM, Reginster JY, Waters DL, Vellas B. Physical frailty: ICFSR International Clinical Practice Guidelines for identification and management. J Nutr Health Aging 2019;23:771-787.
- 9. Greco EA, Pietschmann P, Migliaccio S. Osteoporosis and sarcopenia increase frailty syndrome in the elderly. Front Endocrinol (Lausanne) 2019;10:255.
- 10. Anton SD, Woods AJ, Ashizawa T, Barb D, Buford TW, Carter CS, Clark DJ, Cohen RA, Corbett DB, Cruz-Almeida Y, Dotson V, Ebner N, Efron PA, Fillingim RB, Foster TC, Gundermann DM, Joseph AM, Karabetian C, Leeuwenburgh C, Manini TM, Marsiske M, Mankowski RT, Mutchie HL, Perri MG, Ranka S, Rashidi P, Sandesara B, Scarpace PJ, Sibille KT, Solberg LM, Someya S, Uphold C, Wohlgemuth S, Wu SS, Pahor M. Successful aging: advancing the science of physical independence in older adults. Ageing Res Rev 2015;24:304-327.
- 11. Grote C, Reinhardt D, Zhang M, Wang J. Regulatory mechanisms and clinical manifestations of musculoskeletal aging. J Orthop Res 2019;37:1475-1488.
- 12. Chen Q, Liu K, Robinson AR, Clauson CL, Blair HC, Robbins PD, Niedernhofer LJ, Ouyang H. DNA damage drives accelerated bone aging via an NF-κB-dependent mechanism. J Bone Miner Res 2013;28:1214-1228.
- 13. Zhou Q, Zhu L, Zhang D, Li N, Li Q, Dai P, Mao Y, Li X, Ma J, Huang S. Oxidative stress-related biomarkers in postmenopausal osteoporosis: a systematic review and meta-analyses. Dis Markers 2016;2016:7067984.
- 14. Dirks A, Leeuwenburgh C. Apoptosis in skeletal muscle with aging. Am J Physiol Regul Integr Comp Physiol 2002;282:R519-R527.
- 15. Schaap LA, Pluijm SM, Deeg DJ, Visser M. Inflammatory markers and loss of muscle mass (sarcopenia) and strength. Am J Med 2006;119:526.e9-526.17.
- 16. Bailey DM, McEneny J, Mathieu-Costello O, Henry RR, James PE, McCord JM, Pietri S, Young IS, Richardson RS. Sedentary aging increases resting and exercise-induced intramuscular free radical formation. J Appl Physiol (1985) 2010;109:449-456.
- 17. Panche AN, Diwan AD, Chandra SR. Flavonoids: an overview. J Nutr Sci 2016;5:e47.
- 18. Jun S, Shin S, Joung H. Estimation of dietary flavonoid intake and major food sources of Korean adults. Br J Nutr 2016;115:480-489.
- 19. Barker ME, McCloskey E, Saha S, Gossiel F, Charlesworth D, Powers HJ, Blumsohn A. Serum retinoids and beta-carotene as predictors of hip and other fractures in elderly women. J Bone Miner Res 2005;20:913-920.
- 20. Pasco JA, Henry MJ, Wilkinson LK, Nicholson GC, Schneider HG, Kotowicz MA. Antioxidant vitamin supplements and markers of bone turnover in a community sample of nonsmoking women. J Womens Health (Larchmt) 2006;15:295-300.
- 21. Semba RD, Blaum C, Guralnik JM, Moncrief DT, Ricks MO, Fried LP. Carotenoid and vitamin E status are associated with indicators of sarcopenia among older women living in the community. Aging Clin Exp Res 2003;15:482-487.
- 22. Cesari M, Pahor M, Bartali B, Cherubini A, Penninx BW, Williams GR, Atkinson H, Martin A, Guralnik JM, Ferrucci L. Antioxidants and physical performance in elderly persons: the Invecchiare in Chianti (InCHIANTI) study. Am J Clin Nutr 2004;79:289-294.
- 23. Melhus H, Michaëlsson K, Kindmark A, Bergström R, Holmberg L, Mallmin H, Wolk A, Ljunghall S. Excessive dietary intake of vitamin A is associated with reduced bone mineral density and increased risk for hip fracture. Ann Intern Med 1998;129:770-778.
- 24. Faraji H, Jamshidi S, Askari G. Dietary intake of antioxidants in the elderly people under nursing care: a case-control study. Int J Prev Med 2019;10:191-195.
- 25. Frei B. Reactive oxygen species and antioxidant vitamins: mechanisms of action. Am J Med 1994;97:5S-13S.
- 26. Packer L. Vitamin C in health and disease. New York (NY): Taylor & Francis Inc.; 1997, pp 95-107.
- 27. Burri BJ, Jacob RA. Human metabolism and the requirement for vitamin C. In: Packer L, Fuchs J, editors. Vitamin C in health and disease. New York (NY): Marcel Dekker Inc.; 1997. p. 341-366.
- 28. Howard AC, McNeil AK, McNeil PL. Promotion of plasma membrane repair by vitamin E. Nat Commun 2011;2:597.
- 29. Scott D, Blizzard L, Fell J, Giles G, Jones G. Associations between dietary nutrient intake and muscle mass and strength in community-dwelling older adults: the Tasmanian Older Adult Cohort Study. J Am Geriatr Soc 2010;58:2129-2134.
- 30. Kanis JA, Kanis JA. WHO Study Group. Assessment of fracture risk and its application to screening for postmenopausal osteoporosis: synopsis of a WHO report. Osteoporos Int 1994;4:368-381.
- 31. Chen LK, Woo J, Assantachai P, Auyeung TW, Chou MY, Iijima K, Jang HC, Kang L, Kim M, Kim S, Kojima T, Kuzuya M, Lee JSW, Lee SY, Lee WJ, Lee Y, Liang CK, Lim JY, Lim WS, Peng LN, Sugimoto K, Tanaka T, Won CW, Yamada M, Zhang T, Akishita M, Arai H. Asian Working Group for Sarcopenia: 2019 consensus update on sarcopenia diagnosis and treatment. J Am Med Dir Assoc 2020;21:300-307.e2.
- 32. Cruz-Jentoft AJ, Bahat G, Bauer J, Boirie Y, Bruyère O, Cederholm T, Cooper C, Landi F, Rolland Y, Sayer AA, Schneider SM, Sieber CC, Topinkova E, Vandewoude M, Visser M, Zamboni M. Writing Group for the European Working Group on Sarcopenia in Older People 2 (EWGSOP2), and the Extended Group for EWGSOP2. Sarcopenia: revised European consensus on definition and diagnosis. Age Ageing 2019;48:601.
- 33. Lee C. Validity of hand-held dynamometer in assessing isometric leg strength in older adults. Int J Appl Sports Sci 2019;31:52-57.
- 34. Oh JY, Yang YJ, Kim BS, Kang JH. Validity and reliability of Korean version of international physical activity questionnaire (IPAQ) short form. J Korean Acad Fam Med 2007;28:532-541.
- 35. Lee J, Ahn J. A study on deriving a conversion formulae using mapping between HINT-8 and EQ-5D instruments. Korean J Health Econ Policy 2019;25:77-103.
- 36. Ministry of Health and Welfare, The Korean Nutrition Society. Dietary reference intakes for Koreans 2020. Seoul: The Korean Nutrition Society; 2020.
- 37. Kim DE, Cho SH, Park HM, Chang YK. Relationship between bone mineral density and dietary intake of β-carotene, vitamin C, zinc and vegetables in postmenopausal Korean women: a cross-sectional study. J Int Med Res 2016;44:1103-1114.
- 38. Park HM, Heo J, Park Y. Calcium from plant sources is beneficial to lowering the risk of osteoporosis in postmenopausal Korean women. Nutr Res 2011;31:27-32.
- 39. Yang YJ, Kim J. Factors in relation to bone mineral density in Korean middle-aged and older men: 2008-2010 Korea National Health and Nutrition Examination Survey. Ann Nutr Metab 2014;64:50-59.
- 40. Welch AA, Jennings A, Kelaiditi E, Skinner J, Steves CJ. Cross-sectional associations between dietary antioxidant vitamins C, E and carotenoid intakes and sarcopenic indices in women aged 18-79 years. Calcif Tissue Int 2020;106:331-342.
- 41. Michaëlsson K, Wolk A, Byberg L, Ärnlöv J, Melhus H. Intake and serum concentrations of α-tocopherol in relation to fractures in elderly women and men: 2 cohort studies. Am J Clin Nutr 2014;99:107-114.
- 42. Holvik K, Gjesdal CG, Tell GS, Grimnes G, Schei B, Apalset EM, Samuelsen SO, Blomhoff R, Michaëlsson K, Meyer HE. Low serum concentrations of alpha-tocopherol are associated with increased risk of hip fracture. A NOREPOS study. Osteoporos Int 2014;25:2545-2554.
- 43. De França NA, Camargo MB, Lazaretti-Castro M, Martini LA. Antioxidant intake and bone status in a cross-sectional study of Brazilian women with osteoporosis. Nutr Health 2013;22:133-142.
- 44. Martin H, Aihie Sayer A, Jameson K, Syddall H, Dennison EM, Cooper C, Robinson S. Does diet influence physical performance in community-dwelling older people? Findings from the Hertfordshire Cohort Study. Age Ageing 2011;40:181-186.
- 45. Ble A, Cherubini A, Volpato S, Bartali B, Walston JD, Windham BG, Bandinelli S, Lauretani F, Guralnik JM, Ferrucci L. Lower plasma vitamin E levels are associated with the frailty syndrome: the InCHIANTI study. J Gerontol A Biol Sci Med Sci 2006;61:278-283.
- 46. Korea Health Industry Development Institute. Intake by nutrients, the Korea national health and nutrition examination survey (KNHANES) 7th (2016–2018) [Internet]. 2019. cited 2021 September 25. Available from https://www.khidi.or.kr/kps/dhraStat/result5?menuId=MENU01657&gubun=age1&year=7%EA%B8%B0
- 47. Institute of Medicine (US) Panel on Dietary Antioxidants and Related Compounds. Dietary Reference Intakes for vitamin C, vitamin E, selenium, and carotenoids. Washington, D.C.: National Academies Press; 2000.
- 48. Krebs-Smith SM, Guenther PM, Subar AF, Kirkpatrick SI, Dodd KW. Americans do not meet federal dietary recommendations. J Nutr 2010;140:1832-1838.
- 49. Paulsen G, Hamarsland H, Cumming KT, Johansen RE, Hulmi JJ, Børsheim E, Wiig H, Garthe I, Raastad T. Vitamin C and E supplementation alters protein signalling after a strength training session, but not muscle growth during 10 weeks of training. J Physiol 2014;592:5391-5408.

 , Yeji Kang1