ABSTRACT
The purpose of this study is to estimate Korean collegians' knowledge of energy content in the standard portion size of foods frequently consumed in Korea and to investigate the differences in knowledge between gender groups. A total of 600 collegians participated in this study. Participants' knowledge was assessed based on their estimation on the energy content of 30 selected food items with their actual-size photo images. Standard portion size of food was based on 2010 Korean Dietary Reference Intakes, and the percentage of participants who accurately estimated (that is, within 20% of the true value) the energy content of the standard portion size was calculated for each food item. The food for which the most participants provided the accurate estimation was ramyun (instant noodles) (67.7%), followed by cooked rice (57.8%). The proportion of students who overestimated the energy content was highest for vegetables (68.8%) and beverages (68.1%). The proportion of students who underestimated the energy content was highest for grains and starches (42.0%) and fruits (37.1%). Female students were more likely to check energy content of foods that they consumed than male students. From these results, it was concluded that the knowledge on food energy content was poor among collegians, with some gender difference. Therefore, in the future, nutrition education programs should give greater attention to improving knowledge on calorie content and to helping them apply this knowledge in order to develop effective dietary plans.
-
Keywords: Food energy content; Portion size; Nutrition education
Introduction
In the modern society, people have greater access to nutritional information and awareness in food calories are continually increasing. College students, who start to live alone after leaving their parents, may have problems choosing food, so that they need to know more about portion sizes of foods and calories to maintain healthy life style. To help them, standardization of food portions and nutrition education should be carried out. In practice, it was reported that most college students overestimate food calories and knowledge of food energy content acquired from nutrition education and experience was not accurate [
1]. For a balanced diet, knowledge on food energy content and energy allowances for an individual, and appropriate energy consumption are essential. As for male students, who live off-campus smoke more, eat irregularly and eat less fruit and seaweed compared to students living in dormitories [
2]. As for female college students, preference for the skinny body shape forces them to diet, and exercise and limited portions of food are the main method to control their weight [
3]. Recently, more collegians live in dormitories or off-campus rather than commuting from home, and a considerable number of restaurants provide delivery service. This trend encourages students to be interested in choosing food and food calories, and continuous nutrition education on calories and portion sizes of foods may be important.
In many countries, the government establishes a recommended portion size to help people consume proper amount of energy [
4-
6]. The food guide of the Korean Dietary Reference Intakes (KDRIs) also provides the standard portion size of typical Korean foods [
7]. The nutrition education provided for Korean middle or high school students in the home economics class suggests examples of a balanced diet based on Dietary Reference Intake and the five basic food groups. Nevertheless, the standard portion size of various foods or portion size estimation is not included in regular classes in a college but only in the cultural study class, which is not mandatory for all students. Moreover, such education fails to provide the nutritional content of foods but only lists food sources of nutrients, greatly limiting students' ability to use the knowledge in deciding what to eat and how much to eat.
The nutritional education program should not only provide general knowledge but also actually help students to make the right decisions on food intake. From this point of view, collegians who are more likely to choose what to eat by themselves need help in understanding amounts and the calorie content of foods. In particular, the instruction should be practical, rather than focused on theories, utilizing visual materials such as actual pictures or food models. To that end, we need to first analyze collegians' knowledge regarding the energy content of the standard portion sizes of 30 foods frequently consumed by Koreans in the current nutrition education environment.
The purpose of this study is (1) to identify the collegians' knowledge of the energy content of standard portion size of 30 Korean foods; and (2) to investigate the differences in their estimation, by gender and by different food groups. Finally, we provide data to address improving nutritional education programs for collegians.
Materials and Methods
Subjects and period
We conducted a preliminary survey in June 2012 and then modified and improved the questionnaire in order to distribute 600 copies to male and female students at K National University, located in Samcheok, Korea, in September 2012. We excluded the students who majored in Food and Nutrition in this study. Consent for all procedures was obtained from the participants.
Methods and contents
The questionnaire consisted of four questions on general information, including age, body weight, height and a habit of checking energy content of foods that they consume. Thrity questions on their knowledge on energy content of the standard portion size of 30 typical Korean foods. In order to conduct the survey, we provided the actual weights and actualsize photo images of the foods and allowed the subjects to freely describe the energy content of each food. The 30 food items frequently consumed by Koreans were selected based on 2010 health statistics [
8]. The standard portion sizes of 30 food items were based on the food guide of the KDRIs [
7].
The data were analyzed by SAS (version 9.1, SAS Institute Inc., Cary, NC, USA) to calculate the frequency, percentage, average, and standard deviation according to gender. Participants' energy estimation level was calculated by the following equation: (estimation value of the energy content of each food/true value)×100. Based on the results of the existing research, the participants were divided into the following three categories: calorie underestimation (the estimation value was below -20% of the actual calories of the standard portion size of each food), accurate calorie estimation (the estimation value was within the ±20% of the actual calories of the standard portion size of each food), and calorie overestimation (the estimation value was over +20% of the actual calories of the standard portion size of each food) [
9,
10]. For the significance analysis, we used the χ
2-test and Student's t-test. All statistical significance was considered at the level of α < 0.05.
Results
Table 1 shows the general information of the subjects. The average age of participants was 21.1 years. The height (p < 0.001) and weight (p < 0.001) were significantly higher in the male group than in the female group. Regarding the body mass index (BMI, 22.6 kg/m
2 in male vs. 20.7 kg/m
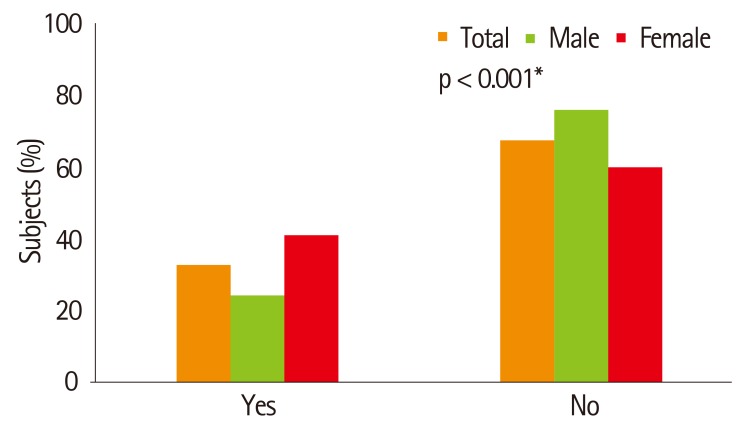
2 in female), there was also a significant difference between the two groups (p < 0.05). The proportions of underweight and normal weight participants were significantly higher in the female group than those in the male group; however, the proportions of overweight and obese participants were significantly higher in the male group (p < 0.001). The proportion of the females who checked energy content for consumed foods was significantly higher than that of the males (40.6% for the females and 24.2% for the males; p < 0.001) (
Figure 1).
Tables 2,
3,
4,
5,
6, and
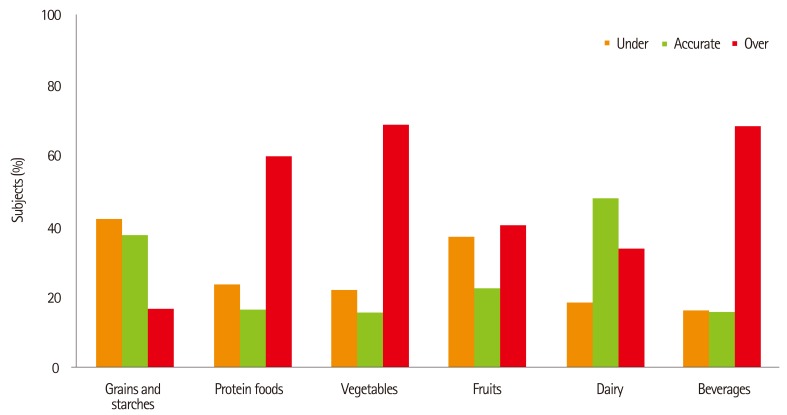
Figure 2 show the collegians' level of knowledge of the energy content of the 30 typical foods. The food group for which the most participants provided the accurate estimation was dairy (48.0%), followed by grains/starches (37.5%) and fruits (22.6%) (
Figure 2).
The food item for which the most of the participants provided the accurate estimation was ramyun (instant noodles) (67.7%), followed by cooked rice (57.8%), milk (48.0%), and rice cake (37.3%) (
Tables 2-
6). The proportion of subjects who overestimated the calorie content was highest for vegetables (68.6%), beverages (68.1%), protein foods (59.9%), and fruits (40.5%) (
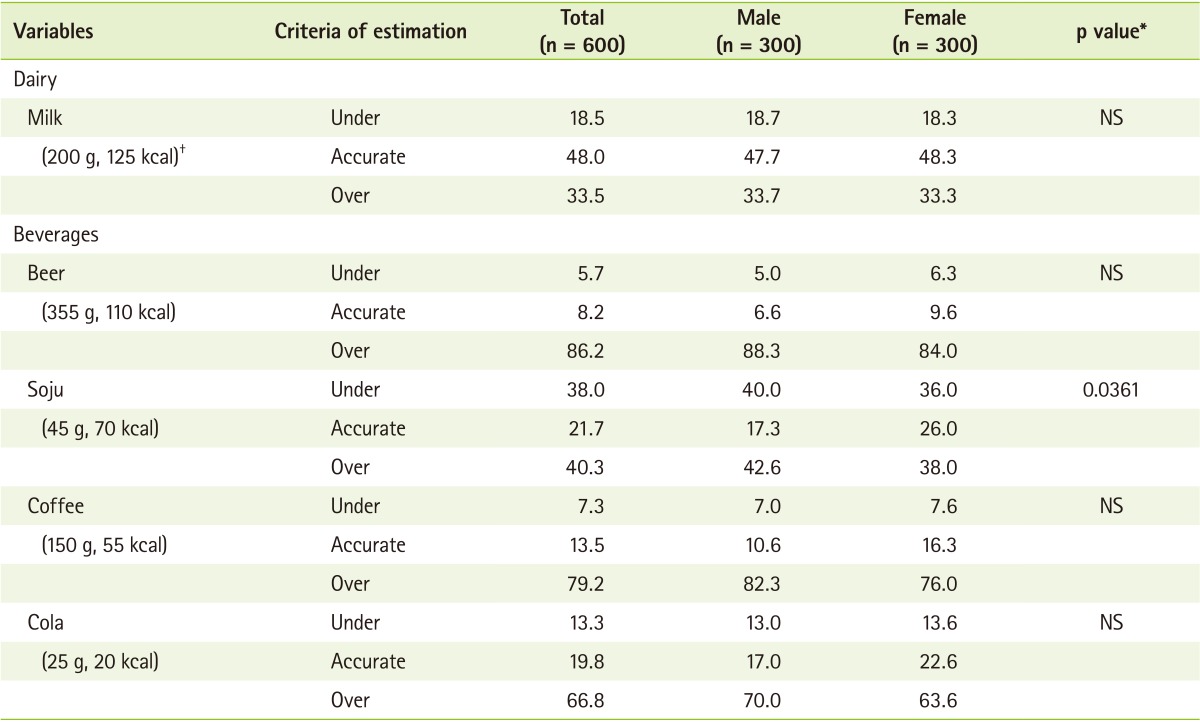
Figure 2). For the vegetables and beverages, about 16% of the participants had accurate knowledge on the energy content of each vegetable and beverage food item, and about 70% of the participants thought that the calorie content of vegetables and beverages was higher than their actual calorie content. For the beverages, the collegians were more likely to overestimate the energy content of beer than that of soju. The proportion of collegians overestimating beverages was 79.2% for coffee and 66.8% for cola, a soft drink (
Table 4-
6), while the proportion who underestimated the energy content was highest for grains and starches (42.0%) and fruits (37.1%) (
Figure 2).
Among the 30 typical foods, significant gender differences were found in the estimation of the calories of 11 foods. Compared with the male students, a higher proportion of female students provided the accurate calorie estimation for cooked rice (p < 0.05), bread (p < 0.01), instant noodles (p < 0.05), rice cake (p < 0.01), egg (p < 0.01), scallion (p < 0.001), onion (p < 0.01), and soju (p < 0.05). For the fruits, while a higher proportion of females overestimated calories for mandarin orange (p < 0.001), a higher proportion of male students overestimated calories for watermelon (p < 0.01) (
Table 5).
Discussion
In this study, we investigated the knowledge of the energy content of the standard portion size of 30 typical Korean foods among male and female collegians in Korea. According to the results, the overall knowledge on energy content of food was poor among the collegians. The percentage of participants who accurately estimated the energy content of the standard portion size was calculated for each of the 30 typical foods (ranging from 1.7% for beef bone soup to 67.7% for ramyun) were averaged to be 22.3%. This finding suggests that collegians' knowledge on the energy content of food is undesirably lacking. In our previous study [
10] using middle school adolescents, the knowledge on energy content of the standard portion size of 32 typical Korean foods was slightly lower, (ranging from 0% for kimchi and mushroom to 35.5% for cooked rice) and the average value was 15.3%. Though we used different food items in the previous study, the current results show that the knowledge on energy content of standard portion size of foods is not much better in collegians compared to that of middle school adolescents.
The participants' knowledge on calorie content of the portion size tended to be different by food groups. The food group for which the most students provided the accurate estimation was dairy (48.0%), followed by grains/starches (37.5%) and fruits (22.6%). Over 60% of the students thought that the calorie content of vegetables, beverages, and protein foods were higher than their actual calorie content.
Regarding the grains/starches, the food for which the most participants revealed the accurate estimation was ramyun (instant noodles) (67.7%) followed by cooked rice (57.8%). In the case of potato and sweet potato, over 82% of the students underestimated the energy content of sweet potato, while about 40% of the subjects overestimated the energy content of potato. According to the 2011 Korea National Health and Nutrition Examination Survey (KNHANES), grains were the greatest source of energy [
11]. In particular, Koreans consumed 169.8 g of rice a day, showing the largest quantities among all foods. As such, the diet of the Korean people heavily depends on grains although about a half of the subjects in this study provided an accurate estimate of the energy content for rice, which may cause an imbalance of nutrients. Therefore, collegians need to know about the standard portion size of grains/starches in order to consume carbohydrates, which are the major source of energy, in a balanced manner.
Particularly, kimchi is one of the most frequently consumed vegetables in Korea. However, most of the students (76.7%) overestimated the calorie content of kimchi, demonstrating little knowledge of the calorie content of this food. The same finding was reported for middle school adolescents in the previous study [
10]. The Korean government has tried to globalize the healthy Korean foods including kimchi; however, the collegians and middle school students had little knowledge of the calorie content of this food. In the future, therefore, the greater attention to improving knowledge on calorie and nutrient content of quantitatively important traditional Korean foods.
As for milk, a relatively high percentage (48%) of the students accurately estimated the calorie content. Milk is usually served in a portion-size container with a nutrition label, which enable consumers to easily understand calorie content of milk.
About 70% of the participants thought that the calorie content of vegetables was higher than their actual calorie content. Through these results, it can be inferred that they overestimated the calorie content of vegetables due to the large portion size of these low calorie density foods.
For beverages, the collegians were more likely to overestimate the energy content of beer than that of soju. The proportions of participants overestimating instant coffee and Coke were 79.2% and 66.8%, respectively. Through these results, it can be inferred that the students thought that beverages contain high calories regardless of standard portion size; furthermore, they might have overestimated the calorie content of beer due to its large portion size, compared with that of soju. A recent study reported that over 85% of collegians drink alcohol [
12]. When we consider the high rate of drinking among collegians in Korea, both the proper portion size and calorie content of beverages including alcoholic beverages should be emphasized in nutrition education programs for collegians.
This study showed a significant gender difference in the calorie estimation levels of 11 items among the 30 foods. Among these 11 items, a significantly higher proportion of the female students, compared with the male students, provided the accurate calorie estimation for the following 8 items: cooked rice (p < 0.05), bread (p < 0.01), instant noodles (p < 0.05), rice cake (p < 0.01), egg (p < 0.01), scallion (p < 0.001), onion (p < 0.01), and soju (p < 0.05). This result was consistent with that of previous studies showing that the nutrition knowledge score of girls was higher than that of boys [
10,
13-
15].
Recent study results indicated that, calorie awareness of food may affect the food choice. Lee and colleagues' study [
16], which evaluated the effect of calorie labeling on menu sales and consumer's recognition of calorie labeling at a Korean restaurant in a hotel, found that among the subjects who recognized calorie labeling, 58.3% answered that calorie information affected their food choices, and most of them answered that they chose lower calorie foods based on the information provided. Also, Roberto and colleagues [
17] found that participants who read posted calorie information ordered fewer calories, and Tandon and colleagues [
18] reported that awareness of calorie information had an effect on parents' food choices for their young children. It was also found that customers who reported using the calorie information in restaurants displaying energy content of all items on their menus purchased an average of 106 fewer calories compared with customers who did not see or did not use such information [
19]. Even though the setting of these studies was restaurants, unlike the present study's setting, calorie awareness of food can potentially affect energy intake and food choice by informed decision making.
This study has several limitations. First, we did not ask whether the subjects actually knew the calorie content of the portion size of 30 typical Korean foods or not, as we mainly focused on their estimation level of calorie content of portion-size foods. Therefore, we could not exactly determine whether the subjects' estimation level was based on knowledge or speculation. Second, we also did not survey whether the subjects used the knowledge of calorie content when they chose the foods. Subjects' motivation or willingness to apply their knowledge can affect their food choices. Third, we did not survey for their actual energy intake; this limitation makes it difficult to investigate the effects of the subjects' knowledge on their actual calorie intake. Fourth, we did not analyze the subjects' level of knowledge on calorie content of foods according to the characteristics of the subjects such as BMI, interest of weight control, and so on, as it was difficult to generalize the levels of knowledge of the calorie content of foods with our survey data.
We concluded from the results that the knowledge of energy content of foods was poor among the collegians, with some gender difference. Therefore, in the future, nutrition education programs should give greater attention to improving collegians' knowledge of calorie content of foods and helping them apply this knowledge in order to develop effective dietary plans. Furthermore, further studies are needed to investigate the effects of the knowledge on their actual calorie intake and the effects of the subjects' characteristics on the level of knowledge.
NOTES
-
We declare that we have no conflict of interest.
REFERENCES
- 1. Choi MK, Kim MH. A study on recognition of food calories of college students in Chungnam. J Korean Soc Food Sci Nutr 2002;31:696-702.
- 2. Hwang JH, Lee HM. A study on lifestyles, dietary habits, nutrition knowledge and dietary behaviors of male university Students according to residence type. Korean J Community Nutr 2007;12:381-395.
- 3. Hong MS, Park HO, Sohn CY. A study on food behaviors and nutrient intakes according to body mass index and body image recognition in female university students from Incheon. Korean J Food Nutr 2011;24:386-395.
- 4. Gray C, Lytle LA, Mays R, Taylor G, Perry C, Story M. Foods on students' trays when they leave the cafeteria line as a proxy for foods eaten at lunch in a school-based study. J Am Diet Assoc 2002;102:407-409.
- 5. Ko SY, Kim KW. Nutrition label use, self-efficacy, snacking and eating behavior of middle school students in Kyunggi area. Korean J Community Nutr 2010;15:513-524.
- 6. Kim G, Lee JW. Development and evaluation of CAI program on food guide pagoda for adolescents. Chungnam J Hum Ecol 2006;19:83-98.
- 7. The Korean Nutrition Society. Dietary reference intakes for Koreans 2010. Seoul: The Korean Nutrition Society; 2010.
- 8. Ministry of Health and Welfare, Korea Centers for Disease Control and Prevention. Korea Health Statistics 2010: Korea National Health and Nutrition Examination Survey (KNHANES V-1). Cheongwon: Korea Centers for Disease Control and Prevention; 2011.
- 9. del Balzo V, Scanu A, Dernini S, Palmieri O, Cannella C. Mediterranean lifestyle: nutritional education on-line. Ann Ig 2009;21:565-573.
- 10. Choi MK, Ko MJ, Kim MH. Adolescents' estimation of energy content of standard portion size of foods and its association with body mass index. Food Nutr Sci 2012;3:1340-1348.
- 11. Ministry of Health and Welfare, Korea Centers for Disease Control and Prevention. Korea Health Statistics 2011: Korea National Health and Nutrition Examination Survey (KNHANES V-2). Cheongwon: Korea Centers for Disease Control and Prevention; 2012.
- 12. Kim MH, Kim H, Kim WK, Kim SJ, Yeon JY. Food habits and dietary behavior related to using processed food among male college students residing in dormitory and self-boarding in Gangwon. Korean J Community Nutr 2013;18:372-385.
- 13. Turrell G. Determinants of gender differences in dietary behavior. Nutr Res 1997;17:1105-1120.
- 14. Parmenter K, Waller J, Wardle J. Demographic variation in nutrition knowledge in England. Health Educ Res 2000;15:163-174.
- 15. Oakes ME, Slotterback CS. Gender differences in perceptions of the healthiness of foods. Psychol Health 2001;16:57-65.
- 16. Lee D, Lee JC, Kim MH. Effect of menu calorie labels on menu sales and consumer's recognition at a Korean restaurant in a hotel. Korean J Community Nutr 2013;18:505-514.
- 17. Roberto CA, Larsen PD, Agnew H, Baik J, Brownell KD. Evaluating the impact of menu labeling on food choices and intake. Am J Public Health 2010;100:312-318.
- 18. Tandon PS, Wright J, Zhou C, Rogers CB, Christakis DA. Nutrition menu labeling may lead to lower-calorie restaurant meal choices for children. Pediatrics 2010;125:244-248.
- 19. Dumanovsky T, Huang CY, Nonas CA, Matte TD, Bassett MT, Silver LD. Changes in energy content of lunchtime purchases from fast food restaurants after introduction of calorie labelling: cross sectional customer surveys. BMJ 2011;343:d4464.
Figure 1The proportion of participants who checked the energy content of eating food. *Significance between Male and Female as determined by χ2-test.

Figure 2Estimation of the energy content of one portion size of foods according to the food groups.

Table 1General characteristics of the subjects
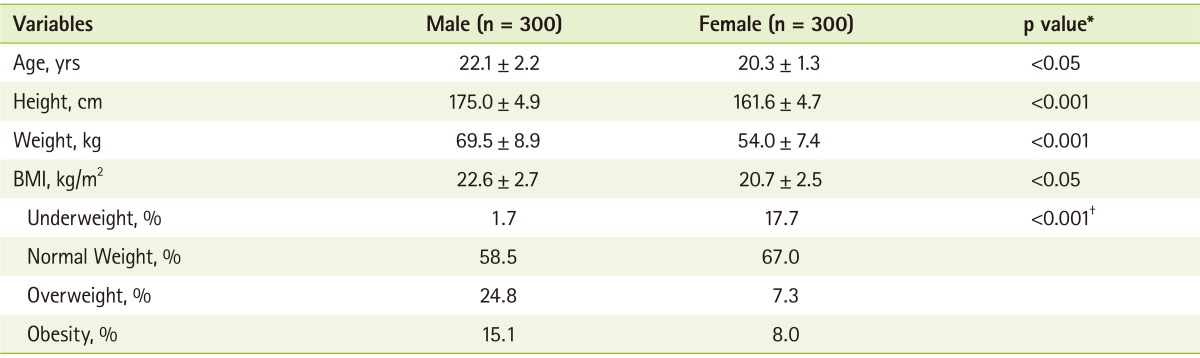
Table 2Estimation of energy content of standard portion size of grains and starches
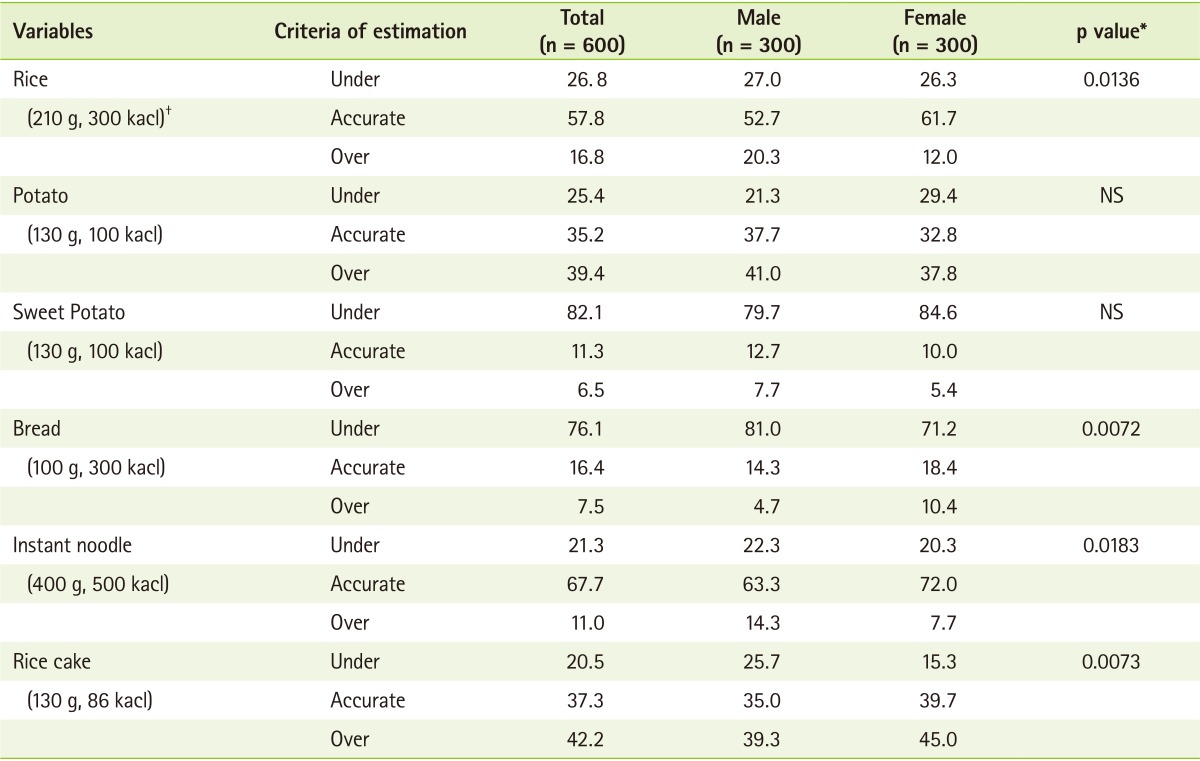
Table 3Estimation of energy content of the standard portion size of protein foods
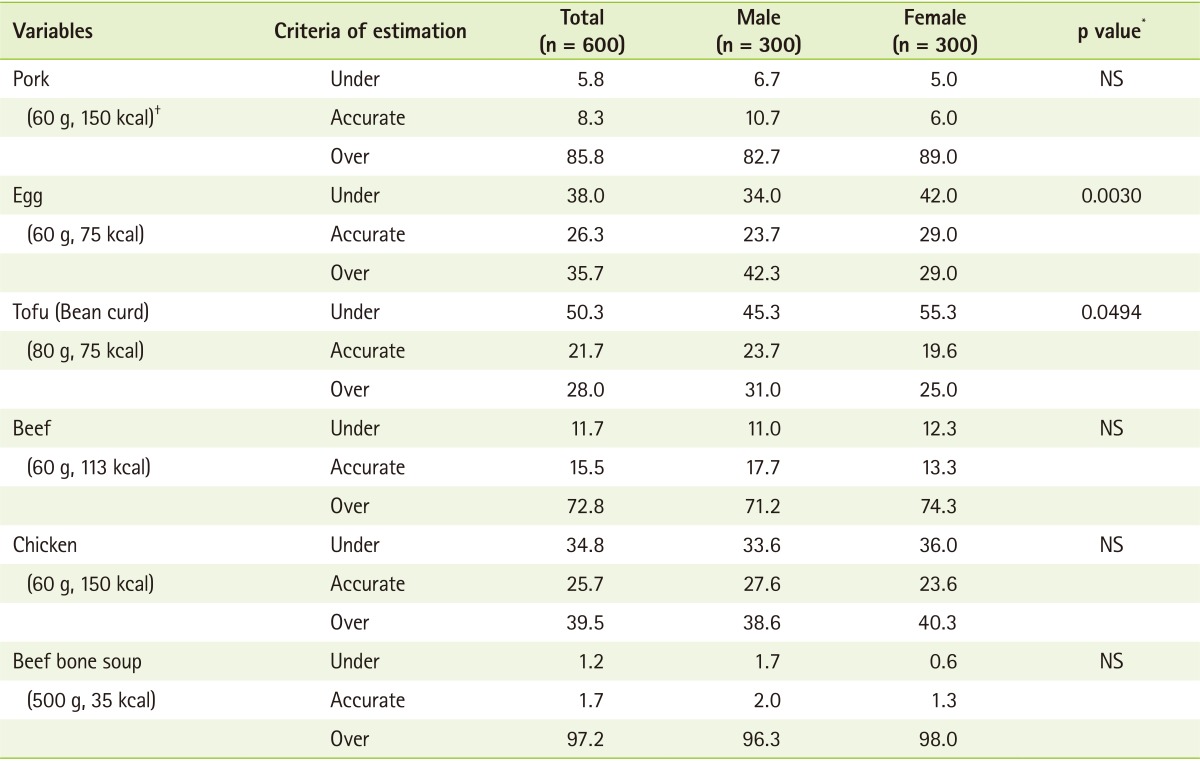
Table 4Estimation of energy content of the standard portion size of vegetables
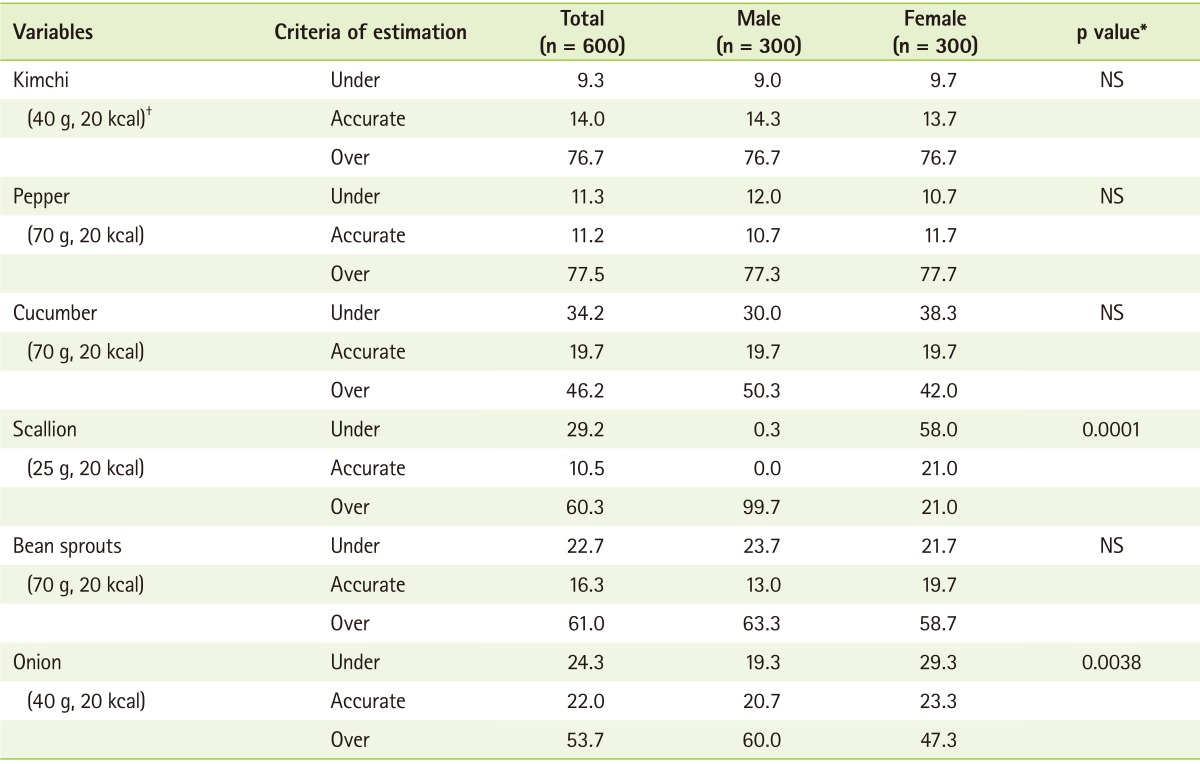
Table 5Estimation of energy content of standard portion size of fruits
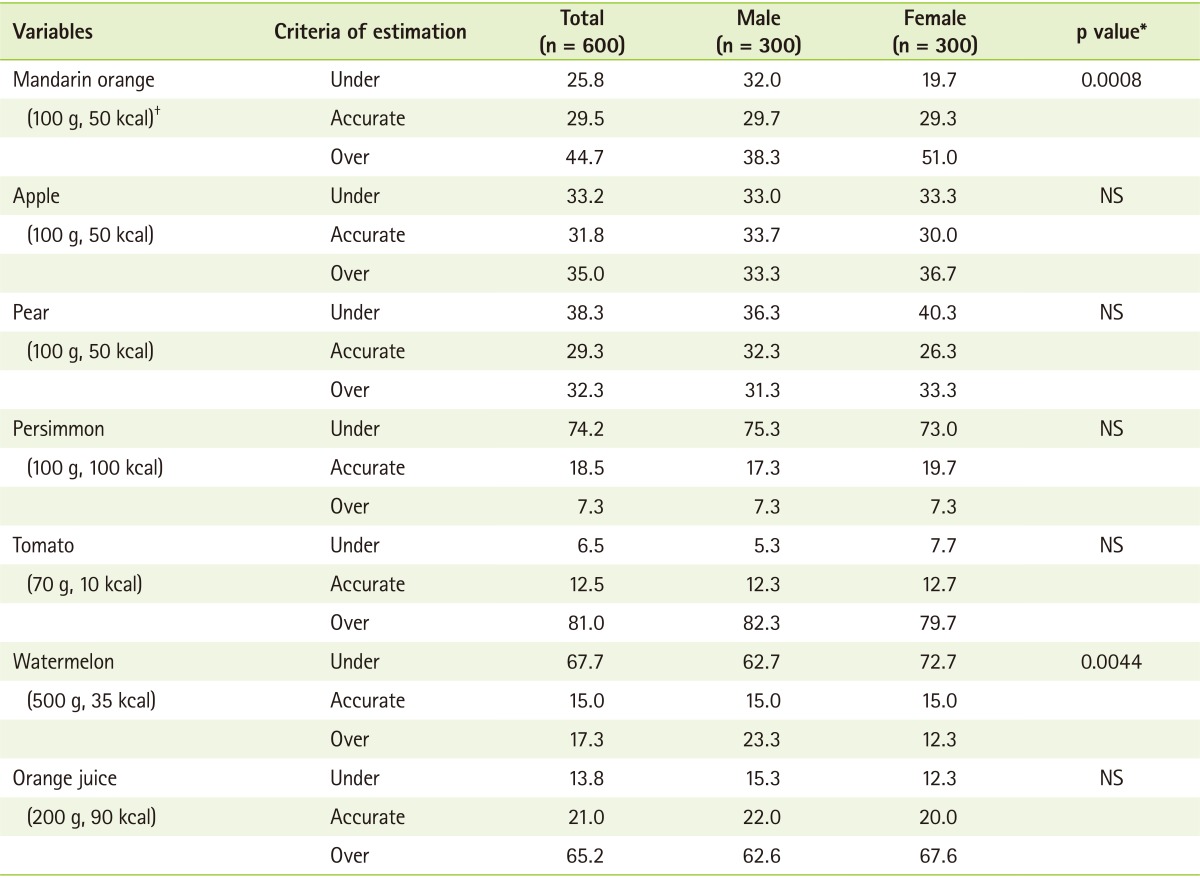
Table 6Estimation of energy content of standard portion size of dairy and beverages