ABSTRACT
This study aimed to evaluate the effects of functional foods containing Auricularia auricula-judae powder on gut health and clinical indicators in middle-aged and older adults. Participants were randomly assigned to either the intervention group (n = 24) or control group (n = 26), and assessments including anthropometric measurements, blood analyses, and dietary intake surveys were conducted. The intervention group consumed functional foods containing A. auricula-judae powder twice daily for 8 weeks. No statistically significant differences were observed in the gut environmental parameters between the 2 groups. However, reductions in waist circumference (p < 0.021), abdominal obesity (p < 0.006), and triglyceride levels (p < 0.016) in the intervention group were statistically significant. Additionally, an analysis of nutrient intake from meals other than the intervention food revealed a significant increase in dietary fiber (p < 0.043), vitamin B1 (p < 0.027), and folic acid (p < 0.006) intake in the intervention group. Although the intervention improved the selection of body composition and blood parameters, it failed to produce significant changes in constipation outcomes or gut environmental parameters among participants with constipation. In conclusion, the consumption of A. auricula-judae powder-based functional foods resulted in limited yet meaningful improvements, specifically in reducing waist circumference and triglyceride levels.
-
Keywords: Auricularia; Aged; Dietary fiber; Functional food
INTRODUCTION
Currently, the aging population is becoming a serious social problem in South Korea, and the population aged 65 years or older will account for 19.2% of the total population by 2024 [
1]. The rapid growth of the aging population indicates that South Korea is rapidly becoming a super-aged society. Aging is a natural response that occurs in living organisms over time [
2]. Most people experience decline in various physical functions as they enter old age, and the physical changes that have been occurring since middle age become noticeably severe [
3]. Over time, the aging process progresses rapidly in the elderly, causing symptoms such as deterioration of physical function, difficulty in chewing and swallowing, and decreased absorption of nutrients, all of which directly affect their health and quality of life [
4]. As aging progresses, the digestive functions of the stomach and large intestine deteriorate, and the pelvic muscles and anal functions also deteriorate; therefore, the digestive system problems that typically occur in the elderly due to the aforementioned symptoms are digestive disorders and constipation [
5,
6], and constipation is a condition that is likely to occur in the elderly who are hospitalized for a long period of time [
7]. Constipation in the elderly is caused by a combination of factors, including physical aging and inappropriate dietary habits, and the most important treatment is a diet that includes adequate fluid and dietary fiber [
5,
8]. Dietary fiber is classified as soluble or insoluble; insoluble dietary fiber helps increase the amount of stool and regulates bowel movements [
9]. Elderly people with poor digestive function should be cautious, because a sudden increase in dosage over a short period of time may cause symptoms such as bloating, belching, and diarrhea [
5]. Soluble dietary fiber is known to lower cholesterol levels and improve the lipid environment in the blood; in most cases, it is known to provide more health benefits than insoluble dietary fiber [
9]. Consumption of soluble dietary fiber is also recommended for elderly individuals who have digestive system disorders. There are several types of soluble dietary fibers, including β-glucan which is found in large amounts in oats, barley, and mushrooms [
9].
Mushrooms are rich in water, protein, carbohydrates, vitamins, and minerals [
10], with the wood ear mushroom,
Auricularia auricula-judae, being particularly notable for its high content of soluble dietary fiber such as beta-glucan, which is reported to aid in bowel movements [
11,
12]. This ear-shaped, brown or black fungus is commonly called to as the wood ear mushroom or jelly ear in Asia [
13].
A. auricula-judae has been widely used in Asia as an herbal medicine, a fermented food ingredient, and a source of antibiotics. Among the global producers, China is the largest, accounting for more than 90% of the total world production [
14]. Although its nutritional value and functional effects on the body have been extensively studied in Asia [
15] and other regions, this mushroom remains relatively less familiar in Western societies, such as Europe and the United States [
13].
A. auricula-judae is rich in polysaccharides, proteins, fats, vitamins, and minerals, and its polysaccharide, known as
Auricularia auricula polysaccharide (AAP), has been reported to alleviate chronic diseases such as diabetes, obesity, inflammation, and hyperglycemia [
16,
17,
18]. Although studies have reported that AAP slows the aging process and improves blood lipid levels [
19], systematic research on products containing AAP is lacking; therefore, the relevant characteristics of
A. auricula-judae products need to be investigated [
14]. Therefore, this study aimed to evaluate the effects of functional foods containing
A. auricula-judae powder on the body composition, nutritional status, and clinical indicators (including hematological markers and symptoms such as constipation) in middle-aged and older adults.
MATERIALS AND METHODS
Recruitment of participants and eligibility criteria
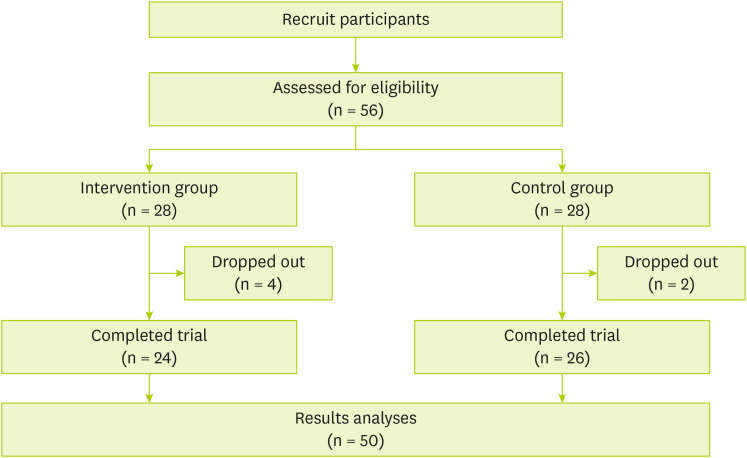
This study was conducted as a randomized, double-blind trial targeting middle-aged and older adults aged 50 years or older. Participants were recruited by posting advertisements in community institutions, such as public health and welfare centers. Participants with a history of inflammatory bowel disease, neurological disorders, mental illness, or chronic kidney disease; history of gastrointestinal surgery other than appendectomy or cholecystectomy; or chronic use of medications affecting the gastrointestinal system, such as antibiotics or bacteriostats, were excluded. Based on similar previous study [
20], a drop-out rate of 10% was expected, and 56 participants were recruited, with 28 allocated to each group (
Figure 1).
Figure 1Study flow sheet.

Study procedure
A total of 56 participants were recruited, of which 6, 2 from the control group and 4 from the intervention groups, dropped out during the study for personal reasons, leaving 50 participants enrolled. During the 8-week study, the participants visited the clinic once before and once after consuming the intervention food to undergo a physical assessment, including body composition and blood pressure measurements; blood analysis, including lipid levels and gut microbiota tests; and a survey. Prior to participation in the study, the researcher-in-charge explained the study procedures and observation parameters related to the consumption of the intervention food, and the participants provided informed consent. Participants were randomly assigned to the intervention group, which consumed an intervention food containing mushroom powder, or to the control group, which consumed a control product consisting of maltodextrin. Participants were assigned an identification code according to the order in which they enrolled in the study, and the study coordinator randomly assigned the participants according to a predetermined assignment code using the Excel randomization function. To ensure compliance with product consumption, the researchers assigned to each participant conducted twice-weekly phone monitoring. During these calls, they checked for product consumption, overall dietary intake, and any adverse reactions. In addition, an in-person interview was conducted 4 weeks after the product delivery to assess adherence, and the products were distributed for the remaining 4 weeks. Compliance with the intake of the intervention food was 100% in the intervention group and 98% in the control group. None of the participants met the study termination criteria specified in the study protocol. The composition of the foods provided to the intervention and control groups is presented in
Supplementary Table 1, which confirms that the nutritional values were equivalent with no significant differences (
Supplementary Table 1). This study was conducted from October to December 2022 and the protocol was approved by the Ethics Committee of Kyung Hee University (Approval No. KHGIRB-22-470).
Data on demographic characteristics and general lifestyle habits of the participants included sex, age, current presence of chronic diseases (hypertension, diabetes, and osteoporosis), subjective health status, subjective body perception, current alcohol consumption, current smoking, regular exercise, daily meal frequency, regular diet, eating speed, and appetite level. The nutritional status of the study participants was determined using the Mini Nutritional Assessment, which is a simple and short validated questionnaire designed to rapidly assess the nutritional status of elderly patients [
21]. The Korean version of the World Health Organization’s Short-Form Physical Activity Questionnaire, which consists of 7 questions about vigorous physical activity, moderate physical activity, walking, and sedentary activity over the past 7 days, was used as a self-report tool [
22].
The components of waist circumference and body composition were measured using a measuring tape measure and InBody S10 (InBody Co., Seoul, Korea), and systolic and diastolic blood pressure were measured using a portable blood pressure monitor (Citizen CH-452; Citizen Co., Tokyo, Japan) before and after the intervention as pre- and post-intervention data, respectively. Hematological biomarkers of total cholesterol, low-density lipoprotein (LDL) cholesterol, high-density lipoprotein cholesterol, and triglyceride concentrations were analyzed using a blood analyzer (Afinion2 analyzer; Abbott Co., Green Oaks, IL, USA).
Nutrient intake analysis
To determine the participants’ nutrient intake, all meals, including snacks, were examined and recorded for 3 days before and after the pre- and post-study visits. The recorded data were reviewed by a trained nutritionist, and the daily nutrient intake of each participant was analyzed using specialized nutrient analysis software (Can pro-6.0, Web ver.; Korean Nutrition Society, Seoul, Korea).
Assessment of constipation and intestinal microbiome status
The Constipation Assessment Scale (CAS), developed by McMillan and Williams (1989) [
23] was used to assess each participant’s bowel status. It consists of 8 questions regarding abdominal distension, amount of gas, number of bowel movements, appearance of stool, discomfort during bowel movements, rectal heaviness, amount of stool, and ease of bowel movement. The ROME II diagnostic criteria were also used to check the status of participants’ functional gastrointestinal disorders, including constipation [
24].
Continuous outcome variables analyzed in this study were presented as means and standard deviations, and categorical variables were presented as frequencies (and percentages). Changes in the intervention and control groups before and after the intervention were analyzed using the Wilcoxon signed-rank test. Differences between the groups at baseline were assessed using the Mann-Whitney U test, a nonparametric test used to compare independent samples. All analyses were performed using IBM SPSS Statistics (version 25.0; IBM Corp., Armonk, NY, USA), and significance was set at p < 0.05.
RESULTS
Comparison of general characteristics at baseline
The results of the comparison and significance according for each group are shown in
Table 1. The total study sample had a mean age of 66.9 years, and 76% of the sample were female. In terms of physical activity, 76.0% of the participants reported engaging in regular exercise. Although the participants maintained a relatively regular meal pattern, the risk of malnutrition was significantly high (68.0%).
Table 1Participants’ general characteristics at baseline
Table 1
|
Variables |
Total (n = 50) |
Control (n = 26) |
Intervention (n = 24) |
p value |
|
Sex |
|
|
|
0.862 |
|
Male |
12 (24.0) |
6 (23.1) |
5 (20.8) |
|
Female |
38 (76.0) |
20 (76.9) |
19 (79.2) |
|
Age (yr) |
66.9 ± 7.9 |
67.5 ± 4.0 |
66.1 ± 5.8 |
0.754 |
|
55–59 |
11 (22.0) |
5 (19.2) |
6 (25.0) |
0.469 |
|
60–69 |
20 (40.0) |
10 (38.5) |
10 (41.7) |
|
|
≥ 70 |
19 (38.0) |
9 (34.6) |
10 (41.7) |
|
|
Presence of chronic disease |
|
|
|
0.903 |
|
Yes |
31 (62.0) |
16 (61.5) |
15 (62.5) |
|
Subjective health status |
|
|
|
0.891 |
|
Good |
24 (48.0) |
12 (46.2) |
12 (50.0) |
|
Normal |
25 (50.0) |
13 (50.0) |
12 (50.0) |
|
Bad |
1 (2.0) |
1 (3.8) |
0 (0.0) |
|
Subjective body cognition |
|
|
|
0.620 |
|
Underweight |
4 (8.0) |
2 (7.7) |
2 (8.3) |
|
Normal |
27 (54.0) |
24 (92.3) |
23 (95.8) |
|
Overweight |
19 (38.0) |
9 (34.6) |
10 (41.7) |
|
Current alcohol consumption |
|
|
|
0.485 |
|
Yes |
24 (48.0) |
14 (53.8) |
10 (41.7) |
|
No |
26 (52.0) |
12 (46.2) |
14 (58.3) |
|
Current smoking |
|
|
|
0.776 |
|
Yes |
2 (4.0) |
1 (3.8) |
1 (4.2) |
|
Regular exercise |
|
|
|
0.509 |
|
Yes |
38 (76.0) |
13 (50.0) |
15 (62.5) |
|
IPAQ |
|
|
|
0.314 |
|
Met-min score |
2,904.3 ± 2,910.7 |
2,724.8 ± 1,750.6 |
2,830.1 ± 2,926.5 |
|
Daily meal frequency |
|
|
|
0.738 |
|
2 times per day |
20 (40.0) |
11 (42.3) |
10 (41.7) |
|
3 times per day |
30 (60.0) |
16 (61.5) |
14 (58.3) |
|
Regular diet |
|
|
|
0.520 |
|
Regular |
36 (72.0) |
19 (73.1) |
16 (66.7) |
|
Irregular |
14 (28.0) |
7 (26.9) |
8 (33.3) |
|
Eating speed |
|
|
|
0.412 |
|
Fast |
13 (26.0) |
7 (26.9) |
6 (25.0) |
|
Medium |
30 (60.0) |
16 (61.5) |
14 (58.3) |
|
Slowly |
7 (14.0) |
3 (11.5) |
4 (16.7) |
|
Appetite |
|
|
|
0.256 |
|
Always good |
30 (60.0) |
14 (53.8) |
16 (66.7) |
|
Normal |
19 (38.0) |
11 (42.3) |
8 (33.3) |
|
Always bad |
1 (2.0) |
1 (3.8) |
0 (0.0) |
|
Nutritional status by MNA |
|
|
|
0.791 |
|
Normal nutritional status |
16 (32.0) |
8 (30.8) |
8 (33.3) |
|
At risk of malnutrition |
34 (68.0) |
18 (69.2) |
16 (66.7) |
|
Malnourished |
0 (0.0) |
0 (0.0) |
0 (0.0) |
Comparison of changes in body composition and hematological markers
The changes in clinical indicators before and after the intervention in the intervention and control groups are summarized in
Table 2. A significant reduction in waist circumference was observed in the intervention group. Hematological assessment showed a significant decrease in triglyceride levels, while the mean levels of total cholesterol and LDL cholesterol showed a slight decrease that did not reach statistical significance. A significant reduction in body fat was observed in the control group. However, changes in waist circumference and abdominal obesity were not statistically significant. In addition, significant increases in total cholesterol and LDL cholesterol were observed in the control group.
Table 2Comparison of changes in body composition and hematological markers
Table 2
|
Variables |
Control (n = 26) |
Intervention (n = 24) |
p value†
|
|
Pre |
Post |
p value*
|
Pre |
Post |
p value*
|
|
Body mass index (kg/m2) |
25.0 ± 3.6 |
25.0 ± 3.6 |
0.768 |
24.9 ± 3.5 |
25.1 ± 3.4 |
0.366 |
0.690 |
|
Body fat (%) |
30.0 ± 7.3 |
28.3 ± 7.8 |
0.007 |
30.8 ± 7.7 |
30.0 ± 7.6 |
0.307 |
0.814 |
|
Waist circumference (cm) |
84.3 ± 9.4 |
83.4 ± 7.3 |
0.393 |
85.2 ± 8.7 |
82.5 ± 8.4 |
0.021 |
0.762 |
|
Abdominal obesity |
10 (38.5) |
10 (38.5) |
1.000 |
12 (50.0) |
9 (37.5) |
0.266 |
0.369 |
|
Systolic blood pressure (mmHg) |
132.7 ± 15.2 |
136.9 ± 18.6 |
0.261 |
131.0 ± 17.7 |
129.5 ± 31.6 |
0.822 |
0.860 |
|
Diastolic blood pressure (mmHg) |
76.9 ± 10.5 |
79.1 ± 11.2 |
0.722 |
75.7 ± 10.9 |
79.4 ± 13.0 |
0.055 |
0.639 |
|
Total cholesterol (mg/dL) |
179.7 ± 40.3 |
204.9 ± 40.3 |
0.000 |
175.8 ± 31.9 |
167.1 ± 35.8 |
0.064 |
0.544 |
|
≥ 200 mg/dL |
8 (30.8) |
14 (53.8) |
0.080 |
8 (33.3) |
6 (25.0) |
0.518 |
0.715 |
|
LDL cholesterol (mg/dL) |
85.2 ± 37.9 |
98.8 ± 38.2 |
0.033 |
87.5 ± 25.4 |
86.3 ± 28.8 |
0.788 |
0.508 |
|
≥ 100 mg/dL |
8 (30.8) |
11 (42.3) |
0.283 |
7 (29.2) |
7 (29.2) |
1.000 |
0.652 |
|
HDL cholesterol (mg/dL) |
60.6 ± 32.9 |
54.5 ± 12.4 |
0.380 |
59.8 ± 13.6 |
56.8 ± 9.1 |
0.363 |
0.707 |
|
< 55 mg/dL |
15 (57.7) |
17 (65.4) |
0.388 |
9 (37.5) |
8 (33.3) |
0.763 |
0.240 |
|
Triglyceride (mg/dL) |
168.4 ± 63.3 |
180.5 ± 51.7 |
0.130 |
180.0 ± 70.8 |
170.4 ± 57.4 |
0.016 |
0.195 |
|
≥ 150 mg/dL |
13 (50.0) |
19 (73.1) |
0.077 |
12 (50.0) |
13 (54.2) |
0.773 |
1.000 |
Changes in nutrient intake
Table 3 shows the changes in nutrient intake based on the participants’ dietary intakes before and after study. Considering the pre- and post-intervention changes in the intervention group, the average intakes of dietary fiber, vitamin B1, and folic acid increased significantly, whereas the control group showed significant changes in the intakes of energy, vitamin E, vitamin B1, vitamin B2, folic acid, and phosphorus. The change in dietary fiber intake in the control group was not significant, but showed a decreasing trend on average, and based on the results mentioned earlier, the average intake of vitamin E, vitamin B1, and folic acid was found to have increased significantly in both groups.
Table 3Changes of nutrient intakes
Table 3
|
Variables |
Control (n = 26) |
Intervention (n = 24) |
p value†
|
|
Pre |
Post |
p value*
|
Pre |
Post |
p value*
|
|
Energy (kcal) |
1,890.0 ± 184.8 |
2,017.1 ± 101.8 |
0.007 |
1,909.0 ± 250.1 |
2,002.9 ± 65.9 |
0.062 |
0.508 |
|
Carbohydrate (g) |
283.1 ± 51.4 |
296.8 ± 43.9 |
0.194 |
276.9 ± 50.9 |
287.2 ± 34.0 |
0.163 |
0.661 |
|
Protein (g) |
60.6 ± 9.4 |
65.6 ± 15.4 |
0.197 |
64.0 ± 16.5 |
70.1 ± 9.1 |
0.421 |
0.590 |
|
Fat (g) |
46.4 ± 17.5 |
53.6 ± 18.3 |
0.141 |
50.5 ± 15.6 |
56.6 ± 12.1 |
0.123 |
0.367 |
|
Fiber (g) |
13.1 ± 3.9 |
12.1 ± 7.8 |
0.518 |
12.3 ± 4.0 |
14.9 ± 5.2 |
0.043 |
0.442 |
|
Vitamins |
|
|
|
|
|
|
|
|
Vitamin A (ug) |
459.2 ± 208.0 |
499.6 ± 188.9 |
0.418 |
441.4 ± 173.9 |
514.0 ± 293.1 |
0.223 |
0.258 |
|
Retinol (ug) |
128.2 ± 113.6 |
111.4 ± 72.2 |
0.538 |
140.9 ± 127.1 |
151.8 ± 144.2 |
0.801 |
0.106 |
|
Betacarotin (ug) |
3,972.1 ± 2,377.1 |
4,658.2 ± 2,026.2 |
0.259 |
3,674.0 ± 1,559.9 |
4,346.5 ± 2,900.6 |
0.242 |
0.204 |
|
Vitamin D (ug) |
6.1 ± 3.2 |
6.3 ± 3.4 |
0.829 |
6.6 ± 2.3 |
8.0 ± 3.2 |
0.122 |
0.621 |
|
Vitamin E (ug) |
15.6 ± 4.7 |
20.8 ± 8.0 |
0.026 |
16.6 ± 5.2 |
19.4 ± 5.2 |
0.061 |
0.453 |
|
Vitamin K (ug) |
227.4 ± 137.6 |
237.4 ± 137.6 |
0.085 |
218.9 ± 138.2 |
275.0 ± 170.8 |
0.259 |
0.225 |
|
Vitamin C (mg) |
123.0 ± 76.0 |
119.6 ± 83.9 |
0.802 |
127.0 ± 64.7 |
106.4 ± 53.2 |
0.055 |
0.671 |
|
Vitamin B1 (mg) |
1.7 ± 0.4 |
2.0 ± 0.5 |
0.029 |
1.7 ± 0.5 |
2.1 ± 0.5 |
0.027 |
0.806 |
|
Vitamin B2 (mg) |
1.5 ± 0.4 |
1.7 ± 0.4 |
0.007 |
1.5 ± 0.5 |
1.7 ± 0.5 |
0.157 |
0.792 |
|
Niacin (mg) |
14.0 ± 4.3 |
14.8 ± 3.1 |
0.504 |
13.9 ± 3.8 |
14.7 ± 3.6 |
0.394 |
0.505 |
|
Vitamin B6 (mg) |
2.1 ± 1.1 |
2.0 ± 0.4 |
0.712 |
2.0 ± 1.6 |
2.4 ± 2.0 |
0.489 |
0.613 |
|
Folic acid (ug) |
532.5 ± 109.0 |
634.8 ± 163.0 |
0.000 |
492.8 ± 150.1 |
619.3 ± 152.1 |
0.006 |
0.224 |
|
Vitamin B12 (ug) |
10.9 ± 5.6 |
12.2 ± 4.3 |
0.239 |
9.1 ± 3.8 |
11.4 ± 7.2 |
0.074 |
0.104 |
|
Pantothenic acid (mg) |
5.0 ± 1.4 |
5.5 ± 1.5 |
0.207 |
5.0 ± 1.1 |
5.2 ± 1.0 |
0.430 |
0.875 |
|
Biotin (ug) |
1.8 ± 2.3 |
2.0 ± 2.8 |
0.672 |
2.6 ± 2.6 |
1.6 ± 2.8 |
0.232 |
0.084 |
|
Minerals |
|
|
|
|
|
|
|
|
Calcium (mg) |
586.3 ± 214.5 |
604.8 ± 210.1 |
0.690 |
548.3 ± 172.4 |
584.9 ± 198.2 |
0.306 |
0.207 |
|
Phosphorus (mg) |
1,144.5 ± 229.1 |
1,257.2 ± 249.8 |
0.016 |
1,151.2 ± 225.1 |
1,269.4 ± 210.7 |
0.904 |
0.591 |
|
Sodium (mg) |
3,704.9 ± 974.2 |
4,220.5 ± 901.9 |
0.022 |
3,724.4 ± 1,175.1 |
4,220.4 ± 800.5 |
0.116 |
0.464 |
|
Potassium (mg) |
3,168.4 ± 870.5 |
3,445.9 ± 1,190.4 |
0.135 |
3,031.1 ± 651.4 |
3,076.3 ± 407.6 |
0.788 |
0.532 |
|
Magnesium (mg) |
141.0 ± 45.1 |
139.4 ± 50.3 |
0.888 |
129.2 ± 60.0 |
147.6 ± 38.4 |
0.291 |
0.090 |
|
Iron (mg) |
18.1 ± 5.3 |
18.9 ± 4.2 |
0.558 |
16.3 ± 3.0 |
18.6 ± 6.5 |
0.108 |
0.115 |
|
Zinc (mg) |
11.0 ± 2.2 |
11.2 ± 2.4 |
0.844 |
10.8 ± 2.4 |
11.9 ± 2.6 |
0.193 |
0.408 |
|
Copper (ug) |
923.6 ± 523.8 |
817.2 ± 411.2 |
0.450 |
812.6 ± 288.7 |
744.1 ± 235.0 |
0.386 |
0.200 |
|
Manganese (mg) |
2.5 ± 1.1 |
2.4 ± 1.0 |
0.505 |
2.3 ± 1.1 |
2.4 ± 1.0 |
0.722 |
0.146 |
|
Selenium (ug) |
70.1 ± 27.8 |
72.1 ± 32.9 |
0.801 |
79.0 ± 39.7 |
75.2 ± 32.9 |
0.735 |
0.112 |
Changes of constipation and gut status
Table 4 presents the changes in constipation status and gut microbial environment before and after the intervention in the intervention group. Based on the results of the CAS and ROME II questionnaires, which assess self-perceived intestinal discomfort, no significant changes were observed in either the intervention or control groups. The mean scores for the diversity and balance of the gut microbial environment showed an increasing trend in the intervention group and a decreasing trend in the control group. However, these changes were not statistically significant.
Table 4Changes of constipation and gut status
Table 4
|
Variables |
Control (n = 26) |
Intervention (n = 24) |
p value†
|
|
Pre |
Post |
p value*
|
Pre |
Post |
p value*
|
|
Constipation |
|
|
|
|
|
|
|
|
CAS‡ (Yes) |
9 (34.6) |
7 (26.9) |
0.425 |
5 (20.8) |
5 (20.8) |
1.000 |
0.125 |
|
ROME II§ (Yes) |
8 (30.8) |
7 (26.9) |
0.713 |
5 (20.8) |
4 (16.7) |
0.575 |
0.064 |
|
Gut |
|
|
|
|
|
|
|
|
Diversity∥ score |
65.5 ± 12.0 |
63.0 ± 14.0 |
0.460 |
71.0 ± 12.0 |
71.6 ± 11.2 |
0.835 |
0.280 |
|
Balance¶ score |
69.3 ± 19.7 |
63.8 ± 20.7 |
0.232 |
62.4 ± 21.7 |
70.4 ± 19.4 |
0.172 |
0.179 |
DISCUSSION
This study aimed to determine the effects of a functional food containing powdered A. auricula-judae on constipation, overall gut health, and clinical factors in the elderly subjects. No significant findings were observed for variables related to constipation or the gut microbiome. However, significant changes were observed in the clinical indicators of the intervention group, including dietary fiber intake, waist circumference, and blood triglyceride levels.
Significant changes in the hematological markers of the study participants were observed in both the control and intervention groups. The intervention group showed significant improvements in waist circumference and blood triglyceride levels. The effect of
A. auricula-judae on blood lipid levels has been reported in previous studies; it is known to be a functional food due to its high fiber content [
25]. According to Chen et al. [
17], polysaccharides from
Auricularia auricula regulate lipid metabolism in the body, thereby alleviating obesity-related factors. In a previous study in which middle-aged women with abdominal obesity directly consumed
A. auricula-judae, the intervention group showed improved blood lipid levels, and the control group showed an increase in total cholesterol and LDL cholesterol levels, similar to the results of this study [
26]. However, the difference in our study was that the participants were elderly, and
A. auricula-judae was provided as an ingredient of a functional food rather than as a raw ingredient or extract solution.
Dietary fiber is the major polysaccharide component of
A. auricula-judae [
27], and AAP, a polysaccharide of
A. auricula-judae, has excellent biological functionality and has been shown to have effects on antioxidant, hypoglycemic, hypolipidemic, and immunomodulatory effects in various studies [
16,
17,
18]. Liu et al. [
28] reported that AAP affected lipid metabolism in the blood of mice and slowed weight gain in a study in which they provided an extract of
A. auricula-judae as a dietary supplement. In our study, the increase in dietary fiber intake was assessed after the end of the intervention; however, a clear analysis of this aspect increase is difficult, especially when compared with the slight decrease observed in the control group. This result may be due to the perceived effect of consuming functional foods. However, this aspect was not specifically investigated, which remains a limitation of this study. Among previous studies on dietary fiber intake in the elderly, Kim et al. [
29] reported that insufficient intake of vegetables and fruits, which are key sources of dietary fiber, was a significant risk factor for functional constipation in the elderly. Another study that analyzed data from the National Health and Nutrition Examination Survey data in the United States to determine the effects of dietary fiber intake on anemia and frailty in the elderly reported that adequate dietary fiber intake is an innovative dietary method for reducing frailty in the elderly [
30]. Therefore, the benefits of dietary fiber intake, such as AAP, are not limited to improving constipation in the elderly but also include various clinical improvements. Although the consumption of functional foods containing
A. auricula-judae in powder form is not the optimal method to achieve the above-mentioned clinical improvements, previous studies have also reported improvements in the blood lipid parameters.
This study has limitations such as the small sample size and the inability to confirm changes in intestinal conditions and clinical improvements after long-term consumption of functional foods containing A. auricula-judae powder. In addition, due to the small sample size, we were unable to confirm the clinical outcomes by varying the content of A. auricula-judae powder. Furthermore, although participant compliance and monitoring included management of daily food intake and specific dietary conditions (e.g., foods high in dietary fiber, high-fat meals, excessive eating out, and alcohol consumption), stricter dietary controls should be implemented in future studies to ensure more reliable results.
In conclusion, the consumption of functional foods containing A. auricula-judae is expected to improve dietary fiber intake, which is considered a factor in the occurrence of constipation in the elderly, and to provide health benefits such as improved blood lipid levels. Further research on the development and effectiveness of functional foods containing A. auricula-judae powder in the elderly is needed in the future.
National Research Foundation of Koreahttps://doi.org/10.13039/501100003725
5120200313836
NOTES
-
Funding: This research was supported by BK21 plus program AgeTech-Service Convergence Major through the National Research Foundation (NRF) funded by the Ministry of Education of Korea (5120200313836).
-
Conflict of Interest: The authors declare that they have no competing interests.
-
Author Contributions:
Conceptualization: Lim HS.
Data curation: Lim HS.
Formal analysis: Son EH.
Funding acquisition: Shin H.
Investigation: Jung DH.
Methodology: Kim Y, Lim HS.
Project administration: Lim HS.
Supervision: Lim HS.
Validation: Son EH.
Visualization: Lee S.
Writing - original draft: Son EH, Lim HS.
Writing - review & editing: Jung DH, Lim HS.
SUPPLEMENTARY MATERIAL
Supplementary Table 1
Comparison of composition per product provided in intervention and control groups
cnr-14-7-s001.xls
REFERENCES
- 1. Korean Statistical Information Service. 2024 Statistics on the aged. 2024. cited 2024 December 1. Available from http://kostat.go.kr
- 2. Dziechciaż M, Filip R. Biological psychological and social determinants of old age: bio-psycho-social aspects of human aging. Ann Agric Environ Med 2014;21:835-838.
- 3. Lim JH, Lee JO. The relationship between body composition change and muscle strength and endurance depending on aging at the senescence. J Korean Geriatr Soc 2001;21:15-24.
- 4. Lee SH, Lee SL. A basic study to establish a nutrition education system for welfare facilities for the elderly at home using body composition analysis and nutritional management cards. Korean J Community Living Sci 2024;35:471-482.
- 5. Park KS. Constipation in the elderly. Korean J Med 2010;78:309-313.
- 6. Bouras EP, Tangalos EG. Chronic constipation in the elderly. Gastroenterol Clin North Am 2009;38:463-480.
- 7. Kang HS, Kim I. The effects of life style modification on constipation of the older adults at a geriatric hospital. Korean J Rehabil Nurs 2017;20:52-60.
- 8. Jani B, Marsicano E. Constipation: evaluation and management. Mo Med 2018;115:236-240.
- 9. Tian M, Pak S, Ma C, Ma L, Rengasamy KRR, et al. Chemical features and biological functions of water-insoluble dietary fiber in plant-based foods. Crit Rev Food Sci Nutr 2024;64:928-942.
- 10. Ghosh S, Acharya K. Milky mushroom: a healthy nutritious diet. Food Res Int 2022;156:111113.
- 11. Kim TI, Park SJ, Choi CH, Lee SK, Kim WH. Effect of ear mushroom (Auricularia) on functional constipation. Korean J Gastroenterol 2004;44:34-41.
- 12. Islam T, Ganesan K, Xu B. Insights into health-promoting effects of Jew’s ear (Auricularia auricula-judae). Trends Food Sci Technol 2021;114:552-569.
- 13. Liu E, Ji Y, Zhang F, Liu B, Meng X. Review on Auricularia auricula-judae as a functional food: growth, chemical composition, and biological activities. J Agric Food Chem 2021;69:1739-1750.
- 14. Miao J, Regenstein JM, Qiu J, Zhang J, Zhang X, et al. Isolation, structural characterization and bioactivities of polysaccharides and its derivatives from Auricularia-a review. Int J Biol Macromol 2020;150:102-113.
- 15. Yu T, Wu Q, Liang B, Wang J, Wu D, et al. The current state and future prospects of Auricularia auricula’s polysaccharide processing technology portfolio. Molecules 2023;28:582.
- 16. Pak S, Chen F, Ma L, Hu X, Ji J. Functional perspective of black fungi (Auricularia auricula): major bioactive components, health benefits and potential mechanisms. Trends Food Sci Technol 2021;114:245-261.
- 17. Chen N, Zhang H, Zong X, Li S, Wang J, et al. Polysaccharides from Auricularia auricula: preparation, structural features and biological activities. Carbohydr Polym 2020;247:116750.
- 18. Wang J, Zhang T, Liu X, Fan H, Wei C. Aqueous extracts of se-enriched Auricularia auricular attenuates D-galactose-induced cognitive deficits, oxidative stress and neuroinflammation via suppressing RAGE/MAPK/NF-κB pathway. Neurosci Lett 2019;704:106-111.
- 19. Xiao B, Chen S, Huang Q, Tan J, Zeng J, et al. The lipid lowering and antioxidative stress potential of polysaccharide from Auricularia auricula prepared by enzymatic method. Int J Biol Macromol 2021;187:651-663.
- 20. Shim HW. Effects of sea tangle pellet on constipation in institutionalized aged. J Korean Gerontol Nurs 2008;10:131-141.
- 21. Vellas B, Guigoz Y, Garry PJ, Nourhashemi F, Bennahum D, et al. The Mini Nutritional Assessment (MNA) and its use in grading the nutritional state of elderly patients. Nutrition 1999;15:116-122.
- 22. Chun MY. Validity and reliability of Korean version of international physical activity questionnaire short form in the elderly. Korean J Fam Med 2012;33:144-151.
- 23. McMillan SC, Williams FA. Validity and reliability of the Constipation Assessment Scale. Cancer Nurs 1989;12:183-188.
- 24. Barberio B, Judge C, Savarino EV, Ford AC. Global prevalence of functional constipation according to the Rome criteria: a systematic review and meta-analysis. Lancet Gastroenterol Hepatol 2021;6:638-648.
- 25. Reza MA, Hossain MA, Damte D, Jo WS, Hsu WH, et al. Hypolipidemic and hepatic steatosis preventing activities of the wood ear medicinal mushroom Auricularia auricula-judae (higher basidiomycetes) ethanol extract in vivo and in vitro. Int J Med Mushrooms 2015;17:723-734.
- 26. Han JS, Kim JK, Kim AJ. The effects of Auricularia auricula-judae on blood lipids profile and bone density of middle aged abdominal obese women. Korean J Food Nutr 2012;25:1075-1080.
- 27. Kadnikova IA, Costa R, Kalenik TK, Guruleva ON, Yanguo S. Chemical composition and nutritional value of the mushroom Auricularia auricula-judae
. J Food Nutr Res (Newark) 2015;3:478-482.
- 28. Liu Q, Ma R, Li S, Fei Y, Lei J, et al. Dietary supplementation of Auricularia auricula-judae polysaccharides alleviate nutritional obesity in mice via regulating inflammatory response and lipid metabolism. Foods 2022;11:942.
- 29. Kim HJ, Won CW, Choi HR, Kim BS, Kim JE, et al. Prevalence and risk factors of functional constipation in the elderly. J Korean Acad Fam Med 2006;27:693-698.
- 30. Zhang H, Wei X, Pan J, Chen X, Sun X. Anemia and frailty in the aging population: implications of dietary fiber intake (findings of the US NHANES from 2007-2018). BMC Geriatr 2023;23:634.