ABSTRACT
This study was conducted to evaluate changes in hydrogen breath test results and nutritional improvements when Korean adults diagnosed with lactose intolerance consumed processed milk containing approximately 10 g of lactose continuously. Participants consumed 240 mL of intervention food daily for a month and visited the research institute before and after the intervention to undergo nutrient intake survey and hydrogen breath tests. Data from 32 participants, with a mean age of 52.9 years, were analyzed. Hydrogen breath tests showed a significant decrease in hydrogen levels at all but baseline and the first of five 20-minute intervals of expiratory hydrogen concentration measurements. The third and fourth measurements showed the most significant changes (p < 0.001). The gastrointestinal symptoms showed a decreasing trend. Nutrient intake analysis demonstrated significant increases in animal protein (p < 0.001), calcium (p < 0.001), percentage of energy from protein (p = 0.032), vitamin A (p = 0.032), and retinol levels (p = 0.023). Regarding dietary habits, significant improvements were observed in nutritional quotient variables, including nutritional score (p = 0.042) and balance (p = 0.034). This study suggests that the removal of lactose and dairy products is not necessary for individuals with lactose intolerance. Incorporating low-lactose processed milk into their usual diet might be a practical dietary management strategy.
-
Keywords: Lactose intolerance; Lactose; Breath test; Nutrient intake
INTRODUCTION
Lactose intolerance is characterized by gastrointestinal symptoms such as abdominal bloating, pain, and diarrhea after consuming lactose-containing foods or beverages [
1]. Approximately 65% of the global population is estimated to have lactose intolerance, with its prevalence varying depending on ethnicity. It is less common among individuals of European descent but more prevalent among African Americans, Hispanics, and Asians [
2,
3]. Lactose intolerance is particularly common in East Asia, with a reported prevalence of > 70% in South Korea [
4]. The most commonly used diagnostic method for lactose intolerance is the hydrogen breath test [
5]. This test leverages the normal gut microbiota, metabolizing lactose into hydrogen and short-chain fatty acids (SCFAs). Hydrogen is absorbed and enters the systemic circulation via the liver, eventually exhaled through the lungs [
6]. An increase of more than 20 ppm in breath hydrogen levels compared to the baseline after lactose ingestion indicates lactose intolerance.
Lactose, a disaccharide composed of glucose and galactose linked by a β-1,4 glycosidic bond, is found in many dairy products. Its digestion requires lactase, which hydrolyzes lactose into its constituent monosaccharides [
7]. Lactase activity decreases with age. Without sufficient lactase, some of ingested lactose remains unabsorbed and reaches the colon [
8]. In the colon, undigested lactose is fermented by the gut bacteria to produce SCFAs, hydrogen, carbon dioxide, and methane [
9]. This fermentation increases colonic osmotic pressure, alters intestinal motility, and may lead to gastrointestinal symptoms such as abdominal pain or diarrhea [
10]. Milk, which contains lactose, is an excellent source of calcium, protein, and micronutrients such as phosphorus, potassium, magnesium, iron, zinc, and fat-soluble vitamins [
11]. According to the 2023 Consumer Behavior Survey for Foods in South Korea, plain milk is the most consumed beverage, accounting for 52.4% of 16 beverage types. Plain milk ranked third with 8.9% of respondents for a question about favorite beverages, indicating a high preference for actual consumption [
12]. Individuals with lactose intolerance are presumed to avoid milk consumption. Laaksonen et al. [
13] reported that adults with lactase non-persistence (LNP) consumed milk twice less frequently than those who had lactase. Moreover, the symptoms of lactose intolerance can resemble those of irritable bowel syndrome or other gastrointestinal disorders, leading certain individuals with lactase persistence to mistakenly self-diagnose themselves as lactose intolerant [
14]. Such misdiagnoses can result in the unnecessary exclusion of milk and dairy products from the diet [
14]. Carroccio et al. [
15] reported that an incorrect diagnosis of lactose intolerance contributed to reduced milk consumption.
Reduced milk consumption can lead to nutritional deficiencies. According to the Korea National Health and Nutrition Survey, the intake of riboflavin, calcium, phosphorus, and potassium significantly differs depending on the frequency of milk consumption [
16]. Larson et al. [
17] reported that children with lactose intolerance consumed only 45% of the recommended dietary calcium. Furthermore, as these individuals grow into young adults, their calcium intake remains significantly lower, implying a potential long-term nutritional imbalance [
17]. Strategies to alleviate lactose intolerance include directly consuming enzyme supplements, consuming low-lactose products treated with enzymes, or consuming products supplemented with probiotics. Studies have shown that consuming enzyme preparations in dairy products significantly reduces hydrogen production and alleviates symptoms [
18]. Lin reported that milk supplemented with
Lactobacillus acidophilus or
Lactobacillus bulgaricus effectively reduced hydrogen production and symptoms [
19]. In addition, gradual and consistent lactose consumption can improve lactose intolerance. A study involving Asian adults reported that gradually increasing lactose intake reduced breath hydrogen levels and symptoms [
20]. Because symptomatic responses of lactose malabsorption are associated with the amount of unabsorbed lactose, excessive milk consumption without considering individual digestive capacity may trigger symptoms of lactose intolerance.
This study aimed to evaluate changes in hydrogen breath test results, gastrointestinal symptoms, and nutritional improvements in Korean adults diagnosed with lactose intolerance when low-lactose processed milk was incorporated into their usual diet.
MATERIALS AND METHODS
Participants
This was a single-arm observational interventional clinical trial targeting males and females aged 18–74 who self-identified as experiencing symptoms of lactose intolerance. Recruitment was conducted through announcements at local community centers and research institutions. Individuals were excluded if they were treated or were on medications for gastrointestinal diseases, had undergone any abdominal surgery within the past year, had an allergic reaction to lactose, were currently taking antibiotics, diagnosed as diabetes or prediabetes, or had an aversion to consuming banana-flavored milk.
The sample size was determined based on the previous study evaluating the clinical effects of flavored milk in lactose intolerant individuals [
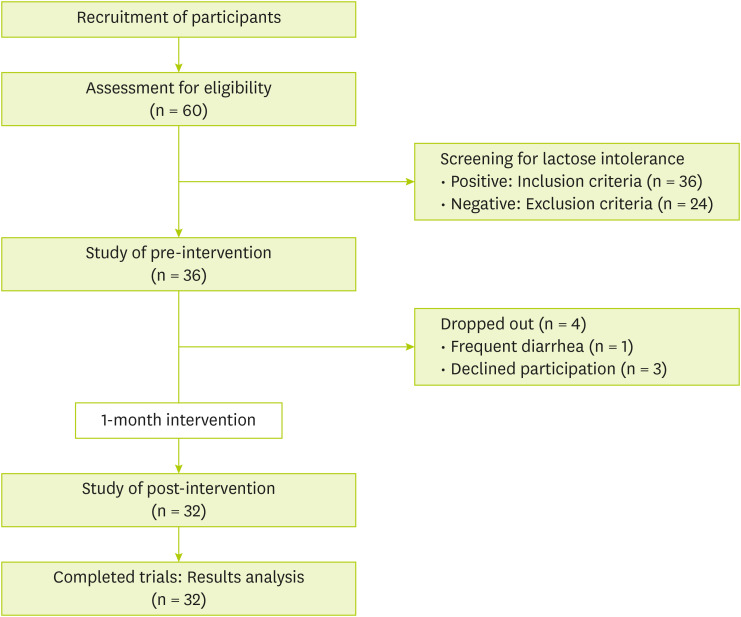
21]. Using an effect size of 0.5, a significance level (α) of 0.05, and a statistical power (1-β) of 95%, the number of the subjects was calculated as 32. To account for potential dropouts, 36 participants were recruited.
Sixty people agreed to the participate in the study. They were told about the study process, including food for intervention, evaluation before and after the intervention, and precautions during the study period. During the study, four participants dropped out: one due to a strong aversion to the intervention food and three for personal reasons. Consequently, 32 participants were enrolled in the study and assigned unique IDs for identification. The study subjects were instructed to eat three balanced meals and snacks a day. Participants were provided with 240 mL of banana-flavored milk daily for a month, from April to May 2024, which was determined by considering sugar content of the flavored milk. The banana-flavored milk used in this study was a commercially available product in South Korea, containing 10.2 g of lactose, 27 g of carbohydrates, 7 g of protein, and 8 g of fat. A designated researcher was assigned to each participant to monitor compliance with the intervention food consumption and to record any adverse events, dietary intake, probiotic supplementation, or dairy consumption. Weekly monitoring was conducted via telephone throughout the intervention period. During the intervention period, participant compliance was 99%, and no criteria for the study termination in the research protocol were met. The flowchart of this study is shown in
Figure 1. The study was conducted from January to June 2024. The protocol was approved by the Ethics Committee of Kyung Hee University (approval No.: KHGIRB-24-039).
Figure 1Study flowchart.
Hydrogen breath test and evaluation of gastrointestinal symptoms
For the standard hydrogen breath tests, 25 g of lactose is typically used, and a difference of 20 ppm or more in hydrogen levels between pre- and post-lactose ingestion is considered a positive indicator of lactose intolerance [
22]. However, some studies have used 10 g of lactose to diagnose lactose intolerance [
23,
24]. In this study, the hydrogen breath test was conducted using 10 g of lactose, reflecting the lactose content of the intervention food. Participants were instructed to fast for 8 hours, abstain from smoking for 24 hours, and avoid consuming dairy products, high-fiber foods, and probiotics before the test. The measurements were conducted using a Twin Breasor 2 (iSenLab Co., Seongnam, Korea); once before lactose intake and five times every 20 minutes after ingestion, for a total of 100 minutes [
22,
23,
24]. This procedure was conducted both pre- and post-intervention. During the 6 measurement sessions, participants were asked to evaluate the symptoms of lactose intolerance, including abdominal pain, nausea, belching, indigestion, abdominal bloating, flatulence, abdominal cramping, and diarrhea, using a 0–4 Likert scale (0 = no symptoms, 1 = mild, 2 = moderate, 3 = strong, and 4 = severe symptoms). The questionnaire used to assess symptoms of lactose intolerance was developed by the researchers through a review of diagnostic forms utilized in gastrointestinal testing at domestic university hospitals and relevant prior studies. Symptom severity was assessed in each session following lactose ingestion, and the total symptom score was calculated.
The demographic data of the participants included sex, age, smoking habits, alcohol consumption, and adherence to regular exercise regimens. Additionally, participants were surveyed regarding their symptoms following dairy consumption, frequency of consumption, dairy product preferences, and attitudes toward dairy consumption when symptoms of lactose intolerance occurred. Dairy products included plain milk, flavored milk, low-fat milk, lactose-free milk, liquid yogurt, yogurt, and cheese.
Dietary habits and nutrient intake assessment
To evaluate participants’ dietary habits, the Nutrition Quotient (NQ) tool, developed by the Korean Ministry of Health and Welfare for adults, was used [
25]. This questionnaire comprises 20 items designed to provide insights into participants' dietary patterns and lifestyle behaviors. Responses were converted into scores reflecting balance, moderation, practice, and overall nutritional status. In addition, participants recorded all foods and beverages consumed for three days before and after the intervention period to analyze their daily nutrient intake. The daily nutrient intake of each participant was calculated using professional nutrient analysis software (Can-Pro 6.0, web ver.; Korean Nutrition Society, Seoul, Korea).
Statistical analyses were performed using IBM SPSS Statistics (version 25.0; IBM Corp., Armonk, NY, USA), and statistical significance was set at p < 0.05. Continuous variables were expressed as means and standard deviations, while categorical variables were expressed as frequencies (percentages). Changes before and after the intervention in a single group were analyzed using paired t-tests.
RESULTS
General characteristics
The general characteristics of the participants are presented in
Table 1. About twenty eight percent were male, and 71.9% were female, with a mean age of 52.9 ± 18.8 years. Additionally, 53.1% of the participants reported adherence to regular exercise. Yakult and yogurt were the most favored dairy product, accounting for 18.8% of participants’ preferences. However, more than half of the participants (63.8%) reported that they rarely consumed dairy products. Among the symptoms experienced after dairy consumption, diarrhea was the most frequently reported, accounting for 27.6% of patients. When analyzing participants’ tendencies to consume dairy products after experiencing symptoms of lactose intolerance, 41.1% responded with “Consume only after symptoms subside,” while 33.0% reported “Avoid consumption permanently.”
Table 1Participants’ baseline characteristics
Table 1
|
Variables |
Total (n = 32) |
|
Sex |
|
|
Male |
9 (28.1) |
|
Female |
23 (71.9) |
|
Age (yr) |
52.9 ± 18.8 |
|
18–44 |
10 (31.3) |
|
45–64 |
12 (37.4) |
|
65–74 |
10 (31.3) |
|
Smoking |
|
|
Smoker |
1 (3.1) |
|
Nonsmoker |
30 (93.8) |
|
Ex-smoker |
1 (3.1) |
|
Drinking |
|
|
Drinker |
16 (50.0) |
|
Nondrinker |
15 (46.9) |
|
Ex-drinker |
1 (3.1) |
|
Exercise |
|
|
Regular |
17 (53.1) |
|
Stopped exercise |
4 (12.5) |
|
None |
11 (34.4) |
|
Dairy product preferences |
|
|
White milk |
4 (12.5) |
|
Flavored milk |
5 (15.6) |
|
Low-fat milk |
3 (9.4) |
|
Lactose-free milk |
3 (9.4) |
|
Yakult |
6 (18.8) |
|
Yogurt |
6 (18.8) |
|
Cheese |
5 (15.6) |
|
Symptoms after dairy consumption*
|
|
|
Diarrhea |
45 (27.6) |
|
Gas retention |
41 (25.2) |
|
Abdominal bloating |
36 (22.1) |
|
Borborygmus and flatulence |
25 (15.3) |
|
Abdominal pain and cramps |
11 (6.7) |
|
Nausea |
5 (3.1) |
|
Frequency of dairy food consumption†
|
|
|
Daily |
18 (8.0) |
|
5–6 times a week |
7 (3.1) |
|
3–4 times a week |
13 (5.8) |
|
1–2 times a week |
43 (19.2) |
|
Rarely consumed |
143 (63.8) |
|
Attitude of consumption when symptomatic†
|
|
|
Continue to eat dairy products despite discomfort |
41 (18.3) |
|
Attempt to consume dairy products periodically |
17 (7.6) |
|
Consume dairy product only after symptoms subside |
92 (41.1) |
|
Avoid dairy product intake permanently |
74 (33.0) |
Changes in hydrogen breath test and gastrointestinal symptom scores
The changes in hydrogen levels in exhaled breath before and after the consumption of the intervention food, as well as the changes in gastrointestinal symptom scores assessed during the hydrogen breath test, are summarized in
Table 2. Although no significant changes were observed in mean hydrogen breath levels between baseline and the first measurement after lactose ingestion, significant differences were noted in mean hydrogen levels between the second and final measurements. Regarding gastrointestinal symptom scores, a significant reduction was observed in abdominal cramping. Although the mean scores for other gastrointestinal symptoms decreased, these reductions were not statistically significant.
Table 2Changes in the results of hydrogen breath test and gastrointestinal symptom scores
Table 2
|
Variables |
Subjects (n = 32) |
|
Pre-intervention |
Post-intervention |
p value |
|
Average hydrogen breath level (ppm)*
|
|
|
|
|
Baseline |
35.12 ± 32.94 |
33.81 ± 36.15 |
0.853 |
|
1st |
45.02 ± 37.09 |
32.52 ± 34.82 |
0.111 |
|
2nd |
54.22 ± 37.16 |
30.68 ± 37.06 |
0.007
|
|
3rd |
80.13 ± 41.89 |
42.26 ± 40.99 |
< 0.001
|
|
4th |
96.74 ± 39.49 |
52.53 ± 46.18 |
< 0.001
|
|
5th |
98.87 ± 38.97 |
66.91 ± 50.86 |
0.007
|
|
Scores of gastrointestinal symptom†
|
|
|
|
|
Abdominal pain |
1.12 ± 2.29 |
0.64 ± 1.39 |
0.143 |
|
Nausea |
0.52 ± 1.03 |
0.33 ± 0.85 |
0.447 |
|
Belching |
2.30 ± 3.25 |
1.67 ± 2.86 |
0.364 |
|
Indigestion |
0.55 ± 1.77 |
0.12 ± 0.70 |
0.217 |
|
Bloating |
2.30 ± 3.37 |
2.03 ± 3.41 |
0.752 |
|
Bubbling |
5.00 ± 4.12 |
3.58 ± 4.02 |
0.151 |
|
Abdominal cramping |
0.91 ± 1.94 |
0.06 ± 0.35 |
0.021
|
|
Diarrhea |
0.39 ± 1.03 |
0.30 ± 1.16 |
0.750 |
Changes in nutrient intake
Table 3 provides the changes in nutrient intake among the study participants before and after incorporating the low-lactose intervention food into their diet. No significant changes were observed in total energy and carbohydrate intake; however, protein intake increased significantly. Among the subcategories, animal protein intake and the proportion of energy derived from protein demonstrated statistically significant increase, whereas plant-based protein intake significantly decreased. Similarly, animal-based fat intake showed a significant increase, whereas plant-based fat intake significantly decreased. Vitamin A, retinol, and riboflavin intakes significantly increased, but vitamin D intake decreased. Calcium and phosphorus intakes showed significant increase, whereas selenium intake decreased significantly.
Table 3Changes of nutrient intake
Table 3
|
Variables |
Subjects (n = 32) |
|
Pre |
Post |
p value |
|
Energy (kcal) |
1,603.67 ± 374.80 |
1,617.34 ± 311.40 |
0.864 |
|
Dietary fiber (g) |
20.35 ± 6.90 |
18.51 ± 7.84 |
0.191 |
|
Carbohydrates (g) |
223.65 ± 47.75 |
237.07 ± 53.73 |
0.240 |
|
Percentage of energy from carbohydrate (%) |
56.66 ± 8.95 |
58.46 ± 5.70 |
0.305 |
|
Protein (g) |
60.65 ± 13.94 |
65.85 ± 16.14 |
0.062 |
|
Plant-based protein (g) |
31.09 ± 8.10 |
27.26 ± 8.46 |
0.025
|
|
Animal-based protein (g) |
29.55 ± 11.68 |
38.59 ± 13.04 |
< 0.001
|
|
Percentage of energy from protein (%) |
15.31 ± 2.41 |
16.27 ± 2.46 |
0.032
|
|
Fat (g) |
41.86 ± 13.95 |
41.80 ± 9.98 |
0.980 |
|
Plant-based fat (g) |
23.80 ± 9.14 |
16.45 ± 4.97 |
< 0.001
|
|
Animal-based fat (g) |
18.06 ±10.70 |
25.35 ± 8.32 |
0.001
|
|
Percentage of energy from fat (%) |
23.58 ± 5.93 |
23.45 ± 4.35 |
0.906 |
|
Vitamins |
|
|
|
|
Vitamin A (μg) |
347.34 ± 182.65 |
444.77 ± 187.15 |
0.032
|
|
Retinol (μg) |
97.26 ± 81.64 |
136.27 ± 42.94 |
0.023
|
|
Beta-carotene (μg) |
3,000.97 ± 1944.94 |
3,702.02 ± 2,260.01 |
0.156 |
|
Vitamin D (μg) |
1.82 ± 1.42 |
1.32 ± 1.24 |
0.047
|
|
Vitamin E (mg) |
11.11 ± 3.82 |
9.62 ± 3.76 |
0.080 |
|
Vitamin K (μg) |
231.96 ± 189.73 |
271.80 ± 225.06 |
0.363 |
|
Vitamin C (mg) |
61.98 ± 45.08 |
67.33 ± 36.01 |
0.550 |
|
Thiamine (mg) |
1.13 ± 0.31 |
1.12 ± 0.31 |
0.928 |
|
Riboflavin (mg) |
1.21 ± 0.33 |
1.43 ± 0.38 |
0.007
|
|
Niacin (mg NE) |
9.77 ± 2.46 |
9.40 ± 3.16 |
0.485 |
|
Vitamin B6 (mg) |
0.389 ± 0.208 |
0.388 ± 0.171 |
0.983 |
|
Folate (μg) |
251.40 ± 99.56 |
264.73 ± 115.50 |
0.562 |
|
Vitamin B12 (μg) |
3.04 ± 2.89 |
6.21 ± 12.29 |
0.161 |
|
Pantothenic acid (mg) |
3.22 ± 1.14 |
3.10 ± 1.23 |
0.681 |
|
Minerals |
|
|
|
|
Calcium (mg) |
408.05 ± 169.08 |
629.19 ± 198.70 |
< 0.001
|
|
Phosphorus (mg) |
948.89 ± 250.70 |
1,060.19 ± 234.25 |
0.024
|
|
Sodium (mg) |
3,344.11 ± 949.67 |
3,503.56 ± 949.67 |
0.314 |
|
Chloride (mg) |
27.87 ± 83.46 |
13.99 ± 12.92 |
0.369 |
|
Potassium (mg) |
2,225.52 ± 697.81 |
2,379.93 ± 738.36 |
0.266 |
|
Magnesium (mg) |
234.29 ± 101.20 |
213.46 ± 97.73 |
0.136 |
|
Iron (mg) |
12.21 ± 5.61 |
12.04 ± 4.41 |
0.880 |
|
Zinc (mg) |
7.02 ± 1.94 |
7.23 ± 1.80 |
0.600 |
|
Copper (μg) |
732.71 ± 324.61 |
642.96 ± 352.99 |
0.171 |
|
Manganese (mg) |
2.61 ± 1.20 |
2.30 ± 0.93 |
0.181 |
|
Iodine (μg) |
146.82 ± 429.51 |
141.83 ± 172.99 |
0.950 |
|
Selenium (μg) |
67.01 ± 23.15 |
56.89 ± 21.02 |
0.042
|
Changes in nutrition quotient (NQ)
Table 4 provides the analysis of participants’ responses to the NQ survey before and after the intervention with the study food. The mean score in the balance category increased from 40.0 ± 17.6 to 43.9 ± 17.0, and the overall nutritional score increased from 57.8 ± 13.2 to 60.4 ± 12.2, both showing statistically significant changes.
Table 4Changes of Nutrition Quotient
Table 4
|
Variables |
Subjects (n = 32) |
|
Pre |
Post |
p value |
|
Nutritional score |
57.8 ± 13.2 |
60.4 ± 12.2 |
0.042
|
|
Balance score |
40.0 ± 17.6 |
43.9 ± 17.0 |
0.034
|
|
Moderation score |
69.1 ± 16.9 |
69.9 ± 17.2 |
0.728 |
|
Practice score |
62.8 ± 15.0 |
65.6 ± 14.7 |
0.180 |
DISCUSSION
This study aimed to evaluate the changes in exhaled hydrogen levels, gastrointestinal symptoms, and nutritional improvements in Korean adults diagnosed with lactose intolerance by providing them with low-lactose processed milk containing a tolerable amount of lactose without triggering symptoms. The primary findings of this study included significant improvements in nutritional aspects such as increased intake of animal protein and calcium, changes in mean hydrogen levels detected during hydrogen breath tests, improvements in gastrointestinal symptoms, and significant enhancements in some NQ scores.
Various approaches exist to manage lactose intolerance. Historically, the primary recommendation was to eliminate milk and dairy products from the diet; however, recent guidelines suggest maintaining minimal lactose intake [
14]. However, in the dairy-related survey results of the study participants, the most preferred dairy products were fermented foods such as yakult and yogurt, followed by cheese and flavored milk, while milk, low-fat milk, and lactose-free milk ranked lower. The frequency of dairy consumption was reported to be low in more than half of the participants, consistent with previous studies reporting lower milk consumption frequency among adults with LNP [
13]. Additionally, low dairy consumption among the participants was presumed to be closely related to the gastrointestinal symptoms experienced after consumption and subsequent behavioral responses. Despite the low preference for dairy products among the participants, our study implemented an intervention with continuous lactose consumption as a management strategy for lactose intolerance. Significant improvements were observed in the hydrogen breath test results, with a notable reduction in the average hydrogen breath level at all time points except for the first measurement after lactose ingestion. Furthermore, the severity of abdominal cramping assessed during the test was significantly reduced. Ramakrishnan et al. Previous studies using lactose-free chocolate milk have demonstrated significant changes in hydrogen breath test results and improvements in gastrointestinal symptoms, which is consistent with our findings and further supports the effectiveness of dietary interventions in managing lactose intolerance [
21]. However, unlike previous studies, including the work by Montalto et al. [
26], this study provided commercially available low-lactose processed milk containing approximately 10 g of lactose, offering an easily accessible and practical management method for everyday life. Additionally, the continuous intervention for a month was the distinguished point of this study, highlighting the potential benefits of prolonged dietary strategies. In addition to the hydrogen breath test, we observed significant changes in participants’ dietary habits using NQ and nutrient intake. Milk is generally regarded as an important source of protein, essential minerals such as calcium, phosphorus, potassium and magnesium, fat-soluble vitamins, and various micronutrients [
11]. Previous studies have reported that flavored milk provides the same essential nutrients as regular milk [
27]. We suggest that the addition of the intervention food to the participants’ diet led to a shift in nutrient intake, with increased consumption of protein and lipids from animal sources and a corresponding decrease in plant-based protein intake. Furthermore, this dietary shift is presumed to have significantly contributed to the observed increases in vitamin A, retinol, and calcium intake. The increase in protein intake among participants suggests several possibilities. Milk proteins, such as casein, facilitate the transport and absorption of calcium and phosphorus and serve as precursors to various bioactive peptides that provide health benefits, including antihypertensive effects [
28]. Jauhiainen and Korpela [
28] reported that milk consumption and dairy protein intake reduced the risk of hypertension, attributing this effect to components derived from milk proteins. Similarly, Thorning et al. [
29] stated that consuming 200–300 mL of milk or dairy products daily is inversely associated with the risk of hypertension and stroke. The increase in calcium intake among participants was noteworthy. According to the dietary reference intake for Koreans provided by the Ministry of Health and Welfare, the recommended daily calcium intake for adults is 700–800 mg. Our findings suggest that despite lactose intolerance, participants achieved near-recommended levels of calcium intake after the intervention [
30]. As previously mentioned, significant changes in participants’ NQ scores were observed. These changes are likely related to improved nutrient intake levels, though they cannot be solely attributed to the intervention. They are considered to be the result of a combination of factors, including improved perceptions of dairy products due to the participants’ continuous consumption of low-lactose processed milk, as well as the nutrition education and monitoring conducted during the study.
This study has limitations, including a small sample size and the inability to observe participants’ long-term nutritional changes beyond one month of intervention. Furthermore, even with periodic monitoring and dietary control, changes in nutrient intake that were not directly caused by the intervention food were observed. Another limitation is the absence of hematological and clinical variables related to preventable diseases associated with the nutritional improvements discussed in this study. Despite the low lactose content, potential long-term health concerns associated with consuming sugars and fats in low-lactose processed milk should not be underestimated, underscoring the need for long-term designed studies in the future.
CONCLUSION
In conclusion, the continuous consumption of low-lactose processed milk containing a tolerable amount of lactose that does not induce gastrointestinal symptoms in individuals with lactose intolerance can reduce exhaled hydrogen levels and mitigate lactose intolerance symptoms. Furthermore, it can enhance the intake of essential nutrients, including animal proteins and calcium, that are often absent in such individuals. This study suggests that lactose intolerance management does not necessarily require the extreme elimination of lactose and dairy products. Instead, improvements can be achieved by incorporating low-lactose processed milk into the regular diet, thereby highlighting a practical and accessible dietary approach.
Food Research Center, Binggrae Co., Ltd
NOTES
-
Funding: This research was supported by the Food Research Center, Binggrae Co., Ltd, Namyangju 12253, Republic of Korea.
-
Conflict of Interest: The authors declare that they have no competing interests.
-
Author Contributions:
Conceptualization: Kim CH, Lim HS1, Lee JY, Lim HS.2
Data curation: Jung DH, Nam GM.
Formal analysis: Jung DH.
Funding acquisition: Lim HS.2
Investigation: Jung DH, Nam GM.
Methodology: Lee CK, Lim HS.2
Project administration: Lim HS.2
Supervision: Lim HS.2
Validation: Jung DH, Kim CH, Lim HS1, Lee JY.
Visualization: Jung DH.
Writing - original draft: Jung DH, Nam GM, Lim HS.2
Writing - review & editing: Lee CK, Lim HS.2
1Lim HS, Hyun-San Lim; 2Lim HS, Hee-Sook Lim.
REFERENCES
- 1. Misselwitz B, Pohl D, Frühauf H, Fried M, Vavricka SR, et al. Lactose malabsorption and intolerance: pathogenesis, diagnosis and treatment. United European Gastroenterol J 2013;1:151-159.
- 2. National Institute of Diabetes and Digestive and Kidney Diseases. Definition & facts for lactose intolerance - NIDDK. 2018. cited 2024 December 19. Available from https://www.niddk.nih.gov/health-information/digestive-diseases/lactose-intolerance/definition-facts
- 3. Bayless TM, Brown E, Paige DM. Lactase non-persistence and lactose intolerance. Curr Gastroenterol Rep 2017;19:23.
- 4. Review WP. Lactose intolerance by country 2024. 2024. cited 2024 December 19. Available from https://worldpopulationreview.com/country-rankings/lactose-intolerance-by-country
- 5. Beyerlein L, Pohl D, Delco F, Stutz B, Fried M, et al. Correlation between symptoms developed after the oral ingestion of 50 g lactose and results of hydrogen breath testing for lactose intolerance. Aliment Pharmacol Ther 2008;27:659-665.
- 6. Newcomer AD, McGill DB, Thomas PJ, Hofmann AF. Prospective comparison of indirect methods for detecting lactase deficiency. N Engl J Med 1975;293:1232-1236.
- 7. Di Costanzo M, Berni Canani R. Lactose intolerance: common misunderstandings. Ann Nutr Metab 2018;73(Suppl 4):30-37.
- 8. Malik TF, Panuganti KK. Lactose intolerance. 2024. cited 2024 December 19. Available from http://www.ncbi.nlm.nih.gov/books/NBK532285/
- 9. Misselwitz B, Butter M, Verbeke K, Fox MR. Update on lactose malabsorption and intolerance: pathogenesis, diagnosis and clinical management. Gut 2019;68:2080-2091.
- 10. Windey K, Houben E, Deroover L, Verbeke K. Contribution of colonic fermentation and fecal water toxicity to the pathophysiology of lactose-intolerance. Nutrients 2015;7:7505-7522.
- 11. Pratelli G, Tamburini B, Badami GD, Lo Pizzo M, De Blasio A, et al. Cow’s milk: a benefit for human health? Omics tools and precision nutrition for lactose intolerance management. Nutrients 2024;16:320.
- 12. Korea Rural Economic Institute. Consumer behavior survey for foods basic analysis report 2023 (E16-2023). Naju: Korea Rural Economic Institute; 2023.
- 13. Laaksonen MM, Mikkilä V, Räsänen L, Rontu R, Lehtimäki TJ, et al. Genetic lactase non-persistence, consumption of milk products and intakes of milk nutrients in Finns from childhood to young adulthood. Br J Nutr 2009;102:8-17.
- 14. Szilagyi A, Ishayek N. Lactose intolerance, dairy avoidance, and treatment options. Nutrients 2018;10:1994.
- 15. Carroccio A, Montalto G, Cavera G, Notarbatolo A. Lactase Deficiency Study Group. Lactose intolerance and self-reported milk intolerance: relationship with lactose maldigestion and nutrient intake. J Am Coll Nutr 1998;17:631-636.
- 16. Kim JH, Kim SB. Biochemical characteristics and dietary intake according to the frequency of milk consumption in Korean adolescents: data from the 2010∼2011 Korea National Health and Nutrition Examination Survey. Korean J Community Nutr 2020;25:485-501.
- 17. Larson NI, Neumark-Sztainer D, Harnack L, Wall M, Story M, et al. Calcium and dairy intake: longitudinal trends during the transition to young adulthood and correlates of calcium intake. J Nutr Educ Behav 2009;41:254-260.
- 18. Lin MY, Dipalma JA, Martini MC, Gross CJ, Harlander SK, et al. Comparative effects of exogenous lactase (beta-galactosidase) preparations on in vivo lactose digestion. Dig Dis Sci 1993;38:2022-2027.
- 19. Lin MY, Yen CL, Chen SH. Management of lactose maldigestion by consuming milk containing lactobacilli. Dig Dis Sci 1998;43:133-137.
- 20. JanssenDuijghuijsen L, Looijesteijn E, van den Belt M, Gerhard B, Ziegler M, et al. Changes in gut microbiota and lactose intolerance symptoms before and after daily lactose supplementation in individuals with the lactase nonpersistent genotype. Am J Clin Nutr 2024;119:702-710.
- 21. Oh CH, Kim JW, Park YM, Kim GA, Jang JY, et al. Benefits of flavored lactose-free milk for Korean adults with lactose intolerance. J Med Food 2022;25:1003-1010.
- 22. Rezaie A, Buresi M, Lembo A, Lin H, McCallum R, et al. Hydrogen and methane-based breath testing in gastrointestinal disorders: the North American consensus. Am J Gastroenterol 2017;112:775-784.
- 23. Strocchi A, Corazza G, Ellis CJ, Gasbarrini G, Levitt MD. Detection of malabsorption of low doses of carbohydrate: accuracy of various breath H2 criteria. Gastroenterology 1993;105:1404-1410.
- 24. Yang J, Deng Y, Chu H, Cong Y, Zhao J, et al. Prevalence and presentation of lactose intolerance and effects on dairy product intake in healthy subjects and patients with irritable bowel syndrome. Clin Gastroenterol Hepatol 2013;11:262-268.e1.
- 25. Yook SM, Lim YS, Lee JS, Kim KN, Hwang HJ, et al. Revision of nutrition quotient for Korean adults: NQ-2021. J Nutr Health 2022;55:278-295.
- 26. Montalto M, Nucera G, Santoro L, Curigliano V, Vastola M, et al. Effect of exogenous beta-galactosidase in patients with lactose malabsorption and intolerance: a crossover double-blind placebo-controlled study. Eur J Clin Nutr 2005;59:489-493.
- 27. Li XE, Drake M. Sensory perception, nutritional role, and challenges of flavored milk for children and adults. J Food Sci 2015;80:R665-R670.
- 28. Jauhiainen T, Korpela R. Milk peptides and blood pressure. J Nutr 2007;137:825S-829S.
- 29. Thorning TK, Raben A, Tholstrup T, Soedamah-Muthu SS, Givens I, et al. Milk and dairy products: good or bad for human health? An assessment of the totality of scientific evidence. Food Nutr Res 2016;60:32527.
- 30. Ministry of Health and Welfare. The Korean Nutrition Society. Dietary reference intakes for Koreans 2020. Sejong: Ministry of Health and Welfare; 2020.

 , Gi Moon Nam1

