ABSTRACT
This study provides the first national update on phase angle (PhA) as a biomarker of body composition, nutritional status, and health outcomes in Korean adults. Using data from 5,035 adults aged 20–80 years from the 2023 Korea National Health and Nutrition Examination Survey (KNHANES), we analyzed age-related variations in PhA, body composition, metabolic diseases, and nutrient intake. The mean PhA declined from 5.57° in participants aged 20–39 to 4.23° in those aged 80+, corresponding with decreases in height and weight. Individuals with higher PhA exhibited significantly greater lean body mass and lower body fat; for example, among those aged 20–39, the high PhA group showed 56.02 kg of lean mass versus 40.71 kg in the low group (p < 0.001) and total body water of 41.07 L versus 29.84 L (p < 0.001). Regarding metabolic diseases, 35.2% of the high PhA group aged 20–39 had grade 1 obesity compared with 17.4% in the low group, with similar associations observed for diabetes and hypertension across age groups. Nutritional intake was also higher in the high PhA group, with mean energy intake of 2,180.84 versus 1,710.16 kcal (p < 0.001). Overall, PhA was positively associated with favorable body composition, nutritional intake, and metabolic profiles across all age groups, suggesting its potential as a comprehensive biomarker for assessing physiological health and guiding nutritional interventions in the Korean population.
-
Keywords: Electric impedance; Body composition; Nutritional status
INTRODUCTION
The evaluation of body composition is pivotal for performing comprehensive and interdisciplinary analyses, as it sheds light on nutritional status and presence of conditions, such as sarcopenia. In clinical settings, the use of straightforward and reliable markers for assessing body and muscle composition can aid in identifying physical and nutritional phenotypes among populations at risk. Bioelectrical impedance analysis (BIA) is a popular, noninvasive, and uncomplicated method for assessing body composition [
1]. BIA involves evaluating the electrical properties of the body, particularly impedance (Z) and phase angle (PhA), to diagnose conditions such as sarcopenia or malnutrition. Traditional measures of body composition have focused on fat-free mass and skeletal muscle mass, whereas a recent study included assessments of muscle mass, fat mass, and hydration status across different body parts, including arms, legs, and torso [
2].
In BIA, PhA—which indicates the phase difference between voltage and current sine waves—has become a clinically meaningful biomarker for assessing the quantity and quality of soft tissues. It is widely recognized as an indicator of body cell mass (BCM) [
3]. Physiologically, PhA is characterized by the balance between resistance (indicating extracellular and intracellular fluid distributions) and reactance (indicating cell membrane capacitance). A higher PhA reflects greater cell membrane integrity, intact cellular function, and balanced fluid distribution, whereas a lower PhA is associated with membrane breakdown, inflammation, and extracellular fluid dominance [
4]. These properties make PhA a unique, integrative marker of cellular health, nutritional status, and disease prognosis—providing information not captured by conventional measures such as body mass index (BMI) or fat-free mass. Recent evidence highlights its predictive value for mortality, functional decline, and recovery potential in clinical and community settings. Clinically, PhA values are lower in various diseases and inflammatory conditions and are linked to adverse outcomes in several chronic and age-related diseases, including pediatric populations and those with critical illness [
5,
6].
Since 2022, Korea has planned a 3-year nationwide BIA measurement through the National Health and Nutrition Examination Survey (KNHANES IX), with the first national-level PhA raw data being updated. Despite reports on using KNHANES data on specific populations (e.g., those aged ≥ 60 years) [
7], or on selected individuals for physical activity analysis [
8], to the authors’ knowledge, PhA has not yet been updated in a nationally stratified population distribution as of 2023, with only approximately 2 years of data available. Therefore, to encourage research on the use of PhA based on current evidence and raw data, this study aimed to provide the first report on the use of the most recent national-level data from 2023 KNHANES (raw data released in January 2025 by the Korea Disease Control and Prevention Agency [KDCA], involving 5,000 participants). This study aimed to 1) report the mean values and quartiles of PhA by age group in Korean adults and 2) compare body composition (muscle, fat, and cellular water), nutritional intake analysis, prevalence of chronic diseases, and hematological indices between high and low PhA groups, divided by the median PhA of each age group.
MATERIALS AND METHODS
Data collection and study participants
This cross-sectional study utilized data from the 2023 KNHANES conducted annually by the KDCA. KNHANES is a nationwide, representative, population-based, cross-sectional health and nutrition survey conducted under Article 16 of the National Health Promotion Act [
9]. Since 2022, PhA testing has been included in the survey, and this study focused on presenting the figures for 2023 through an update. The participant recruitment process was implemented through local health centers based on regions and involved a multistage probability sampling method to randomly select participants, considering aspects such as region, age, and residential type [
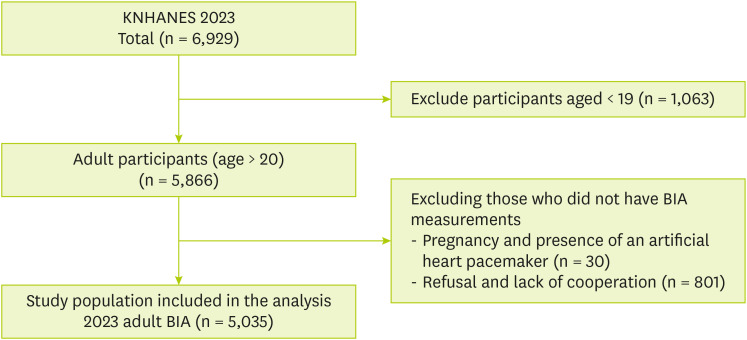
10]. For this study, initially, out of the 6,929 participants in the 2023 survey, 5,866 adults aged ≥ 20 years were extracted. Additionally, the study investigated 5,035 individuals with available BIA data.
Figure 1 presents this selection process of the study participants.
Figure 1
Flow diagram of the study group.
KNHANES, Korea National Health and Nutrition Examination Survey; BIA, bioelectrical impedance analysis.
BIA and pHA
BIA is a noninvasive, low-cost approach for body composition assessment [
11]. BIA measurements were conducted after fasting and obtained using bioelectrical impedance spectroscopy (InBody 970; Biospace, Seoul, Korea). However, considering the lack of restrictions or controls regarding fluid intake before the KNHANES measurements, there may be limitations because of BIA variations caused by fluid intake [
12]. According to previous studies, the measures obtained with the BIA instrument used in this study, InBody 970, were consistent with the results obtained from dual-energy X-ray absorptiometry, which is considered the standard tool for measuring muscle mass and body fat [
13]. Previous studies have reported the overall biomechanical measurement principles of BIA [
11,
14]. Through BIA, the following data on body composition were obtained: weight (kg), lean body mass (kg), right arm muscle (kg), left arm muscle (kg), right leg muscle (kg), left leg muscle (kg), body fat mass (kg), body fat percentage (%), right arm body fat mass (kg), left arm body fat mass (kg), torso body fat mass (kg), right leg body fat mass (kg), left leg body fat mass (kg), body water (L), intracellular water (L), and extracellular water (L). PhA (°, degree) was measured at a single frequency of 50 kHz on the right side of the body while standing. Although previous studies have suggested mean values or PhA cutoff points in relation to specific diseases, no standard values have been established for classifying the health status of the general population across all age groups. Therefore, in this study, participants were classified into high and low groups for each age group based on the median value, and quartiles are shown. All participants underwent BIA measurements after an overnight fast of at least 8 hours. Participants with implanted devices, such as pacemakers or implantable cardioverter-defibrillators, and pregnant women were excluded from the BIA measurements.
Participants’ sex, age, and place of residence were obtained using a computer-assisted personal interview. Height was measured in a standing position using a Seca 274 (Seca, Hamburg, Germany), and body weight was measured using a GL-6000-20 (G-tech, Uijeongbu, Korea). From these measurements, BMI was calculated based on body anthropometry (BMI equation) [
15]. Waist circumference was measured using a manual tape measure (Lufkin, Missouri City, TX, USA). Systolic and diastolic blood pressure (DBP) were measured 3 times using a non-mercury oscillometric blood pressure (BP) monitor (WatchBP Office AFIB; Microlife, Widnau, Switzerland), and the average value was used.
The Quality Management Reports and Data Utilization Collection (Ministry of Welfare and KDCA, 2024) provided all detailed information and experimental protocols for the blood chemical tests in KNHANES. Total cholesterol, triglyceride, high-density lipoprotein cholesterol, and low-density lipoprotein cholesterol were measured using the Enzymatic Colorimetric Assay method with Cobas 8000 (Roche, Mannheim, Germany). HbA1c was measured using the high-performance liquid chromatography method with HLC-723G11 (Tosoh, Tokyo, Japan). Blood urea nitrogen and creatinine were measured using the kinetic assay method with Cobas 8000. Hemoglobin and hematocrit were measured using the electronic impedance method with XN-1000 (Sysmex, Kobe, Japan). White blood cell (WBC) count was quantified using the flow cytometry method with XN-1000. Fasting glucose was measured using the Hexokinase UV Assay method with Cobas 8000.
Metabolic disease
The prevalence of obesity, diabetes mellitus (DM), hypertension (HTN), hypercholesterolemia, hypertriglyceridemia, and anemia was determined using anthropometric and biochemical analysis data.
BMI was diagnosed as follows: underweight, < 18.5 kg/m2; normal, 18.5–23 kg/m2; pre-obesity, 23–25 kg/m2; stage 1 obesity, 25–30 kg/m2; stage 2 obesity, 30–35 kg/m2; stage 3 obesity, > 35 kg/m2.
HTN was diagnosed based on the BP: HTN, systolic blood pressure (SBP) ≥ 140 mmHg, DBP ≥ 90 mmHg, or taking antihypertensive medication; pre-HTN, 130–140 mmHg of SBP and 80–90 mmHg of DBP; elevated BP, 120–130 mmHg of SBP and < 80 mmHg of DBP; normal, SBP < 120 mmHg and DBP < 80 mmHg.
Diabetes was diagnosed based on the following: fasting glucose ≥ 126 mg/dL, a doctor’s diagnosis, use of antihyperglycemic medication or insulin, or HbA1c ≥ 6.5%. Pre-diabetes, fasting glucose of 100–125 mg/dL or HbA1c of 5.7%–6.4%; normal, fasting glucose < 100 mg/dL or HbA1c < 5.7%.
Hypercholesterolemia was diagnosed as total cholesterol ≥ 240 mg/dL or cholesterol-lowering medication use, and hypertriglyceridemia was diagnosed as triglyceride level ≥ 200 mg/dL. Anemia was diagnosed as hemoglobin (g/dL) < 12 for non-pregnant women aged 15+, and < 13 for men.
Dietary intake assessment
The nutritional survey of KNHANES includes data on dietary habits, dietary supplements, nutritional knowledge, food security, and food intake data based on a 24-hours recall method conducted 2 days before the survey. Food intake data were processed using the 10th Revision of the National Standard Food Composition Table (Rural Development Administration, 2022). Consequently, intake information on 29 nutrients, including energy, was provided, and the proportions of carbohydrates, proteins, and fats in total energy intake were expressed as ratios. Detailed information on KNHANES nutrient intake analysis was provided previously [
16].
Continuous variables were presented as mean ± standard deviation or standard error, whereas categorical variables were presented as numbers and percentages. Comparisons of mean values among age groups were performed using the analysis of variance, whereas comparisons between 2 groups were conducted using the independent t test. The χ2 test was applied to evaluate the frequencies of categorical variables. Statistical significance was defined as a 2-tailed p value of < 0.05. All analyses were performed using IBM SPSS Statistics for Windows version 29.0 (IBM Corp., Armonk, NY, USA).
Ethical review
Written informed consent was obtained before participation in the KNHANES, and this study was approved by the Institutional Review Board of the Korea Centers for Disease Control and Prevention (KCDA, 2022-11-16-R-A) and was conducted in accordance with the Declaration of Helsinki. All data analyses were conducted in accordance with the guidelines and regulations of the KCDA.
RESULTS
Basic characteristics and PhA level based on age group
Table 1 presents the basic characteristics and PhA levels across different age groups. The total sample comprises 5,035 adults, with a distribution of 43.2% males and 56.8% females. The group aged 20–39 included 1,074 individuals, 40–59 had 1,807, 60–79 consisted of 1,919, and 80+ included 235 participants. Height decreases with age, from an average of 167.95 cm in the group aged 20–39 to 156.87 cm in those aged 80+. Weight follows a similar trend, starting at 67.74 kg in the youngest group and declining to 58.15 kg in the oldest group. The BMI remains relatively stable across age groups, with minor variations and an overall average of 24.03 kg/m
2. Regarding the distribution of residential status, a higher urban residence was noted in younger age groups, with 89.2% of the group aged 20–39 living in cities compared with 62.1% of the 80+ group. The PhA decreases with age. The mean PhA is the highest in the group aged 20–39 at 5.57° and lowest in the 80+ group at 4.23° (p < 0.001). The median PhA mirrors this trend, ranging from 5.50° in the youngest group to 4.10° in the oldest.
Table 1Basic characteristics and phase angle level based on the age group
Table 1
|
Variables |
Total adults |
20–39 (n = 1,074) |
40–59 (n = 1,807) |
60–79 (n = 1,919) |
80+ (n = 235) |
p |
|
Sex |
|
|
|
|
|
0.059 |
|
Male |
2,174 (43.2) |
494 (46.0) |
740 (41.0) |
835 (43.5) |
105 (44.7) |
|
Female |
2,861 (56.8) |
580 (54.0) |
1,067 (59.0) |
1,084 (56.5) |
130 (55.3) |
|
Height (cm) |
163.26 ± 9.15 |
167.95 ± 8.62 |
164.51 ± 8.45 |
160.16 ± 8.52 |
156.87 ± 9.19 |
< 0.001 |
|
Weight (kg) |
64.34 ± 12.91 |
67.74 ± 15.61 |
65.72 ± 13.20 |
61.89 ± 10.34 |
58.15 ± 9.58 |
< 0.001 |
|
BMI (kg/m2) |
24.03 ± 3.70 |
23.85 ± 4.41 |
24.15 ± 3.75 |
24.06 ± 3.25 |
23.52 ± 2.91 |
0.033 |
|
Waist circumference (cm) |
83.94 ± 10.73 |
80.68 ± 12.21 |
83.59 ± 10.87 |
85.72 ± 9.36 |
86.84 ± 8.85 |
< 0.001 |
|
Residential |
|
|
|
|
|
< 0.001 |
|
City |
4,030 (80.0) |
958 (89.2) |
1,514 (83.8) |
1,412 (73.6) |
146 (62.1) |
|
Rural |
1,005 (20.0) |
116 (10.8) |
293 (16.2) |
507 (26.4) |
89 (37.9) |
|
Phase angle (°) |
|
|
|
|
|
< 0.001 |
|
Mean |
5.23 ± 0.74 |
5.57 ± 0.80 |
5.42 ± 0.74 |
4.98 ± 0.66 |
4.23 ± 0.58 |
|
Min |
2.60 |
2.90 |
2.60 |
2.60 |
3.00 |
|
25th percentile |
4.70 |
4.90 |
4.90 |
4.50 |
3.80 |
|
Median |
5.20 |
5.50 |
5.40 |
4.90 |
4.10 |
|
75th percentile |
5.80 |
6.20 |
5.90 |
5.40 |
4.60 |
|
Max |
8.00 |
7.90 |
8.00 |
7.50 |
6.40 |
Comparison of body composition and BIA results according to the PhA
Table 2 compares the body composition and BIA results based on PhA levels across different age groups and illustrates significant differences in muscle mass and lean body mass between the low and high PhA groups across all age groups. In the group aged 20–39, the high PhA group showed a lean body mass of 56.02 kg compared with 40.71 kg in the low group, with right and left arm muscles at 3.13 and 3.12 kg, respectively. Similar patterns are seen in the groups aged 40–59, 60–79, and 80+, where high PhA individuals consistently have greater muscle mass in both arms and legs, and lean body mass, with all differences being significant (p < 0.001). Across all age groups, body fat percentage was lower in high PhA group, such as 25.51% versus 30.97% in the group aged 20–39 (p < 0.001). Body water content was also higher, with a total body water averaging 41.07 L in the group aged 20–39 in the high PhA group versus 29.84 L in the low group (p < 0.001).
Table 2Comparison of body composition and bioelectrical impedance analysis results according to the phase angle level in each age group
Table 2
|
Variables |
20–39 (n = 1,074) |
p |
40–59 (n = 1,807) |
p |
60–79 (n = 1,919) |
p |
80+ (n = 235) |
p |
|
Low (n = 540) |
High (n = 534) |
Low (n = 975) |
High (n = 832) |
Low (n = 983) |
High (n = 936) |
Low (n = 120) |
High (n = 115) |
|
Weight (kg) |
59.69 ± 12.26 |
75.87 ± 14.39 |
< 0.001 |
59.58 ± 10.70 |
72.92 ± 12.17 |
< 0.001 |
58.32 ± 9.35 |
65.62 ± 10.01 |
< 0.001 |
55.80 ± 9.41 |
60.59 ± 9.18 |
< 0.001 |
|
Lean body mass (kg) |
40.71 ± 6.47 |
56.02 ± 9.41 |
< 0.001 |
40.45 ± 6.32 |
53.18 ± 8.93 |
< 0.001 |
39.02 ± 6.13 |
46.98 ± 7.84 |
< 0.001 |
36.96 ± 0.57 |
42.08 ± 7.09 |
< 0.001 |
|
Right arm muscle (kg) |
1.95 ± 0.47 |
3.13 ± 0.66 |
< 0.001 |
2.02 ± 0.48 |
3.05 ± 0.64 |
< 0.001 |
1.99 ± 0.46 |
2.64 ± 0.58 |
< 0.001 |
1.82 ± 0.46 |
2.26 ± 0.50 |
< 0.001 |
|
Left arm muscle (kg) |
1.94 ± 0.47 |
3.12 ± 0.66 |
< 0.001 |
2.00 ± 0.48 |
3.01 ± 0.64 |
< 0.001 |
1.97 ± 0.46 |
2.61 ± 0.58 |
< 0.001 |
1.81 ± 0.46 |
2.25 ± 0.49 |
< 0.001 |
|
Right leg muscle (kg) |
6.40 ± 1.12 |
8.76 ± 1.53 |
< 0.001 |
6.20 ± 1.11 |
8.22 ± 1.50 |
< 0.001 |
5.72 ± 1.19 |
7.11 ± 1.39 |
< 0.001 |
5.24 ± 1.31 |
6.21 ± 1.48 |
< 0.001 |
|
Left leg muscle (kg) |
6.38 ± 1.12 |
8.70 ± 1.52 |
< 0.001 |
6.19 ± 1.10 |
8.22 ± 1.50 |
< 0.001 |
5.70 ± 1.18 |
7.07 ± 1.38 |
< 0.001 |
5.25 ± 1.34 |
6.16 ± 1.46 |
< 0.001 |
|
Body fat mass (kg) |
18.97 ± 7.63 |
19.83 ± 8.62 |
0.086 |
19.11 ± 6.60 |
19.71 ± 6.70 |
< 0.001 |
19.25 ± 6.21 |
18.61 ± 5.76 |
0.021 |
18.79 ± 5.95 |
18.45 ± 5.07 |
0.645 |
|
Body fat percentage (%) |
30.97 ± 7.04 |
25.51 ± 7.78 |
< 0.001 |
31.52 ± 6.56 |
26.80 ± 6.80 |
< 0.001 |
32.57 ± 7.30 |
28.22 ± 6.93 |
< 0.001 |
33.28 ± 7.17 |
30.37 ± 6.68 |
0.001 |
|
Right arm body fat mass (kg) |
1.37 ± 0.75 |
1.28 ± 0.89 |
0.064 |
1.35 ± 0.69 |
1.23 ± 0.69 |
< 0.001 |
1.38 ± 0.59 |
1.18 ± 0.54 |
< 0.001 |
1.39 ± 0.56 |
1.23 ± 0.44 |
0.020 |
|
Left arm body fat mass (kg) |
1.39 ± 0.75 |
1.30 ± 0.89 |
0.076 |
1.37 ± 0.64 |
1.26 ± 0.69 |
0.001 |
1.40 ± 0.59 |
1.21 ± 0.55 |
< 0.001 |
1.39 ± 0.58 |
1.25 ± 0.45 |
0.044 |
|
Torso body fat mass (kg) |
9.32 ± 4.10 |
10.35 ± 4.62 |
< 0.001 |
9.57 ± 3.57 |
10.40 ± 3.67 |
< 0.001 |
9.81 ± 3.45 |
9.73 ± 3.24 |
0.565 |
9.53 ± 3.35 |
9.55 ± 2.93 |
0.972 |
|
Right leg body fat mass (kg) |
2.92 ± 0.98 |
2.85 ± 1.08 |
0.291 |
2.87 ± 0.85 |
2.82 ± 0.82 |
0.168 |
2.79 ± 0.77 |
2.67 ± 0.72 |
0.002 |
2.71 ± 0.72 |
2.66 ± 0.63 |
0.557 |
|
Left leg body fat mass (kg) |
2.91 ± 0.98 |
2.84 ± 1.08 |
0.231 |
2.86 ± 0.84 |
2.80 ± 0.82 |
0.110 |
2.78 ± 0.71 |
2.66 ± 0.71 |
< 0.001 |
2.70 ± 0.72 |
2.64 ± 0.62 |
0.556 |
|
Body water (L) |
29.84 ± 4.75 |
41.07 ± 6.89 |
< 0.001 |
29.73 ± 4.67 |
39.09 ± 6.56 |
< 0.001 |
28.76 ± 4.55 |
34.60 ± 5.79 |
< 0.001 |
27.29 ± 4.65 |
31.06 ± 5.27 |
0.531 |
|
Intracellular water (L) |
18.42 ± 2.95 |
25.76 ± 4.34 |
< 0.001 |
18.27 ± 2.86 |
24.37 ± 4.12 |
< 0.001 |
17.49 ± 2.76 |
21.37 ± 3.59 |
< 0.001 |
16.34 ± 2.78 |
18.88 ± 3.20 |
< 0.001 |
|
Extracellular water (L) |
11.42 ± 1.80 |
15.31 ± 2.56 |
< 0.001 |
11.45 ± 1.81 |
14.72 ± 2.45 |
< 0.001 |
11.26 ± 1.80 |
11.26 ± 13.23 |
< 0.001 |
10.94 ± 1.88 |
12.18 ± 2.08 |
< 0.001 |
Comparison of metabolic disease and biochemistry status according to the PhA level
Table 3 presents a comparative analysis of the prevalence of metabolic disease and biochemistry status based on PhA levels across the 4 age groups. For obesity, significant differences (p < 0.001) were noted in all age groups. In the group aged 20–39, 35.2% of those in the high PhA group have grade 1 obesity compared with 17.4% in the low group. The prevalence of DM increases with age, with 2.7% in the high PhA group aged 20–39 having DM, compared with 1.2% in the low group. This trend was pronounced in the group aged 40–59, where 13.8% of the high PhA group had DM versus 8.1% in the low group. HTN was also more prevalent in higher age groups, with 30.1% of the high PhA group aged 40–59 having HTN compared with 20.4% in the low group. Significant differences in hypertriglyceridemia were observed, particularly in the group aged 20–39 (12.3% in high vs. 3.6% in low, p < 0.001). Anemia was less common in the high PhA group across all ages, with notable differences in the group aged 60–79 (8.1% in high vs. 17.9% in low, p < 0.001). The hematological data also indicate significant differences based on PhA levels. The patterns are consistent across the 4 age groups, with higher hemoglobin, hematocrit, and WBC levels in the high PhA group, indicating better overall hematologic health.
Table 3Comparison of metabolic disease and biochemistry status according to the phase angle level in each age group
Table 3
|
Variables |
20–39 (n = 1,074) |
p |
40–59 (n = 1,807) |
p |
60–79 (n = 1,919) |
p |
80+ (n = 235) |
p |
|
Low (n = 540) |
High (n = 534) |
Low (n = 975) |
High (n = 832) |
Low (n = 983) |
High (n = 936) |
Low (n = 120) |
High (n = 115) |
|
Presence of obesity |
|
|
< 0.001 |
|
|
< 0.001 |
|
|
< 0.001 |
|
|
0.012 |
|
Underweight |
80 (14.8) |
8 (1.5) |
56 (5.7) |
7 (0.4) |
57 (5.9) |
12 (1.3) |
7 (6.4) |
1 (0.9) |
|
Normal |
274 (50.7) |
160 (30.0) |
503 (51.6) |
178 (21.4) |
395 (40.1) |
276 (29.6) |
48 (43.6) |
36 (32.7) |
|
Overweight |
63 (11.7) |
109 (20.4) |
175 (18.0) |
224 (27.0) |
213 (22.0) |
261 (28.0) |
31 (28.2) |
30 (27.3) |
|
Grade 1 obesity |
94 (17.4) |
188 (35.2) |
199 (20.4) |
333 (40.1) |
264 (43.8) |
339 (36.4) |
21 (28.2) |
41 (37.3) |
|
Grade 2 obesity |
24 (4.4) |
50 (9.4) |
29 (3.0) |
79 (9.5) |
36 (3.7) |
42 (4.5) |
3 (2.7) |
2 (1.8) |
|
Grade 3 obesity |
5 (0.9) |
19 (3.6) |
12 (1.2) |
9 (1.1) |
2 (0.2) |
1 (0.1) |
|
|
|
Presence of DM |
|
|
< 0.001 |
|
|
< 0.001 |
|
|
0.105 |
|
|
0.370 |
|
Normal |
476 (91.5) |
405 (79.1) |
600 (64.6) |
374 (47.2) |
339 (36.7) |
291 (32.7) |
33 (32.0) |
34 (31.8) |
|
Pre-diabetes |
38 (7.3) |
93 (18.2) |
254 (27.3) |
309 (39.0) |
353 (38.2) |
381 (42.8) |
33 (32.0) |
43 (40.2) |
|
DM |
6 (1.2) |
14 (2.7) |
75 (8.1) |
109 (13.8) |
231 (25.0) |
218 (24.5) |
37 (35.9) |
30 (28.0) |
|
Presence of HTN |
|
|
< 0.001 |
|
|
< 0.001 |
|
|
0.864 |
|
|
0.592 |
|
Normal |
470 (87.2) |
339 (63.7) |
583 (60.0) |
350 (42.3) |
231 (23.5) |
217 (23.3) |
11 (9.2) |
14 (12.2) |
|
Cautionary BP |
18 (3.3) |
77 (14.5) |
50 (5.1) |
52 (6.3) |
99 (10.1) |
86 (9.2) |
8 (6.7) |
12 (10.4) |
|
Pre-HTN |
43 (8.0) |
88 (16.5) |
140 (14.4) |
177 (9.8) |
124 (12.6) |
127 (13.6) |
8 (6.7) |
6 (2.6) |
|
HTN |
8 (1.5) |
28 (5.3) |
198 (20.4) |
249 (30.1) |
528 (53.8) |
502 (53.9) |
93 (77.5) |
83 (72.2) |
|
Hypercholesterolemia |
27 (5.2) |
49 (9.5) |
0.007 |
256 (27.5) |
242 (30.5) |
0.093 |
440 (47.5) |
393 (44.1) |
0.145 |
40 (51.3) |
38 (48.7) |
0.619 |
|
Hypertriglyceridemia |
17 (3.6) |
55 (12.3) |
< 0.001 |
58 (6.9) |
142 (20.2) |
< 0.001 |
62 (7.0) |
106 (12.9) |
< 0.001 |
7 (6.9) |
11 (10.6) |
0.356 |
|
Anemia |
71 (6.7) |
15 (2.9) |
< 0.001 |
157 (16.5) |
34 (4.2) |
< 0.001 |
171 (17.9) |
74 (8.1) |
< 0.001 |
35 (31.0) |
25 (22.7) |
0.165 |
|
BMI (kg/m2) |
22.27 ± 4.02 |
25.44 ± 4.22 |
< 0.001 |
23.00 ± 3.64 |
25.50 ± 3.42 |
< 0.001 |
23.53 ± 3.40 |
24.60 ± 2.98 |
< 0.001 |
22.86 ± 2.99 |
24.17 ± 2.67 |
0.001 |
|
Systolic BP (mmHg) |
107.08 ± 10.20 |
115.97 ± 10.55 |
< 0.001 |
114.25 ± 14.97 |
118.56 ± 12.85 |
< 0.001 |
125.26 ± 16.41 |
125.46 ± 15.81 |
0.794 |
134.05 ± 18.91 |
127.58 ± 16.31 |
0.005 |
|
Diastolic BP (mmHg) |
68.68 ± 7.86 |
72.23 ± 8.75 |
< 0.001 |
73.76 ± 9.83 |
77.64 ± 9.14 |
< 0.001 |
73.37 ± 8.98 |
75.63 ± 8.92 |
< 0.001 |
72.35 ± 9.39 |
69.97 ± 7.94 |
0.038 |
|
Fasting glucose (mg/dL) |
90.01 ± 17.20 |
93.13 ± 18.01 |
0.004 |
98.12 ± 23.91 |
102.89 ± 22.46 |
< 0.001 |
105.18 ± 26.62 |
106.89 ± 22.87 |
0.137 |
108.60 ± 27.80 |
107.28 ± 26.46 |
0.717 |
|
HbA1c (%) |
5.18 ± 0.47 |
5.26 ± 0.54 |
0.017 |
5.53 ± 0.83 |
5.64 ± 0.77 |
0.003 |
5.92 ± 0.95 |
5.86 ± 0.72 |
0.113 |
5.93 ± 0.78 |
5.84 ± 0.72 |
0.378 |
|
Total cholesterol (mg/dL) |
182.93 ± 31.07 |
188.40 ± 36.09 |
0.008 |
195.89 ± 38.20 |
191.66 ± 40.11 |
0.023 |
176.92 ± 41.44 |
177.97 ± 40.83 |
0.580 |
164.12 ± 42.29 |
169.80 ± 35.11 |
0.277 |
|
HDL cholesterol (mg/dL) |
63.41 ± 14.25 |
53.77 ± 14.25 |
< 0.001 |
63.02 ± 15.75 |
52.85 ± 14.45 |
< 0.001 |
58.18 ± 14.99 |
53.46 ± 14.64 |
< 0.001 |
54.54 ± 16.17 |
51.48 ± 13.64 |
0.129 |
|
Triglyceride (mg/dL) |
92.22 ± 80.10 |
133.99 ± 111.51 |
< 0.001 |
110.69 ± 78.48 |
156.99 ± 111.56 |
< 0.001 |
114.64 ± 55.41 |
136.22 ± 96.64 |
< 0.001 |
117.61 ± 51.21 |
123.36 ± 64.65 |
0.462 |
|
LDL cholesterol (mg/dL) |
110.11 ± 29.91 |
119.40 ± 32.96 |
< 0.001 |
119.96 ± 35.24 |
118.66 ± 35.24 |
0.441 |
103.77 ± 37.79 |
106.22 ± 37.28 |
0.157 |
94.67 ± 37.27 |
101.74 ± 33.22 |
0.137 |
|
Hemoglobin (g/dL) |
13.02 ± 1.15 |
14.90 ± 1.25 |
< 0.001 |
12.96 ± 1.23 |
14.53 ± 1.27 |
< 0.001 |
13.09 ± 1.18 |
14.10 ± 1.28 |
< 0.001 |
12.73 ± 1.33 |
13.38 ± 1.24 |
<0.001 |
|
Hematocrit (%) |
39.74 ± 2.99 |
44.61 ± 3.37 |
< 0.001 |
39.55 ± 3.28 |
43.59 ± 3.52 |
< 0.001 |
39.88 ± 3.38 |
42.46 ± 3.63 |
< 0.001 |
38.88 ± 3.91 |
40.54 ± 3.47 |
0.001 |
|
BUN (mg/dL) |
11.05 ± 2.69 |
13.09 ± 3.27 |
< 0.001 |
12.94 ± 3.60 |
13.96 ± 4.36 |
< 0.001 |
16.13 ± 4.79 |
16.38 ± 4.60 |
0.247 |
17.13 ± 4.72 |
17.35 ± 4.37 |
0.717 |
|
Creatinine (mg/dL) |
0.68 ± 0.11 |
0.91 ± 0.43 |
< 0.001 |
0.68 ± 0.12 |
0.87 ± 0.35 |
< 0.001 |
0.74 ± 0.21 |
0.87 ± 0.23 |
< 0.001 |
0.85 ± 0.27 |
0.95 ± 0.27 |
0.007 |
|
WBC (thousands/µL) |
5.99 ± 1.58 |
6.59 ± 1.68 |
< 0.001 |
5.58 ± 1.56 |
6.48 ± 1.79 |
< 0.001 |
5.87 ± 1.60 |
6.28 ± 1.77 |
< 0.001 |
6.26 ± 1.73 |
6.26 ± 1.60 |
0.975 |
Comparison of nutritional intake according to the PhA level in each age group
Table 4 reveals distinct differences in nutritional intake based on PhA levels across age groups. Among those aged 20–39, the high PhA group consumed 2,180.84 kcal on average compared with 1,710.16 kcal in the low PhA group (p < 0.001). Protein intake was higher at 88.37 g for the high PhA group versus 65.04 g in the low group (p < 0.001). Similarly, fat intake was 69.58 g compared with 54.73 g (p < 0.001), with saturated, monounsaturated, and polyunsaturated fats also higher in the high PhA group (all p < 0.001). Carbohydrate intake was significantly higher in the high PhA group than in the low PhA group, with 271.05 g compared with 221.74 g (p < 0.001). Similar trends were observed in the groups aged 40–59 and 60–79 years, where those with high PhA consistently have higher energy, protein, and fat intakes. In the group aged 40–59, energy intake was 2,068.05 kcal in the high group versus 1,628.40 kcal in the low group (p < 0.001). Intake of vitamins and minerals, such as calcium, phosphorus, and vitamin B
1 and vitamin B
2, was also significantly higher in the high PhA group across all age groups, indicating a more nutrient-rich diet.
Table 4Comparison of nutritional intake according to the phase angle level in each age group
Table 4
|
Variables |
20–39 (n = 1,074) |
p |
40–59 (n = 1,807) |
p |
60–79 (n = 1,919) |
p |
80+ (n = 235) |
p |
|
Low (n = 540) |
High (n = 534) |
Low (n = 975) |
High (n = 832) |
Low (n = 983) |
High (n = 936) |
Low (n = 120) |
High (n = 115) |
|
Carbohydrate % |
53.10 ± 0.57 |
51.72 ± 0.55 |
0.084 |
58.43 ± 0.39 |
55.82 ± 0.46 |
< 0.001 |
60.13 ± 0.25 |
57.96 ± 0.27 |
< 0.001 |
67.74 ± 1.01 |
68.69 ± 1.10 |
0.528 |
|
Protein % |
15.52 ± 0.20 |
16.22 ± 0.21 |
0.017 |
15.11 ± 0.12 |
15.41 ± 0.13 |
0.110 |
15.01 ± 0.08 |
15.35 ± 0.08 |
0.004 |
14.04 ± 0.32 |
13.89 ± 0.35 |
0.751 |
|
Fat % |
28.11 ± 0.44 |
27.92 ± 0.40 |
0.397 |
24.30 ± 0.30 |
23.88 ± 0.31 |
0.342 |
22.94 ± 0.19 |
23.00 ± 0.19 |
0.839 |
16.66 ± 0.75 |
16.15 ± 0.79 |
0.644 |
|
Energy (kcal) |
1,710.16 ± 32.02 |
2,180.84 ± 43.03 |
< 0.001 |
1,628.40 ± 21.36 |
2,068.05 ± 30.07 |
< 0.001 |
1,517.58 ± 19.12 |
1,878.35 ± 24.61 |
< 0.001 |
1,377.16 ± 53.72 |
1,567.01 ± 54.87 |
0.014 |
|
Protein (g) |
65.04 ± 1.39 |
88.37 ± 2.10 |
< 0.001 |
61.23 ± 0.93 |
68.05 ± 0.97 |
< 0.001 |
56.62 ± 0.91 |
70.20 ± 1.07 |
< 0.001 |
49.70 ± 2.48 |
55.52 ± 2.62 |
0.109 |
|
Fat (g) |
54.73 ± 1.54 |
69.58 ± 2.04 |
< 0.001 |
45.14 ± 0.89 |
57.03 ± 1.30 |
< 0.001 |
34.52 ± 0.78 |
43.53 ± 0.92 |
< 0.001 |
27.49 ± 1.92 |
29.99 ± 2.41 |
0.417 |
|
SFA (g) |
19.03 ± 0.62 |
22.29 ± 0.67 |
< 0.001 |
14.02 ± 0.30 |
17.97 ± 0.47 |
< 0.001 |
10.17 ± 0.25 |
12.92 ± 0.30 |
< 0.001 |
8.04 ± 0.60 |
8.65 ± 0.62 |
0.487 |
|
MUFA (g) |
18.03 ± 0.57 |
23.32 ± 0.75 |
< 0.001 |
14.59 ± 0.33 |
18.95 ± 0.48 |
< 0.001 |
10.65 ± 0.27 |
13.76 ± 0.33 |
< 0.001 |
8.60 ± 0.68 |
9.00 ± 0.80 |
0.708 |
|
PUFA (g) |
12.21 ± 0.32 |
16.67 ± 0.51 |
< 0.001 |
11.82 ± 0.26 |
14.31 ± 0.34 |
< 0.001 |
9.89 ± 0.23 |
12.08 ± 0.27 |
< 0.001 |
7.65 ± 0.60 |
8.72 ± 0.89 |
0.321 |
|
n-3 FA (g) |
1.57 ± 0.05 |
2.00 ± 0.06 |
< 0.001 |
1.77 ± 0.05 |
2.05 ± 0.06 |
0.001 |
1.85 ± 0.06 |
2.16 ± 0.07 |
0.002 |
1.54 ± 0.16 |
1.51 ± 0.14 |
0.878 |
|
n-6 FA (g) |
10.58 ± 0.28 |
14.61 ± 0.45 |
< 0.001 |
10.01 ± 0.23 |
12.22 ± 0.30 |
< 0.001 |
8.01 ± 0.19 |
9.88 ± 0.22 |
< 0.001 |
6.10 ± 0.47 |
7.20 ± 0.77 |
0.226 |
|
Cholesterol (mg) |
264.45 ± 8.11 |
337.52 ± 10.27 |
< 0.001 |
246.61 ± 5.71 |
306.82 ± 8.43 |
< 0.001 |
198.48 ± 5.64 |
234.56 ± 6.12 |
< 0.001 |
138.56 ± 11.38 |
164.85 ± 18.68 |
0.228 |
|
Carbohydrate (g) |
221.74 ± 4.34 |
271.05 ± 5.08 |
< 0.001 |
233.01 ± 3.19 |
277.33 ± 3.93 |
< 0.001 |
240.94 ± 2.95 |
285.46 ± 3.78 |
< 0.001 |
226.28 ± 8.33 |
262.93 ± 8.83 |
0.003 |
|
Fiber (g) |
17.26 ± 0.40 |
21.53 ± 0.49 |
< 0.001 |
23.63 ± 0.40 |
26.36 ± 0.44 |
< 0.001 |
26.50 ± 0.43 |
30.63 ± 0.50 |
< 0.001 |
22.70 ± 1.13 |
26.35 ± 1.35 |
0.040 |
|
Sugar (g) |
56.23 ± 1.68 |
61.93 ± 1.87 |
0.026 |
55.84 ± 1.27 |
59.00 ± 1.47 |
0.103 |
52.23 ± 1.21 |
58.70 ± 1.41 |
0.001 |
37.43 ± 2.71 |
47.61 ± 3.28 |
0.018 |
|
Calcium (mg) |
439.17 ± 11.38 |
504.17 ± 12.75 |
< 0.001 |
493.71 ± 9.01 |
549.48 ± 10.47 |
< 0.001 |
487.52 ± 10.09 |
553.64 ± 11.21 |
< 0.001 |
405.55 ± 27.94 |
425.58 ± 24.79 |
0.593 |
|
Phosphorus (mg) |
923.60 ± 17.56 |
1,174.29 ± 24.09 |
< 0.001 |
954.50 ± 13.18 |
1,156.43 ± 16.94 |
< 0.001 |
945.66 ± 14.20 |
1,130.44 ± 16.32 |
< 0.001 |
814.23 ± 38.87 |
927.86 ± 42.56 |
0.050 |
|
Sodium (mg) |
2,747.82 ± 64.73 |
3,631.14 ± 83.09 |
< 0.001 |
2,828.71 ± 49.04 |
3,814.53 ± 68.90 |
< 0.001 |
2,764.95 ± 54.24 |
3,430.20 ± 67.18 |
< 0.001 |
2,533.44 ± 137.59 |
2,765.53 ± 142.43 |
0.242 |
|
Potassium (mg) |
2,146.95 ± 42.05 |
2,662.80 ± 54.21 |
< 0.001 |
2,600.23 ± 39.44 |
2,975.08 ± 45.52 |
< 0.001 |
2,655.80 ± 41.95 |
3,121.73 ± 50.30 |
< 0.001 |
2,212.08 ± 113.44 |
2,539.27 ± 122.35 |
0.051 |
|
Magnesium (mg) |
231.31 ± 4.54 |
290.73 ± 5.95 |
< 0.001 |
282.47 ± 4.29 |
326.03 ± 4.71 |
< 0.001 |
302.34 ± 4.62 |
352.52 ± 5.33 |
< 0.001 |
267.62 ± 13.30 |
297.13 ± 14.12 |
0.129 |
|
Iron (mg) |
8.10 ± 0.23 |
10.44 ± 0.33 |
< 0.001 |
8.47 ± 0.16 |
10.33 ± 0.23 |
< 0.001 |
8.82 ± 0.21 |
10.39 ± 0.23 |
< 0.001 |
6.77 ± 3.95 |
7.45 ± 4.32 |
0.212 |
|
Zinc (mg) |
8.70 ± 0.22 |
11.58 ± 0.29 |
< 0.001 |
8.77 ± 0.13 |
11.19 ± 0.19 |
< 0.001 |
9.00 ± 0.13 |
10.86 ± 0.15 |
< 0.001 |
8.54 ± 4.40 |
9.30 ± 4.25 |
0.179 |
|
Vit A (uRAE) |
336.33 ± 15.76 |
397.46 ± 13.45 |
0.003 |
409.81 ± 11.60 |
426.84 ± 12.93 |
0.326 |
364.85 ± 10.48 |
423.29 ± 11.24 |
< 0.001 |
245.45 ± 16.00 |
261.42 ± 20.23 |
0.535 |
|
Vit D (µg) |
2.45 ± 0.22 |
2.80 ± 0.20 |
0.263 |
2.68 ± 0.13 |
3.69 ± 0.27 |
0.001 |
2.79 ± 0.15 |
3.39 ± 0.18 |
0.014 |
2.03 ± 0.26 |
2.21 ± 0.29 |
0.639 |
|
Vit E (mg a-TE) |
6.20 ± 0.15 |
8.15 ± 0.19 |
< 0.001 |
6.65 ± 0.12 |
7.81 ± 0.13 |
< 0.001 |
6.04 ± 0.11 |
7.17 ± 0.12 |
< 0.001 |
4.51 ± 0.22 |
5.20 ± 0.29 |
0.065 |
|
Beta carotene (µg) |
1,751.64 ± 75.25 |
2,233 ± 85.96 |
< 0.001 |
2,968.41 ± 104.30 |
3,111.63 ± 96.72 |
0.320 |
2,969.14 ± 96.16 |
3,488.70 ± 104.53 |
< 0.001 |
2,061.03 ± 156.64 |
2,263.39 ± 191.79 |
0.414 |
|
Retinol (µg) |
188.22 ± 14.46 |
208.25 ± 11.21 |
0.275 |
159.32 ± 7.84 |
164.61 ± 9.66 |
0.668 |
114.87 ± 5.75 |
129.30 ± 6.50 |
0.096 |
73.24 ± 8.19 |
70.96 ± 9.56 |
0.856 |
|
Vit B1 (mg) |
1.00 ± 0.02 |
1.39 ± 0.04 |
< 0.001 |
0.96 ± 0.01 |
1.28 ± 0.02 |
< 0.001 |
0.92 ± 0.01 |
1.14 ± 0.01 |
< 0.001 |
0.79 ± 0.04 |
0.91 ± 0.04 |
0.057 |
|
Vit B2 (mg) |
1.48 ± 0.03 |
1.89 ± 0.04 |
< 0.001 |
1.50 ± 0.02 |
1.80 ± 0.03 |
< 0.001 |
1.30 ± 0.02 |
1.60 ± 0.02 |
< 0.001 |
1.01 ± 0.05 |
1.12 ± 0.05 |
0.172 |
|
Niacin (mg) |
11.16 ± 0.29 |
16.15 ± 0.46 |
< 0.001 |
10.71 ± 0.19 |
13.59 ± 0.25 |
< 0.001 |
9.54 ± 0.17 |
12.13 ± 0.21 |
< 0.001 |
7.85 ± 0.40 |
9.26 ± 0.42 |
0.017 |
|
Folate (µg DFE) |
224.58 ± 4.93 |
285.89 ± 6.97 |
< 0.001 |
305.44 ± 5.16 |
340.89 ± 5.75 |
< 0.001 |
328.44 ± 5.47 |
381.21 ± 6.32 |
< 0.001 |
281.86 ± 15.14 |
311.70 ± 16.07 |
0.178 |
|
Vit C (mg) |
56.60 ± 3.83 |
67.23 ± 4.18 |
0.061 |
69.52 ± 2.75 |
70.06 ± 3.58 |
0.904 |
67.26 ± 2.37 |
70.80 ± 2.08 |
0.264 |
47.47 ± 3.96 |
62.25 ± 5.47 |
0.029 |
DISCUSSION
This study examined the variations in body composition, biochemical status, and nutritional intake associated with different PhA levels across various age groups. The most novel finding of this study is the update on the latest nationwide BIA and PhA data in a single year, with 5,000 Korean adults. Furthermore, the nutritional, hematological, and BIA differences, along with the presence or absence of basic metabolic diseases, between high and low groups, were elucidated based on median values across 4 age groups. The results indicate that PhA declines with age, highlighting its importance as a critical indicator of body composition and overall health status. Specifically, PhA is associated with muscle mass, body water content, and prevalence of metabolic diseases, which are vital factors to consider in the health management strategies.
Previous studies, even when aggregating data from hundreds to thousands of participants in meta-analyses, have presented different measurement methods rather than a single-consistent measurement device. This has posed limitations on the validity of bioelectrical measurements, which are sensitive to the measurement method [
17]. In this study, PhA was measured using a single device with a single measurement method. Whole-body PhA using a frequency of −50 kHz was measured on the right side of the body (including the right arm, torso, and right leg) using a multi-frequency and single device method with the InBody BIA measurement. Therefore, this methodological homogeneity is believed to enhance the reliability of the PhA information for nationwide results.
Comparative analyses of body composition based on PhA levels show that individuals with higher PhA consistently exhibit increased muscle mass and reduced body fat percentages across all age groups. This finding underscores the importance of PhA as a significant physiological marker beyond mere bioelectrical impedance measurements. To date, evidence of an independent association between muscle strength, muscle mass, and PhA is increasing [
18]. In a meta-analysis by da Costa Pereira et al. [
18], who analyzed 17 studies including 2,710 participants, PhA was suggested to represent the quality of muscle as expressed by skeletal muscle radiodensity despite technical difficulties.
High PhA indicates better body composition; conversely, a low PhA is strongly associated with conditions such as sarcopenia, which are closely linked to body composition. Although this study included participants of all ages and did not specifically focus on sarcopenia in older people, readers should note that low PhA was closely related to sarcopenia, as reported in other studies. A study conducted in Italy on community-dwelling individuals aged 65–93 years [
19] found that individuals with sarcopenia had a PhA decrease of −18.0% in men and −14.8% in women. In Japan, a study conducted on older people aged ≥ 65 reported that men and women with sarcopenia had PhA decreases of −24.4% and −20%, respectively [
20]. Thus, the close relationship between PhA and body composition components, such as muscle mass, indicates that PhA can serve as a criterion for assessing sarcopenia in older people.
In previous studies, PhA demonstrated its prognostic utility in multiple domains of health and disease [
21]. The analysis of metabolic disease prevalence indicates that higher PhA is associated with lower rates of obesity, DM, and HTN across age groups. Moreover, a higher PhA correlates with better hematologic health, as indicated by higher hemoglobin, hematocrit, and WBC counts. This finding indicates that PhA could serve as a useful marker for metabolic health. Underlying this basis is oxidative stress at the level of chronic diseases such as diabetes and cardiovascular disease. [
22]. Particularly, the utility of PhA was demonstrated in obesity research, where it was used to assess body composition changes in patients with a BMI of ≥ 35 kg/m
2 [
23]. Additionally, the PhA values according to the presence of DM and chronic kidney disease were 5.7 ± 0.7 in the non-DM group and 5.3 ± 0.7 in the DM group [
24]. In other words, the PhA level may be a potential indicator of oxidative damage; thus, the utility of PhA as a marker of inflammation, and oxidative stress should be monitored continuously.
The etiological mechanism underlying the relationship between PhA and nutritional status is presumed to involve BCM. Malnutrition is associated with a net loss of BCM and cell membrane surface area, or cell damage is represented in the direction of the cell mass loss [
25]. This relationship among clinical changes, malnutrition, and PhA was also found to be relevant in patients with critical illness or cancer [
26]. According to Seo et al. [
24] who analyzed the nutritional intake of patients on dialysis, participants in the lowest tertile of protein intake had lower PhA, SGA scores, and serum albumin levels than those in the highest tertile. Thus, the quantitative changes in PhA may reflect nutritional status. In this study, nutritional intake comparisons reveal that individuals with higher PhA consume more energy, protein, fat, and carbohydrates, indicating a more nutrient-rich diet. Higher intake of vitamins and minerals, such as calcium, phosphorus, and vitamins B
1 and B
2, was also observed in high PhA groups, indicating that balanced nutrition contributes to better PhA and overall health. These changes reflect typical age-related shifts in body composition, highlighting the need for an age-specific nutritional strategy that addresses such age-related transformations. For example, ingredients that support muscle maintenance or increase are crucial for increasing PhA and promoting healthy aging.
This study on PhA has profound clinical implications, offering new avenues for enhancing patient care through personalized and comprehensive health assessments. In patients with cancer, a PhA below the fifth percentile was linked to poorer nutrition, functionality, quality of life, and higher mortality, with PhA being a stronger predictor of 6-month survival than malnutrition and disease severity in the Cox regression model [
27]. PhA emerges as a pivotal biomarker that clinicians can use to gauge nutritional status, particularly in vulnerable populations such as the older group, where it helps in identifying risks of malnutrition and monitoring the effectiveness of dietary interventions. Norman et al. [
28] revealed that each 1° increase in the PhA was associated with an approximately 23% reduction in mortality risk among older patients. Moreover, the role of PhA in physical rehabilitation is significant because it provides a metric for adjusting exercise programs to optimize muscle function and recovery. A meta-analysis of 10 studies demonstrated that resistance training increases the PhA in older adults [
29], supporting its use as a rehabilitation marker by improving muscle mass, promoting cell membrane integrity, and balancing intracellular and extracellular fluid.
Nutritionally, the relationship between PhA and dietary intake highlights the potential for individualized nutritional counseling, which ensures that patients receive the necessary nutrients to maintain or improve their PhA and overall health. A study of 80 adult inpatients revealed that BIA-derived PhA is a reliable marker of nutritional status, showing an inverse association with subjective global assessment (odds ratio [OR], 0.21; 95% confidence interval [CI], 0.12–0.37), higher predictive accuracy for malnutrition than citrulline and transthyretin (OR, 0.98; 95% CI, 0.97–0.99), and absence of influence from food intake or exercise, making it a practical tool for nutritional assessment [
30]. By incorporating PhA into routine health check-ups, clinicians can detect health issues early, ultimately improving patient outcomes through prompt and targeted interventions.
This study has some limitations. First, because a cross-sectional study of community-dwelling individuals was conducted, we could not establish PhA cutoff values for specific health phenomena or patient populations. By supplementing with more in-depth hematological or medical record data for specific diseases, future studies may determine how to translate the scientific understanding of PhA to clinical practice. Second, the cross-sectional design limits the ability to establish causality. Moreover, as the study provides valuable insights into the relationship between PhA and various health indicators, potential confounders that might influence these associations must be considered. Future studies should aim to control for such variables to better understand the independent effects of PhA on health outcomes.
Researchers and developers, by focusing on PhA as a key marker, can better target the nutritional needs of individuals, formulating a diet strategy that caters to the diverse needs of different age groups. This approach not only supports individual health goals but also aligns with broader public health objectives to reduce the prevalence of age-related diseases and improve life expectancy. Overall, this study underscores the importance of PhA in health status assessment. It highlights the need for continued research to further understand the complex interactions among PhA, nutrition, and health outcomes. With ongoing advancements, health management and disease prevention may improve through targeted nutritional strategies.
In conclusion, PhA serves as a vital physiological marker for health management and functional food development. It offers valuable insights into body composition and metabolic health, underscoring the need for targeted nutritional interventions. Creating functional foods that enhance PhA through balanced nutrition and specific active ingredients could significantly contribute to health promotion across various age groups.
NOTES
-
Conflict of Interest: The authors declare that they have no competing interests.
-
Author Contributions:
Conceptualization:Cho JM.
Writing - original draft:Cho JM.
Writing - review & editing:Bae J, Lee J, Park SI, Cho JM.
REFERENCES
- 1. Son JW, Han BD, Bennett JP, Heymsfield S, Lim S. Development and clinical application of bioelectrical impedance analysis method for body composition assessment. Obes Rev 2025;26:e13844.
- 2. Ward LC. Bioelectrical impedance analysis for body composition assessment: reflections on accuracy, clinical utility, and standardisation. Eur J Clin Nutr 2019;73:194-199.
- 3. Lee DY, Oh JS, Kim JW, Kim JS, Oh M, et al. Comparative analysis of body composition using torso CT from PET/CT with bioelectrical impedance and muscle strength in healthy adults. Sci Rep 2024;14:21597.
- 4. Iqbal SR. Physics of bio-electrical impedance analysis: phase angle and its application. Adv Life Sci Technol 2013;9:4-12.
- 5. Fernández-Jiménez R, Martín-Masot R, Cornejo-Pareja I, Vegas-Aguilar IM, Herrador-López M, et al. Phase angle as a marker of outcome in hospitalized pediatric patients. A systematic review of the evidence (GRADE) with meta-analysis. Rev Endocr Metab Disord 2023;24:751-765.
- 6. da Silva TK, Berbigier MC, Rubin BA, Moraes RB, Corrêa Souza G, et al. Phase angle as a prognostic marker in patients with critical illness. Nutr Clin Pract 2015;30:261-265.
- 7. Kim S, Ha YC, Kim DY, Yoo JI. Recent update on the prevalence of sarcopenia in Koreans: findings from the Korea National Health and Nutrition Examination Survey. J Bone Metab 2024;31:150-161.
- 8. Yang J, Yu J, Kim J, Park E. Association between physical activity and phase angle obtained via bioelectrical impedance analysis in South Korean adults stratified by sex. Nutrients 2024;16:2136.
- 9. Oh K, Kim Y, Kweon S, Kim S, Yun S, et al. Korea National Health and Nutrition Examination Survey, 20th anniversary: accomplishments and future directions. Epidemiol Health 2021;43:e2021025.
- 10. Kweon S, Kim Y, Jang MJ, Kim Y, Kim K, et al. Data resource profile: the Korea National Health and Nutrition Examination Survey (KNHANES). Int J Epidemiol 2014;43:69-77.
- 11. Khalil SF, Mohktar MS, Ibrahim F. The theory and fundamentals of bioimpedance analysis in clinical status monitoring and diagnosis of diseases. Sensors (Basel) 2014;14:10895-10928.
- 12. Kyle UG, Bosaeus I, De Lorenzo AD, Deurenberg P, Elia M, et al. Bioelectrical impedance analysis-part II: utilization in clinical practice. Clin Nutr 2004;23:1430-1453.
- 13. Yi Y, Baek JY, Lee E, Jung HW, Jang IY. A comparative study of high-frequency bioelectrical impedance analysis and dual-energy X-ray absorptiometry for estimating body composition. Life (Basel) 2022;12:994.
- 14. Schoeller DA. Bioelectrical impedance analysis. What does it measure? Ann N Y Acad Sci 2000;904:159-162.
- 15. Keys A, Fidanza F, Karvonen MJ, Kimura N, Taylor HL. Indices of relative weight and obesity. Int J Epidemiol 2014;43:655-665.
- 16. Cho JM. Nutrition fact label (NFL) use is related to meeting the requirements for vitamins and minerals not listed on NFLs: data from the Korea National Health and Nutritional Examination Survey VIII (2019-2021) for the prepandemic and pandemic periods. PLoS One 2023;18:e0296268.
- 17. Kim K, Jun MH, Hong S, Kim S, Yu S, et al. Effect of body posture on segmental multifrequency bioimpedance variables. J Mech Med Biol 2022;22:2240053.
- 18. Costa Pereira JPD, Rebouças AS, Prado CM, Gonzalez MC, Cabral PC, et al. Phase angle as a marker of muscle quality: a systematic review and meta-analysis. Clin Nutr 2024;43:308-326.
- 19. Marini E, Buffa R, Saragat B, Coin A, Toffanello ED, et al. The potential of classic and specific bioelectrical impedance vector analysis for the assessment of sarcopenia and sarcopenic obesity. Clin Interv Aging 2012;7:585-591.
- 20. Yamada M, Kimura Y, Ishiyama D, Nishio N, Otobe Y, et al. Phase angle is a useful indicator for muscle function in older adults. J Nutr Health Aging 2019;23:251-255.
- 21. Bellido D, García-García C, Talluri A, Lukaski HC, García-Almeida JM. Future lines of research on phase angle: strengths and limitations. Rev Endocr Metab Disord 2023;24:563-583.
- 22. da Silva BR, Orsso CE, Gonzalez MC, Sicchieri JMF, Mialich MS, et al. Phase angle and cellular health: inflammation and oxidative damage. Rev Endocr Metab Disord 2023;24:543-562.
- 23. Kyle UG, Bosaeus I, De Lorenzo AD, Deurenberg P, Elia M, et al. Bioelectrical impedance analysis--part I: review of principles and methods. Clin Nutr 2004;23:1226-1243.
- 24. Seo YK, Lee H, Kim H, Kim TY, Ryu H, et al. Foods contributing to nutrients intake and assessment of nutritional status in pre-dialysis patients: a cross-sectional study. BMC Nephrol 2020;21:301.
- 25. Lukaski HC, Talluri A. Phase angle as an index of physiological status: validating bioelectrical assessments of hydration and cell mass in health and disease. Rev Endocr Metab Disord 2023;24:371-379.
- 26. Arab A, Karimi E, Vingrys K, Shirani F. Is phase angle a valuable prognostic tool in cancer patients’ survival? A systematic review and meta-analysis of available literature. Clin Nutr 2021;40:3182-3190.
- 27. Norman K, Stobäus N, Zocher D, Bosy-Westphal A, Szramek A, et al. Cutoff percentiles of bioelectrical phase angle predict functionality, quality of life, and mortality in patients with cancer. Am J Clin Nutr 2010;92:612-619.
- 28. Norman K, Stobäus N, Pirlich M, Bosy-Westphal A. Bioelectrical phase angle and impedance vector analysis--clinical relevance and applicability of impedance parameters. Clin Nutr 2012;31:854-861.
- 29. Martins AD, Fernandes O, Oliveira R, Bilro V, Lopes G, et al. Effects of exercise programs on phase angle in older adults: a systematic review and meta-analysis. Arch Gerontol Geriatr 2022;103:104787.
- 30. Player E, Morris P, Thomas T, Chan W, Vyas R, et al. Bioelectrical impedance analysis (BIA)-derived phase angle (PA) is a practical aid to nutritional assessment in hospital in-patients. Clin Nutr 2019;38:1700-1706.


