ABSTRACT
The primary aim of this study was to evaluate the value of predictive equation (PE) standard care compared with indirect calorimetry (IC)-based nutrition therapy. The secondary aim was to compare the results among 3 groups to assess the accuracy of IC and PE. This was a single-center, retrospective study of patients admitted to the neurosurgery (NS) intensive care unit (ICU), from January 2019, to August 2020. Anthropometric, biochemical, clinical, and dietary data were collected from NS ICU admission to discharge. If patients had an IC: PE ratio of 90%–110%, they were classified into the optimal estimation group (OEG); if the ratio was < 90%, they were classified into the underestimation group (UG); and if the ratio was > 110%, they were classified into the overestimation group (OG). There were no significant differences in anthropometric, biochemical, clinical data and nutrition assessment between baseline and discharge from the NS ICU. The OEG showed a larger cumulative caloric deficit rate compared to UG and OG, though this difference was not statistically significant. There was a negative association between calf circumference (CC) and length of stay (LOS). Repeated measures of CC showed a significant difference according to LOS and groups (p < 0.001). Anthropometric, biochemical, clinical, and dietary data of 77 NS patients were analyzed to determine the effectiveness of concordance between IC and PE. The UG and OG showed a significant decrease in CC during hospitalization, but CC in the OEG was maintained or increased from 4 weeks onward.
-
Trial Registration
Clinical Research Information Service Identifier:
KCT0006381
-
Keywords: Indirect calorimetry; Body composition; Energy expenditure; Neurosurgery; Nutritional assessment
INTRODUCTION
Accurate determination of energy needs is crucial in critically ill patients because both overfeeding and underfeeding may be associated with complications and undesired consequences [
1]. Under-feeding disturbs the regeneration of the respiratory epithelium and causes respiratory muscle dysfunction, which may prolong ventilator dependence. Even when present sub-clinically, underfeeding is responsible for reduced superficial and deep wound healing. Additionally, failure to provide more than 25% of the recommended calories significantly increases the risk of bloodstream infection [
2]. Similarly, the deleterious effects associated with significant overfeeding, such as poor glycemic control, altered neuroendocrine responses, increased risk of infectious complications, delayed liberation from mechanical ventilation, and even increased mortality rate, have been described [
3]. Determining an appropriate method for predicting energy needs has been an area of research for many years and is essential in treating these patients [
4]. Limitations for using indirect calorimetry (IC) include time constraints, equipment availability, staffing, and cost.
Malnutrition, resulting from inadequate substrate delivery, the presence of an inflammatory response, and metabolic stress, is common in intensive care unit (ICU) patients [
4,
5]. The prevalence of malnutrition in the ICU has been reported to be 56% [
6]. A deficient nutritional status leads to impairments in various clinical outcomes, such as delayed wound healing [
7] and increased nosocomial infections [
8], whereas overnutrition results in hyperglycemia, liver steatosis, and refeeding syndrome [
9]. In contrast, optimal nutrition therapy, namely optimal energy and protein delivery, decreases morbidity and mortality risks [
10].
The use of IC has been proposed to improve the accuracy of determining the varying energy requirements in ICU patients [
11]. However, these recommendations have been poorly implemented in practice [
12]. Therefore, the primary aim of this study was to determine the value of formula-based standard care compared with IC-based nutrition therapy. The secondary aim was to compare the results of the underestimation, optimal estimation, and overestimation groups to understand the accuracy of IC and predictive equation (PE) estimations.
MATERIALS AND METHODS
This study was conducted at a single medical center. The ethics committee of Bundang CHA Medical Center (approval number 2021-06-054) approved the study protocol. The study was registered with the Clinical Research Information Service (registration number
KCT0006381). Among the subjects admitted to the neurosurgical (NS) ICU from January 28, 2019, to August 31, 2020, 77 patients were analyzed. Inclusion criteria were as follows: age ≥ 19 years; mechanical ventilation commenced within 48 hours of ICU admission and likely to be required for more than 48 hours; an inspired fraction of oxygen < 85% and positive end-expiratory pressure < 12 cm H
2O; an estimated minimum stay in the ICU of at least 3 days; and received nutrition through enteral or parenteral feeding. Exclusion criteria were as follows: age < 19 years; discharge or death within 2 days of admission to the ICU; no mechanical ventilation; the presence of leaking chest tube; IC not performed.
IC was performed using the CARESPCAPE 320 (GE, Helsinki, Finland). Trained professionals conducted each measurement for at least 30 minutes. Data for the first 10 minutes were discarded. Measurements were taken under standardized conditions, and ongoing feeding was not interrupted. Patients were positioned supine with minimum movement. For mechanically ventilated patients, gas samples were obtained from the circuit connection of the endotracheal tube to the ventilator and analyzed using breath-by-breath analysis.
Concurrently, PE values were calculated using the Frankenfield formula, which is commonly used in critically ill patients and considers actual body weight. According to Frankenfield and colleagues, the formula is unbiased and valid, with an accuracy of 72% [
13].
FranKenfield equations is as follows:
If the ratio between the IC and Frankenfield formula values was 90%–110%, it was classified as an optimal estimation; if the ratio was < 90%, it was classified into the underestimation group; and if the ratio was > 110%, it was classified as the overestimation group. Weight was determined using bed scales (IBS-200; CASKOREA, Seongnam, Korea) for all patients. Height was measured with a tape measure. Body mass index (kg/m2) was calculated by dividing weight (kg) by height (m) squared. A trained dietitian measured the calf circumference (cm), triceps skinfold thickness (mm), mid-upper arm muscle circumference (cm) and mid-upper arm muscle area (cm2). Body composition was analyzed using bioelectrical impedance analysis (BIA). BIA was repeated every 7 days on average until hospital discharge. BIA was obtained using a portable InBody 310 (Biospace Co., Seoul, Korea). This device consists of 8 electrodes attached to the arms, legs, and trunk and uses 6 different frequencies (1, 5, 50, 250, 500, and 1,000 kHz) to measure impedance. Patients were measured in a supine position on the bed with their arms and legs abducted from the body. Source and sensor electrodes were placed on the thumb and index finger of both hands and on each ankle. Before attaching the electrodes, contact areas were cleaned using alcohol. The phase angle (PhA, θ) values were obtained from the resistance (R) and reactance (Xc) using the following equation:
The sum of the lean mass of the arms and legs was used to define appendicular lean mass (ALM). Skeletal muscle index (SMI) was calculated by dividing ALM by height squared: SMI = Appendicular Skeletal Muscle Mass (SMM)/Height (m2).
The following data were collected via a web-based electronic case report form: blood chemistry (serum albumin, C-reactive protein) values; 24-hour urine collection (urea nitrogen, creatinine clearance) on days 3 and at ICU discharge. Serum albumin (g/dL) and C-reactive protein (mg/dL) concentrations were measured, with the normal ranges being 5.2–3.5 g/dL and 0–0.3 mg/dL, respectively.
Additionally, medical history data related to diagnosis, including comorbidities, surgery, modified Nutrition Risk in the Critically ill (mNUTRIC) score, Acute Physiology and Chronic Health Evaluation (APACHE) II score, Sequential Organ Failure Assessment (SOFA) score, Simplified Acute Physiology Score (SAPS) III, Glasgow Coma Scale (GCS) score, Richmond Agitation and Sedation Scale score, and Braden Scale score were collected on day 3 and at discharge. The Braden Scale was applied daily by a nurse researcher until discharge. The mNUTRIC score is a promising nutritional risk assessment tool validated for use in critically ill patients. If the mNUTRIC score is ≤ 5, the nutritional risk is classified as low; if it is > 5, it is classified as high risk [
14]. The severity of illness was evaluated using APACHE II, SOFA and SAPS III score. The level of consciousness was assessed using GCS score. Pressure ulcer risk was measured using the Braden Scale, which classifies the risk of pressure ulcers as follows: 0 or less (very high risk), 10–12 (high risk), 13–14 (moderate risk), 15–18 (low risk) and 19–23 (no risk) [
15].
Data on nutrition delivered via all routes were collected by a trained dietitian. Information regarding nutrition provided through enteral and parenteral routes was collected from fluid balance and intravenous fluid charts, which were completed as part of routine care by nursing staff. The total amount of energy and protein delivered was calculated. Standard care for all participants included nutritional assessment by a dietitian within 48 hours of admission, which included an estimation of their nutritional requirements. A Subjective Global Assessment (SGA) was performed by a trained dietitian weekly. This assessment was conducted using a validated questionnaire that combined patient history of weight loss, dietary intake, gastrointestinal symptoms, and functional capacity with examination findings of muscle wasting, edema, and ascites [
16]. Patients were classified as well-nourished (A), moderately malnourished (B), or severely malnourished (C) according to the SGA. Data on energy and protein requirements prescribed as part of standard care, as well as the methods used to calculate these requirements, were recorded. Commercially available enteral and parenteral formulas were utilized and prescribed based on clinical need, as assessed by the dietitian. Daily energy provision was measured for all patients receiving enteral or parenteral nutrition. The daily energy deficit was summed to calculate the cumulative energy deficit, and each participant’s cumulative energy deficit from artificial nutrition support was calculated daily until discharge.
Statistical analyses were performed using SPSS, version 29 (IBM, Chicago, IL, USA). Categorical data are presented as counts and percentages, while continuous data are reported as mean ± standard deviation. Energy and protein deficit was calculated as the mean daily absolute difference between intake and estimated requirements. Energy and protein intake, deficit, and the proportion of estimated nutritional requirements met were calculated from all nutrient sources over all the days. One-way analysis of variance was used to compare the means of continuous variables with normal distributed data, while a nonparametric rank test, the Kruskal-Wallis test, was used for non-normally distributed and non-continuously distributed data. The association between calf circumference, group classification, and length of stay was assessed using generalized estimation equations. Changes in frequencies were analyzed using Pearson’s χ2 test. A p value < 0.05 was considered statistically significant.
RESULTS
During the study period, 1,055 patients admitted to the NS ICU were initially eligible for inclusion. However, 978 patients were excluded due to the following reasons: death or discharge within 3 days after NS ICU admission (n = 61), no mechanical ventilation (n = 199), no IC measurement (n = 554), insufficient clinical data (n = 125), and age < 19 years (n = 39) (
Figure 1). Ultimately, a total of 77 patients were enrolled and divided into the underestimation group (n = 16), the optimal estimation group (n = 30) and the overestimation group (n = 31) based on energy requirement percentage (energy requirement by Frankenfield formula/energy expenditure by IC). Baseline demographic and clinical characteristics are shown in
Table 1. The mean age, height, SAPS III score, primary diagnoses, and other baseline characteristics did not differ significantly between groups.
Figure 1
Flow diagram of patients selected for analysis.
NS ICU, neurosurgical intensive care unit; MV, mechanical ventilator.
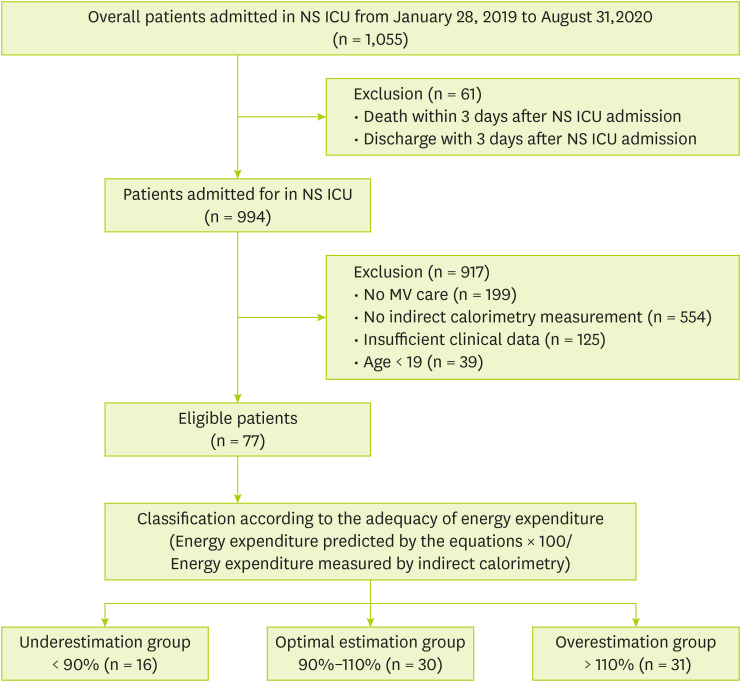
Table 1 Patient characteristics at neurosurgical intensive care unit admission
Table 1
|
Variables |
Under estimation (n = 16) |
Optimal estimation (n = 30) |
Over estimation (n = 31) |
p value |
|
Demographics |
|
|
|
|
|
Age (yr) |
63.1 ± 15.2 |
58.4 ± 16.6 |
61.4 ± 15.2 |
0.595 |
|
Males |
5 (31.3) |
19 (63.3) |
16 (51.6) |
0.116 |
|
Weight (kg) |
64.1 ± 15.1 |
69.2 ± 17.0 |
64.7 ± 10.8 |
0.384 |
|
Height (m) |
159.8 ± 6.9 |
165.5 ± 8.4 |
163.7 ± 7.6 |
0.072 |
|
BMI (kg/m2) |
24.6 ± 5.3 |
25.0 ± 4.4 |
24.1 ± 3.4 |
0.747 |
|
Baseline clinical scores |
|
|
|
|
|
mNUTRIC |
5.0 ± 1.5 |
5.1 ± 1.4 |
5.2 ± 1.3 |
0.845 |
|
SAPS III |
36.0 ± 14.4 |
34.7 ± 13.2 |
34.5 ± 14.7 |
0.935 |
|
RASS |
−4.1 ± 0.5 |
−4.0 ± 1.2 |
−3.8 ± 0.8 |
0.562 |
|
Primary diagnosis |
|
|
|
0.121 |
|
Brain hemorrhage |
14 (87.5) |
27 (90.0) |
22 (71.0) |
|
Brain tumor |
0 (0) |
1 (3.3) |
6 (19.4) |
|
Others*
|
2 (12.5) |
2 (6.7) |
3 (9.7) |
|
Mechanical ventilator |
|
|
|
|
|
Days |
14.8 ± 9.4 |
13.9 ± 15.3 |
19.4 ± 23.0 |
0.461 |
|
Mode |
|
|
|
0.808 |
|
|
PCV |
10 (62.5) |
17 (56.7) |
16 (51.5) |
|
|
PSIMV |
4 (25.0) |
9 (30.0) |
11 (35.5) |
|
|
PSV |
0 (0.0) |
2 (6.7) |
1 (3.2) |
|
|
CMV |
1 (6.3) |
1 (3.3) |
3 (9.7) |
|
|
SIMV |
1 (6.3) |
1 (3.3) |
0 (0.0) |
Anthropometric, biochemical, and clinical data, as well as nutrition assessments upon admission and discharge from the ICU, are compared in
Table 2. The 3 groups did not show significant differences in anthropometric, biochemical, clinical data and nutrition assessments in NS ICU baseline and discharge. The 3 SGA categories did not differ significantly between the groups at baseline or discharge.
Table 2 Anthropometric, biochemical, clinical data and nutrition assessment between baseline and discharge of neurosurgical intensive care unit
Table 2
|
Variables |
Underestimation (n = 16) |
Optimal estimation (n = 30) |
Overestimation (n = 31) |
p value |
|
Baseline |
Discharge |
Baseline |
Discharge |
Baseline |
Discharge |
Baseline |
Discharge |
|
Anthropometric data |
|
|
|
|
|
|
|
|
|
BMI (kg/m2) |
24.6 ± 5.3 |
23.7 ± 4.9 |
25.0 ± 4.4 |
24.2 ± 4.4 |
24.1 ± 3.4 |
23.2 ± 3.1 |
0.747 |
0.642 |
|
CC (cm) |
32.5 ± 3.5 |
31.1 ± 3.7 |
33.4 ± 5.0 |
31.6 ± 4.7 |
31.5 ± 3.9 |
30.2 ± 3.2 |
0.225 |
0.396 |
|
TSF (mm) |
20.5 ± 8.6 |
19.6 ± 8.0 |
20.0 ± 8.2 |
19.4 ± 7.5 |
21.4 ± 6.9 |
21.5 ± 6.7 |
0.767 |
0.53 |
|
MAMC (cm) |
22.3 ± 3.3 |
21.5 ± 3.5 |
23.1 ± 3.3 |
21.2 ± 4.9 |
22.1 ± 2.7 |
20.2 ± 4.8 |
0.387 |
0.568 |
|
MAMA (cm2) |
40.5 ± 12.3 |
37.9 ± 12.5 |
43.6 ± 12.4 |
37.6 ± 12.2 |
39.5 ± 9.2 |
34.3 ± 11.7 |
0.341 |
0.478 |
|
BIA |
|
|
|
|
|
|
|
|
|
PhA (°) |
4.4 ± 1.1 |
4.1 ± 1.2 |
4.5 ± 1.2 |
4.1 ± 1.2 |
4.0 ± 1.8 |
3.7 ± 1.7 |
0.529 |
0.507 |
|
SMI |
5.7 ± 1.1 |
5.2 e 1.0 |
6.4 e 1.1 |
5.8 ± 1.2 |
5.7 ± 1.2 |
5.2 ± 1.2 |
0.07 |
0.134 |
|
ECW/TBW (%) |
0.398 ± 0.005 |
0.417 ± 0.003 |
0.399 ± 0.003 |
0.420 ± 0.000 |
0.407 ± 0.003 |
0.428 ± 0.004 |
0.048 |
0.889 |
|
Biochemical data |
|
|
|
|
|
|
|
|
C-reactive protein (mg/dL) |
1.9 ± 4.1 |
4.6 ± 4.6 |
2.9 ± 5.3 |
6.5 ± 6.6 |
2.6 ± 6.2 |
6.7 ± 9.4 |
0.862 |
0.687 |
|
Serum albumin (g/dL) |
4.0 ± 0.4 |
3.2 ± 0.4 |
3.8 ± 0.6 |
3.3 ± 0.4 |
3.7 ± 0.6 |
3.2 ± 0.5 |
0.432 |
0.503 |
|
NB |
-8.7 ± 3.9 |
-8.2 ± 3.7 |
-10.2 ± 4.3 |
-6.9 ± 5.6 |
-8.0 ± 4.8 |
-6.3 ± 6.8 |
0.229 |
0.617 |
|
Clinical data |
|
|
|
|
|
|
|
|
GCS |
5.0 ± 2.5 |
6.0 ± 3.9 |
5.5 ± 2.9 |
5.8 ± 3.7 |
5.7 ± 3.4 |
6.7 ± 4.4 |
0.714 |
0.658 |
|
Braden score*
|
11.8 ± 1.4 |
12.0 ± 1.5 |
12.3 ± 2.1 |
12.5 ± 2.4 |
12.3 ± 2.3 |
12.9 ± 2.2 |
0.825 |
0.745 |
|
Pressure ulcer |
0 (0.0) |
3 (18.8) |
3 (10.0) |
8 (26.7) |
1 (3.2) |
9 (29.0) |
0.283 |
0.744 |
|
Nutrition assessment |
|
|
|
|
|
|
0.685 |
0.525 |
|
SGA-A |
11 (68.8) |
5 (31.3) |
24 (80.0) |
15 (50.0) |
24 (77.4) |
14 (45.2) |
|
SGA-B |
5 (31.3) |
10 (62.5) |
6 (20.0) |
15 (50.0) |
7 (22.6) |
15 (48.4) |
|
SGA-C |
0 |
1 (6.3) |
0 |
0 |
0 |
2 (6.5) |
Nutrition provision during the NS ICU hospitalization period is described in
Table 3. The target energy requirement by IC was 27.6 ± 4.0 kcal/kg for the underestimation group, 24.9 ± 3.4 kcal/kg for the optimal estimation group, and 21.3 ± 3.1 kcal/kg for the overestimation group, showing a significant difference (p < 0.001). However, target protein requirement by body weight showed no significant difference (p = 0.845): 1.2 ± 0.1 g/kg for the underestimation group, 1.2 ± 0.1 g/kg for the optimal group, and 1.2 ± 0.0 g/kg for the overestimation group. There was no significant difference in cumulative caloric and protein deficit percentages between the groups during the ICU hospitalization period. The average number of days before starting nutrition support after admission the ICU was 1.6 ± 0.8 days for the underestimation group, 2.0 ± 1.4 days for the optimal estimation group, and 1.8 ± 1.0 days for the overestimation group, with no significant difference between groups (p = 0.622). Moreover, 33.3% of patients in the optimal estimation group started enteral nutrition within 48 hours of ICU admission, compared to 37.5% in the underestimation group and 48.4% in the overestimation group. There was no significant difference between groups (p = 0.472). The presence of patients reaching the target energy was 81.3%, for the underestimation group, 60.0% for the optimal estimation group, and 71.0% for overestimation group. There was also no significant difference in the days required to reach the target energy.
Table 3 Nutrition supply status during the hospitalization of NS ICU
Table 3
|
Variables |
Underestimation (n = 16) |
Optimal estimation (n = 30) |
Overestimation (n = 31) |
p value |
|
Targets |
|
|
|
|
|
Calories prescribed (kcal/day) |
1,759.5 ± 388.1ab*†
|
1,713.2 ± 404.7b†
|
1,358.9 ± 199.6c‡
|
< 0.001 |
|
Calories prescribed (kcal/kg) |
27.6 ± 4.0a*
|
24.9 ± 3.4b†
|
21.3 ± 3.1c‡
|
< 0.001 |
|
Proteins prescribed (g/day) |
82.1 ± 18.7 |
89.5 ± 21.5 |
82.2 ± 12.8 |
0.229 |
|
Proteins prescribed (g/kg) |
1.2 ± 0.1 |
1.2 ± 0.1 |
1.2 ± 0.0 |
0.669 |
|
Deficits |
|
|
|
|
|
Cumulative caloric deficit (kcal) |
12,220.5 ± 12,018.1 |
10,329.2 ± 7,579.4 |
6,979.8 ± 8,180.4 |
0.127 |
|
% Cumulative caloric deficit |
33.8 ± 26.3 |
34.0 ± 25.0 |
22.0 ± 23.4 |
0.124 |
|
Cumulative protein deficit (g) |
484.4 ± 533.3 |
539.7 ± 737.5 |
806.4 ± 554.9 |
0.155 |
|
% Cumulative protein deficit |
35.8 ± 29.8 |
33.6 ± 71.0 |
42.2 ± 26.4 |
0.786 |
|
Days from NS ICU admission to initiating nutrition support |
1.6 ± 0.8 |
2.0 ± 1.4 |
1.8 ± 1.0 |
0.622 |
|
Patients who started with EN within 48 hr from NS ICU admission (%) |
6 (37.5) |
10 (33.3) |
15 (48.4) |
0.472 |
|
Days receiving EN |
17.5 ± 9.6 |
20.2 ± 17.4 |
24.3 ± 22.2 |
0.455 |
|
Target energy reach status |
|
|
|
0.316 |
|
No |
3 (18.8) |
12 (40.0) |
9 (29.0) |
|
Yes |
13 (81.3) |
18 (60.0) |
22 (71.0) |
|
Day from NS ICU admission to reaching target energy |
7.3 ± 5.4 |
9.7 ± 6.6 |
10.2 ± 6.9 |
0.427 |
In
Table 4, the length of stay and mortality for hospitalization were compared. The 3 groups did not show significant differences in terms of length of stay, reason for NS ICU discharge, or mortality.
Table 5 compares discharge location and the type of nutritional supply at the time of discharge. The 3 groups did not show significant differences in the types of nutritional supply based on discharge location. Additionally,
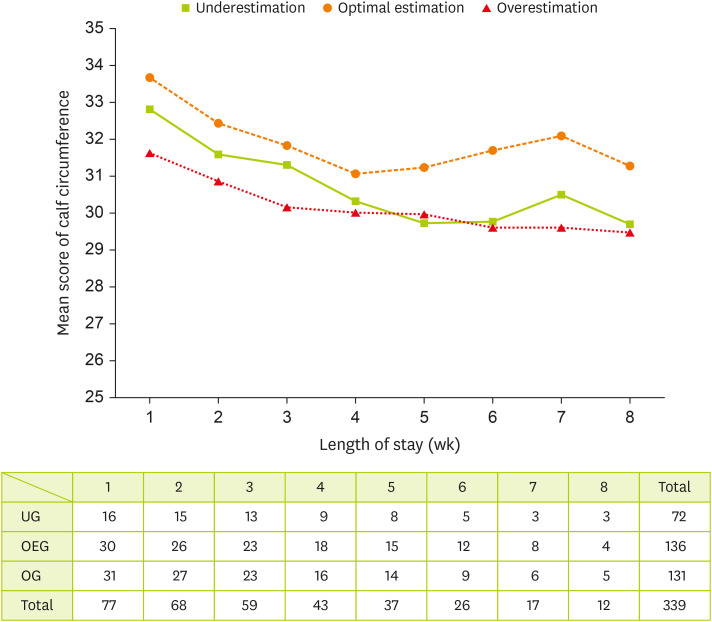
Figure 2 illustrates a negative association between calf circumference and length of stay. Repeated measures of calf circumference showed significant difference according to length of stay and group (p < 0.001).
Table 4 Length of stay and mortality for hospitalization
Table 4
|
Variables |
Under estimation (n = 16) |
Optimal estimation (n = 30) |
Over estimation (n = 31) |
p value |
|
Length of stay |
|
|
|
|
|
NS ICU |
23.0 ± 11.2 |
24.4 ± 16.9 |
31.3 ± 21.6 |
0.216 |
|
Hospital |
48.8 ± 34.7 |
45.5 ± 34.6 |
57.3 ± 56.2 |
0.573 |
|
Reason for NS ICU discharge |
0.996 |
|
Inter-hospital transfer |
11 (68.8) |
20 (66.7) |
21 (67.7) |
|
Permanent care facility |
3 (18.8) |
5 (16.7) |
5 (16.1) |
|
Death |
2 (12.5) |
5 (16.7) |
5 (16.1) |
|
In hospital mortality |
|
|
|
0.519 |
|
NS ICU |
2 (12.5) |
5 (16.7) |
5 (16.1) |
|
Ward |
0 (0) |
0 (0) |
2 (6.5) |
Table 5 Discharge location and type of nutritional supply at the time of discharge
Table 5
|
Discharge location |
Type of nutritional supply |
Under estimation (n = 16) |
Optimal estimation (n = 30) |
Over estimation (n = 31) |
p value |
|
NS ICU (n = 77) |
Enteral nutrition |
16 (100.0) |
25 (83.3) |
25 (80.6) |
0.178 |
|
Parenteral nutrition |
0 |
5 (16.7) |
6 (19.4) |
|
Ward (n = 52) |
Enteral nutrition |
6 (54.5) |
11 (55.0) |
13 (61.9) |
0.88 |
|
Oral diet |
5 (45.5) |
9 (45.0) |
8 (38.1) |
Figure 2
Generally estimated longitudinal change of calf circumference (cm) by groups.
UG, underestimation group; OEG, optimal estimation group; OG, overestimation group.

DISCUSSION
Our study provided evidence that, compared to patients with low energy prediction accuracy through IC and PE, patients with high prediction accuracy experienced more rapid recovery of muscle mass after a 4-week hospital stay. All groups received similar nutrition supplies, but the calf circumference in the optimal estimation group was maintained or increased from week 4.
Bed rest and immobilization are significant contributors to muscle loss; however, when combined with the additional complications of the ICU setting, rapid skeletal muscle wasting occurs [
17]. Muscle mass loss in older ICU patients can be detectable as early as 3 days, and the extent of the loss is both rapid and severe, typically between 14% and 21% within the first week of admission [
18]. Intensive management of nutrition supply is considered necessary to support muscle mass. Although there was no significant difference among the groups in our study, the incidence of pressure ulcers increased over time compared to the beginning of the ICU stay. This suggests a trend toward decreased physical improvement, despite evident clinical improvement. When considering the Braden Scale score, all groups in our study were evaluated as high-risk for pressure ulcers, with scores < 13 at both baseline and ICU discharge. Hyun et al. [
19] retrospectively examined 7,790 medical and surgical ICU patients over 4 years and found that ICU patients who developed pressure ulcers had lower Braden scores compared to those who did not. Similar to our study, all groups in our research had Braden score < 13. The close relationship between pressure ulcer management and nutrition aligns with results from previous studies [
20]. Therefore, pressure ulcers should be managed intensively in both the optimal estimation group and the under/overestimation group.
The cumulative caloric deficit was also 34.0%, 33.8%, and 22.0% in the optimal, under-, and over- estimation groups, respectively, indicating a significant energy deficiency during the NS ICU stay. The cumulative protein deficit was 33.6% in the optimal estimation group and 35.8% and 42.2% in the under- and over- estimation groups, respectively, all exceeding 30%. This deficit may be influenced by various factors, such as adaptation due to increased calorie intake and fasting related to the characteristics of NS. Further analysis is needed to clarify these factors. The target energy reaching rates during the NS ICU were 60.0%, 81.3%, and 71.0%, in the optimal, under-, and over- estimation groups, respectively. The dates for reaching these targets were 9.7, 7.3, and 10.2 days, respectively. A 100% supply of calories and protein was not achieved in any of the groups. In one prospective observational study [
21], patients with a greater cumulative caloric deficit during ICU admission were approximately 3 times more likely to be undernourished. Zarbock et al. [
22] reported that mean calorie intake during 7 days in the NS ICU was about 50%. While meeting the energy requirements for ICU patients is crucial, achieving 100% of the prescribed nutritional supply is challenging due to various factors. A study in the United States found that critically ill patients with medical and surgical diagnosis receive, on average, 40% to 50% of their prescribed nutritional requirements [
23]. Our study found that caloric provision was more than 60%, which is higher than 52% intake reported in an ICU study in the Netherlands [
24]. However, Heyland et al. [
25] suggested that achieving 80% to 90% of prescribed calories in ICU patients is a feasible and realistic goal associated with better clinical outcomes. Minimizing the caloric deficit, allowing permissive underfeeding, initiating trophic feeds, or adjusting the dosage of nutrition therapy requires accurate target setting and ongoing monitoring of nutritional therapy as a percentage of the energy requirements delivered [
26].
Our study confirmed that the optimal estimation group, which had a high agreement between IC and PE, experienced a more rapid recovery of calf circumference after a 4-week hospital stay compared to the underestimation and overestimation groups. Additionally, calf circumference showed a positive correlation with appendicular SMM and SMM/height
2, as measured by dual-energy X-ray absorptiometry, suggesting that calf circumference could serve as a useful screening tool for assessing muscle mass loss [
27]. These findings align with previous studies indicating that the calf is a representative anthropometric site for evaluating SMM and is useful in predicting muscle mass [
28]. Clinicians should realistically assess the impact of nutritional support on muscle mass recovery. Although optimal nutritional intervention is essential, one study has reported that critically ill patients experience significant muscle mass depletion regardless of nutritional adequacy [
29]. Our findings indicate that even if a critically ill patient’s energy expenditure is met or exceeded, achieving positive nitrogen balance, meaningful weight gain, or increased visceral protein levels remains challenging. Moreover, appropriate feeding strategies in the ICU often require clinical judgment rather than strict adherence to measured or predicted energy expenditure data. Notably, our study suggests that intensive nutritional management is particularly crucial for patients with low IC and PE agreement, as this group exhibited a slower recovery rate than those with high agreement. To further investigate factors influencing calf circumference, we evaluated the impact of edema by comparing the extracellular water/total body water ratio between groups. The results showed no significant differences before and after the intervention, indicating that changes in calf circumference were not affected by fluid retention. Additionally, a significant difference in mean calf circumference was observed between groups and hospital stay durations. A significant interaction between group classification and hospital stay duration (p < 0.001) led to the use of a generalized estimating equation to analyze the correlations among calf circumference, hospital stay length, and group classification. The analysis revealed no significant difference in calf circumference between groups (p = 0.226) but identified a significant negative correlation with hospital stay length (p = 0.000). Furthermore, when both group classification and hospital stay length were considered as variables, changes in calf circumference demonstrated a significant difference, reinforcing the association between nutritional adequacy and muscle mass recovery.
Our study compared the results based on the degree of agreement between IC and PE, and found that the optimal estimation group, with high agreement, showed faster recovery after 4 weeks than the under/overestimation groups. Achieving a positive nitrogen balance, meaningful weight gain and increased visceral proteins is unlikely solely by meeting or exceeding a critically ill patient’s energy expenditure. Furthermore, appropriate feeding in the ICU often involves more clinical judgement than strict adherence to predicted or measured energy expenditure data. As one indicator, our study found that intensive management in the group with low IC and PE agreement was more crucial than in the group with high agreement.
This study compared energy expenditure estimates using the Frankenfield equation and IC. The Frankenfield equation incorporates variables such as height, weight, body temperature, and minute ventilation to estimate energy expenditure, whereas IC directly measures oxygen consumption and carbon dioxide production, averaging the values over time and applying a standardized equation [
30]:
Energy expenditure reflects the number of calories a patient utilizes, and IC is widely recognized as the gold standard for its direct measurement of gas exchange, minimizing estimation errors. While the Frankenfield equation considers minute ventilation, which accounts for respiratory dynamics [
13], it differs fundamentally from IC in its calculation principles. IC continuously monitors oxygen consumption and carbon dioxide production, providing a real-time metabolic assessment, whereas the Frankenfield equation relies on indirect physiological variables. Additionally, weight, one of the primary variables in the equation, does not accurately reflect muscle mass, which is closely related to basal metabolic rate. This limitation may contribute to the reduced accuracy of PEs in estimating energy requirements. In this study, despite the 3 groups showing no significant differences in height, weight, severity of illness, or ventilator mode (
Table 1), discrepancies in energy expenditure estimates between IC and the Frankenfield equation were observed. These findings suggest that factors beyond the variables incorporated in the equation influence metabolic demands. Given that IC directly measures metabolic gas exchange rather than relying on indirect predictors, it provides a more precise assessment of energy requirements, particularly in critically ill patients. Therefore, although the Frankenfield equation offers a convenient and practical approach, IC remains the preferred method for individualized nutritional planning in clinical settings.
The strengths of our research are as follows. First, it is significant that we grouped patients based on the degree of agreement between the required amount of energy predicted by equations and the amount measured by IC. This is important because PEs are more commonly used than IC in clinical practice. Second, this study was a comparative analysis of energy requirements in a single center specialized for NS patients, which adds reliability to the results due to the similarity in clinical features among the subjects. However, this study has several limitations. First, it was an observational study without any intervention, so advanced nutritional therapy could not be implemented. Second, the exact results were difficult to determine because the nutritional supply did not meet the target amounts. Despite these limitations, this study is considered meaningful as it realistically reflects the clinical situation of NS patients.
CONCLUSION
In conclusion, this study analyzed 77 patients categorized into underestimation, optimal estimation, and overestimation groups based on IC and PE agreement. While there were no significant differences in baseline characteristics, nutritional intake, or clinical outcomes such as length of stay and mortality between groups, significant differences were observed in energy requirements determined by IC. Notably, the optimal estimation group demonstrated better muscle mass preservation, as indicated by maintained or increased calf circumference after 4 weeks of hospitalization. However, since the length of hospital stay varied among groups, further comparative studies with a larger sample size are needed. The secondary aim was to assess the accuracy of IC and PE estimations, and the results suggest that intensive nutritional management is particularly crucial for patients with low concordance between IC and PE to support better recovery outcomes. Further research is warranted to determine whether accurate measurement of energy requirements can lead to improved clinical outcomes in this patient population.
NOTES
-
Conflict of Interest: The authors declare that they have no competing interests.
-
Author Contributions:
Conceptualization: Lim H.
Data curation: Bae E.
Formal analysis: Lee Y.
Funding acquisition: Jang J.
Investigation: Kang S.
Methodology: Kim M.
Project administration: Bae E.
Resources: Kim T.
Software: Lee Y.
Supervision: Jang J.
Validation: Son K.
Visualization: Kang S.
Writing - original draft: Kim T, Lim H.
Writing - review & editing: Bae E.
REFERENCES
- 1. Kross EK, Sena M, Schmidt K, Stapleton RD. A comparison of predictive equations of energy expenditure and measured energy expenditure in critically ill patients. J Crit Care 2012;27:321.e5-321.e12.
- 2. Rubinson L, Diette GB, Song X, Brower RG, Krishnan JA. Low caloric intake is associated with nosocomial bloodstream infections in patients in the medical intensive care unit. Crit Care Med 2004;32:350-357.
- 3. Klein CJ, Stanek GS, Wiles CE 3rd. Overfeeding macronutrients to critically ill adults: metabolic complications. J Am Diet Assoc 1998;98:795-806.
- 4. McCarthy MS, Phipps SC. Special nutrition challenges: current approach to acute kidney injury. Nutr Clin Pract 2014;29:56-62.
- 5. Jensen GL. Malnutrition and inflammation—“burning down the house”: inflammation as an adaptive physiologic response versus self-destruction? JPEN J Parenter Enteral Nutr 2015;39:56-62.
- 6. Mogensen KM, Robinson MK, Casey JD, Gunasekera NS, Moromizato T, et al. Nutritional status and mortality in the critically ill. Crit Care Med 2015;43:2605-2615.
- 7. Jensen GL, Wheeler D. A new approach to defining and diagnosing malnutrition in adult critical illness. Curr Opin Crit Care 2012;18:206-211.
- 8. Schneider SM, Veyres P, Pivot X, Soummer AM, Jambou P, et al. Malnutrition is an independent factor associated with nosocomial infections. Br J Nutr 2004;92:105-111.
- 9. Tappy L. Metabolic consequences of overfeeding in humans. Curr Opin Clin Nutr Metab Care 2004;7:623-628.
- 10. Oshima T, Deutz NE, Doig G, Wischmeyer PE, Pichard C. Protein-energy nutrition in the ICU is the power couple: a hypothesis forming analysis. Clin Nutr 2016;35:968-974.
- 11. De Waele E, Honoré PM, Malbrain MLNG. Does the use of indirect calorimetry change outcome in the ICU? Yes it does. Curr Opin Clin Nutr Metab Care 2018;21:126-129.
- 12. Lev S, Cohen J, Singer P. Indirect calorimetry measurements in the ventilated critically ill patient: facts and controversies—the heat is on. Crit Care Clin 2010;26:e1-e9.
- 13. Walker RN, Heuberger RA. Predictive equations for energy needs for the critically ill. Respir Care 2009;54:509-521.
- 14. de Vries MC, Koekkoek WK, Opdam MH, van Blokland D, van Zanten AR. Nutritional assessment of critically ill patients: validation of the modified NUTRIC score. Eur J Clin Nutr 2018;72:428-435.
- 15. de Souza MFC, Zanei SSV, Whitaker IY. Risk of pressure injury in the ICU: transcultural adaptation and reliability of EVARUCI. Acta Paul Enferm 2018;31:201-208.
- 16. Detsky AS, McLaughlin JR Jr, Baker JP, Johnston N, Whittaker S, et al. What is subjective global assessment of nutritional status? JPEN J Parenter Enteral Nutr 1987;11:8-13.
- 17. McKendry J, Thomas ACQ, Phillips SM. Muscle mass loss in the older critically ill population: potential therapeutic strategies. Nutr Clin Pract 2020;35:607-616.
- 18. Gruther W, Benesch T, Zorn C, Paternostro-Sluga T, Quittan M, et al. Muscle wasting in intensive care patients: ultrasound observation of the M. quadriceps femoris muscle layer. J Rehabil Med 2008;40:185-189.
- 19. Hyun S, Vermillion B, Newton C, Fall M, Li X, et al. Predictive validity of the Braden scale for patients in intensive care units. Am J Crit Care 2013;22:514-520.
- 20. Thomas DR. Prevention and treatment of pressure ulcers. J Am Med Dir Assoc 2006;7:46-59.
- 21. Peev MP, Yeh DD, Quraishi SA, Osler P, Chang Y, et al. Causes and consequences of interrupted enteral nutrition: a prospective observational study in critically ill surgical patients. JPEN J Parenter Enteral Nutr 2015;39:21-27.
- 22. Zarbock SD, Steinke D, Hatton J, Magnuson B, Smith KM, et al. Successful enteral nutritional support in the neurocritical care unit. Neurocrit Care 2008;9:210-216.
- 23. Barr J, Hecht M, Flavin KE, Khorana A, Gould MK. Outcomes in critically ill patients before and after the implementation of an evidence-based nutritional management protocol. Chest 2004;125:1446-1457.
- 24. Binnekade JM, Tepaske R, Bruynzeel P, Mathus-Vliegen EM, de Hann RJ. Daily enteral feeding practice on the ICU: attainment of goals and interfering factors. Crit Care 2005;9:R218-R225.
- 25. Heyland DK, Cahill N, Day AG. Optimal amount of calories for critically ill patients: depends on how you slice the cake! Crit Care Med 2011;39:2619-2626.
- 26. McClave SA, Martindale RG, Kiraly L. The use of indirect calorimetry in the intensive care unit. Curr Opin Clin Nutr Metab Care 2013;16:202-208.
- 27. Santos LP, Gonzalez MC, Orlandi SP, Bielemann RM, Barbosa-Silva TG, et al. New prediction equations to estimate appendicular skeletal muscle mass using calf circumference: results from NHANES 1999-2006. JPEN J Parenter Enteral Nutr 2019;43:998-1007.
- 28. Al-Gindan YY, Hankey CR, Leslie W, Govan L, Lean ME. Predicting muscle mass from anthropometry using magnetic resonance imaging as reference: a systematic review. Nutr Rev 2014;72:113-126.
- 29. Reid CL. Nutritional requirements of surgical and critically-ill patients: do we really know what they need? Proc Nutr Soc 2004;63:467-472.
- 30. Headley JM. Indirect calorimetry: a trend toward continuous metabolic assessment. AACN Clin Issues 2003;14:155-167.

 , Kumhee Son2