ABSTRACT
Malnutrition affect clinical outcomes in hospitalized old age patients, but the data on the related outcomes on the basis of different age categories are still limited. We aimed to investigate the interplay of associations among body mass index (BMI), falls risk, and mortality rate in different older adult patient age categories. This retrospective study included hospitalized patients aged ≥ 65 years who received artificial nutrition. Demographic, biochemical, and survival data were collected. BMI was evaluated using the World Health Organization BMI cutoffs for Asians, and patients were classified into high (≥ 23.0 kg/m2), normal (18.5−22.9 kg/m2), and low (< 18.5 kg/m2) BMI groups. The Morse Fall Scale was used to assess falls risk. By age categories, all patients (n = 4,642) were divided into the 65−74 (n = 2,649) and ≥ 75 (n = 1,993) years age groups. We found that the proportion of low-BMI and high risk of falls increased with age. Further, low-BMI was associated with increased falls risk in both age groups. Overall survival rate tended to be lower in the low-BMI and ≥ 75 years group than that in other patient groups, but did not differ significantly compared with the low-BMI and 65–74 years group. Low-BMI was associated with increased falls risk and mortality; however, the association depended on specific patient age groups.
-
Keywords: Body mass index; Falls; Mortality; Aged; Hospitalization
INTRODUCTION
Malnutrition and falls are important indicators for quality improvement and safety in hospitals, and affect mortality, particularly in old age inpatients [
1,
2,
3,
4]. Previous studies have shown that > 30% of hospitalized old age patients have worsening nutritional status in comparison to that at admission [
5]. Although nutritional status deterioration may be related to various factors, to date, age has been identified as a major risk factor for malnutrition, and the prevalence of malnutrition remains high in old age patients [
6]. Clinically, old age patients are generally considered a single homogeneous group, and the association of nutritional management limitations or benefits on age (for example, youngest-old vs. oldest-old) is not considered in clinical decisions. Hence, the data on the outcomes of malnutrition on the basis of different age categories are still limited [
7].
Malnourished old age adults are predicted to have a higher mortality risk [
3]. The body mass index (BMI) has been shown to adequately predict mortality in old age adults [
8,
9]; however, the relationship between mortality and BMI is not linear but rather U-shaped in community-based populations [
10,
11,
12], and hence, the association between BMI and mortality is still unclear in hospital settings [
13]. Furthermore, uniform application of BMI criteria may not be possible in specific old age Asian and Western populations [
14].
Falls are common in old age hospitalized patients and result in adverse outcomes [
1,
2,
4,
15]. Fall assessment tools have been developed to predict falls risks so that prevention screening efforts can target patients most susceptible to falls [
16]. Compared to those who received low risk scores based on the assessment tools, patients who received high scores are 10-times more likely to experience a fall at the hospital [
2,
15]. Furthermore, a previous study showed 3.5-times higher mortality rate in the high-risk of falls group than that in the low-risk of falls group, suggesting that a high-risk score in the assessment tools may be associated with markedly adverse prognostic implications [
1,
4]. Therefore, assessing the risk of falls using highly predictive specific tools for the hospitalized patient is fundamental to effective fall prevention nursing strategies.
The nutritional status has been shown to be associated with the risk of falls [
6,
17,
18,
19,
20,
21,
22]; malnourished patients have a 2-fold higher chance of falls during the hospital stay than non-malnourished patients. This may be due to sarcopenia in malnourished patients, leading to decreasing physical function by loss of muscle mass and decreasing muscle strength and power [
20,
21,
22]. Despite the availability of several studies, no consensus has yet been reached on the association of nutritional status with the risk of falls based on different parameters such as diverse hospital settings and patient age; most studies involved community-dwelling old age adults [
20,
21,
23,
24].
Furthermore, nutritional status deterioration is associated with negative clinical outcomes, such as postoperative complications, impaired wound healing, infections, pressure ulcers, and prolonged hospital stay [
1,
13,
25]. Therefore, the American Society for Parenteral and Enteral Nutrition (ASPEN) and the European Society for Clinical Nutrition and Metabolism (ESPEN) recommend addressing the nutritional status in acute-care hospital settings [
26,
27,
28]. This is particularly crucial for nutritionally vulnerable old-age patients, who have a higher potential risk of associated clinical complications than younger patients.
Although several commonly used nutritional assessment tools exist, the gold standard tool remains unknown. However, while these tools include BMI as a component when identifying malnutrition risk, evaluation of nutritional status may also be based on BMI alone [
5,
6,
7,
8,
10,
11,
12,
13,
14,
18,
19,
20,
21,
22,
23,
24]. In clinical practice, for routine nutritional assessment, BMI is a simple, feasible, cost effective, and pragmatic measure for the clinical staff to calculate. Therefore, in this study, BMI was used as the representative indicator for diagnosing malnutrition [
14].
This study aimed to 1) identify the relationship between BMI and falls risk in hospitalized old age adults who require nutritional management, by age categories, and 2) evaluate all-cause mortality as a long-term prognosis of BMI by age categories.
MATERIALS AND METHODS
Study design and participants
This retrospective study collected data of 15,066 patients (≥ 65 years of age) who had received artificial nutrition from the nutritional support team (NST) during their hospital stay at one tertiary hospital in Seoul between January 2010 and December 2017. Traditionally, NST includes a physician, nurse, dietitian, and pharmacist, and the purpose of the NST is to provide a safe and appropriate nutrition support therapy to patients [
28]. Based on the results of the nutritional status evaluation, the NST referral can be applied to those patients who are at risk of malnutrition or those who do not currently have nutritional problems but have insufficient oral intake due to surgery or other reasons [
29]. Recently, cancer has been defined as a chronic disease that is quickly, inevitably, and over time, transitioning from a fatal disease to a manageable condition [
30]. Therefore, cancer patients who underwent curative resection were included in this study analysis. Exclusions were short-term admissions for simple interventions or examinations (n = 158), patients receiving palliative care for stage IV cancer with metastasis or recurrence (n = 6,810), and intensive care unit (ICU) admissions (n = 2,488). Finally, a total of 4,642 patients who were hospitalized for > 7 days for cancer-related or non-cancer treatment were included in this study.
Data on the demographic (age, sex, education level, economic status, marital status, smoking, alcohol consumption), anthropometric (height and weight), disease-specific (diagnosis at that time of admission, medical department [internal medicine or surgery], type of comorbidity, number of comorbidities, current medication, information for intensive care unit admission, and death date), and biochemical nutrition-related (serum protein, albumin, cholesterol, hemoglobin, and C-reactive protein levels) factors were collected. The total amount of alcohol consumed per week was estimated by multiplying the averages of the weekly frequency and amount consumed in one session. In the 2017 National Survey of Older Koreans, the proportions of older adults aged 65−74 and over 75 years were reported to be about 57% and 43%, respectively; the proportion of those aged 75 years or more has been confirmed to be increasing continuously [
31]. In addition, recent nutrition related studies have reported comparable clinical outcomes for groups classified into 65–74 years (young-old) and 75 or older (old-old) [
32,
33]. Therefore, in this study, based on age, participants were categorized into 2 groups: 1) 65−74 years old and 2) ≥ 75 years old.
The types of artificial nutrition were classified as enteral nutrition (EN) or parenteral nutrition (PN). If both of these types were applied, only one dominant method was chosen as the main type of artificial nutrition. The nutritional status was evaluated at admission as per the World Health Organization (WHO) Asian BMI classification [
14], and based on the BMI, patients were classified into 3 categories: 1) high-BMI (BMI ≥ 23.0 kg/m
2), 2) normal-BMI (BMI 18.5−22.9 kg/m
2), and 3) low-BMI (BMI < 18.5 kg/m
2). Further, this study focused on the low-BMI group, defined as the undernutrition group by the WHO criteria [
14].
The Morse Fall Scale (MFS) is a simple and widely used method to assess falls risk, and has been proven to be effective in different settings, including hospitals; patients categorized in high risk group according to the MFS represent more likelihood of falling than that of those categorized in low risk group [
16]. The MFS is composed of 6 items: 1) a history of falling in the past 3 months (yes = 25; no = 0), 2) secondary diagnosis (yes = 15; no = 0), 3) ambulatory aids (furniture = 30; crutches/cane/walker = 15; bed rest/nurse assist = 0), 4) intravenous therapy (yes = 20; no = 0), 5) gait (impaired = 20; weak = 10; normal/bed rest/immobile = 0), and 6) mental status (forgets limitations = 15; oriented to own ability = 0). These items are scored as no risk (0−24), moderate risk (25−44), or high risk of falls (≥ 45) by the Korean version of the MFS [
34]. BMI and MFS analysis was conducted on patients’ data collected at the time of admission.
This study was approved by the Institutional Review Board of Seoul National University Hospital (approval number: H-1804-177-944). All procedures followed were in accordance with the ethical standards of the responsible committee on human experimentation and tenets of Helsinki Declaration. Because of the retrospective design and low risk of this study, the informed consent requirement was waived.
Data analysis
All the statistical analysis was conducted using IBM SPSS for Windows, version 23.0 software package (IBM, Armonk, NY, USA). Continuous variables are represented as the mean ± standard deviation. Student’s t-test and analysis of variance were performed for variables with normal distribution. Categorical data are described using values and percentages, and were compared using Pearson’s χ2 test. Kaplan−Meier estimates were used to evaluate all-cause mortality. Statistical significance was set at p < 0.05.
RESULTS
Demographic characteristics
Table 1 shows the demographic characteristics of the patients (n = 4,642). The mean age was 74.2 ± 6.6 years, and the majority of the patients were male (61.9%). The 65−74 and ≥ 75 years old patients’ groups included 2,649 (57.1%) and 1,993 (42.9%) patients, respectively.
Table 1Demographic characteristics of study participants according to age group
Table 1
|
Variables |
All (n = 4,642) |
65–74 years (n = 2,649, 57.1%) |
≥ 75 years (n = 1,993, 42.9%) |
p value |
|
Age (yr) |
74.2 ± 6.6 |
69.6 ± 2.8 |
80.4 ± 4.8 |
< 0.001 |
|
Sex |
|
|
|
< 0.001 |
|
Male |
2,872 (61.9) |
1,717 (64.8) |
1,155 (58.0) |
|
Female |
1,770 (38.1) |
932 (35.2) |
838 (42.0) |
|
Type of nutrition |
|
|
|
< 0.001 |
|
Enteral nutrition |
1,838 (39.6) |
914 (34.5) |
924 (46.4) |
|
Parenteral nutrition |
2,804 (60.4) |
1,735 (65.5) |
1,069 (53.6) |
|
Marital status |
|
|
|
< 0.001 |
|
Married |
4,074 (89.0) |
2,411 (92.2) |
1,663 (84.8) |
|
Widowed |
413 (9.0) |
143 (5.5) |
270 (13.8) |
|
Others (single/divorced etc.) |
89 (1.9) |
61 (2.3) |
22 (1.4) |
|
|
Existence of spouses |
|
|
|
< 0.001 |
|
Yes |
4,074 (89.0) |
2,411 (92.2) |
1,663 (84.8) |
|
No |
502 (11.0) |
204 (7.8) |
298 (15.2) |
|
Education level |
|
|
|
< 0.001 |
|
Elementary school |
1,131 (24.4) |
579 (21.8) |
552 (27.8) |
|
Middle school |
690 (14.9) |
466 (17.6) |
224 (11.3) |
|
High school |
1,086 (23.4) |
701 (26.5) |
385 (19.4) |
|
University or above |
1,161 (25.1) |
625 (23.6) |
536 (26.9) |
|
Non-response |
569 (12.3) |
277 (10.5) |
292 (14.7) |
|
Economic status |
|
|
|
<0.001 |
|
High level |
228 (5.2) |
94 (3.8) |
134 (7.1) |
|
Middle level |
1,574 (36.1) |
923 (37.4) |
651 (34.4) |
|
Low level |
576 (13.2) |
370 (15.0) |
206 (10.9) |
|
Non-response |
1,984 (45.5) |
1,083 (43.8) |
901 (47.6) |
|
Smoking |
|
|
|
< 0.001 |
|
Yes |
464 (10.1) |
329 (12.6) |
135 (6.9) |
|
No (quitted) |
4,111(89.9) |
2,288 (87.4) |
1,823 (93.1) |
|
Smoking (pack-year) |
39.30 ± 13.67 |
38.32 ± 12.45 |
41.69 ± 16.07 |
0.030 |
|
Alcohol consumption |
|
|
|
< 0.001 |
|
Yes |
552 (12.1) |
372 (14.2) |
180 (9.2) |
|
No |
4,024 (87.9) |
2,245 (85.8) |
1,779 (90.8) |
|
Heavy drinker (≥ 210 g/week) |
166 (3.6) |
116 (4.4) |
50 (2.5) |
0.001 |
Clinical characteristics
Table 2 shows the clinical characteristics of the patients. A total of 3,699 (79.7%) and 943 (20.3%) patients were diagnosed with non-cancer diseases and cancer (patients who had completed curative resection), respectively. MFS classified 118 (15.9%) patients as the high-risk patients for falls; the proportion of high falls risk patients was significantly higher in ≥ 75 years age-group of patients than that in the 65−74 age-group (p = 0.003). Low-BMI was observed in 719 (20.9%) patients, and the proportion was significantly higher in the ≥ 75 years age-group than in the 65−74 years age-group (p = 0.029).
Table 2Clinical characteristics of study participants according to age group
Table 2
|
Variables |
All (n = 4,642) |
65–74 years (n = 2,649, 57.1%) |
≥ 75 years (n = 1,993, 42.9%) |
p value |
|
Comorbidity |
|
|
|
< 0.001 |
|
No |
918 (19.8) |
618 (23.3) |
300 (15.1) |
|
Yes |
3,724 (80.2) |
2,031 (76.7) |
1,693 (84.9) |
|
1 |
1,989 (53.4) |
1,114 (54.8) |
875 (51.7) |
|
2 |
1,289 (34.6) |
675 (33.2) |
614 (36.3) |
|
3 |
410 (11.0) |
223 (11.0) |
187 (11.1) |
|
≥ 4 |
34 (0.9) |
19 (0.9) |
15 (0.9) |
|
Comorbidity |
1.59 ± 0.72 |
1.58 ± 0.72 |
1.61 ± 0.72 |
0.192 |
|
Medical department |
|
|
|
< 0.001 |
|
Internal medicine |
2,888 (62.2) |
1,530 (57.8) |
1,358 (68.1) |
|
Surgery |
1,754 (37.8) |
1,119 (42.2) |
635 (31.9) |
|
Cancer diagnosis |
|
|
|
< 0.001 |
|
Yes |
943 (20.3) |
664 (25.1) |
279 (14.0) |
|
No |
3,699 (79.7) |
1,985 (74.9) |
1,714 (86.0) |
|
Fall risk assessment (n = 743)*
|
743 (100.0) |
396 (53.3) |
347 (46.7) |
0.003 |
|
High risk |
118 (15.9) |
51 (12.9) |
67 (19.3) |
|
Moderate risk |
246 (33.1) |
121 (30.6) |
125 (36.0) |
|
No risk |
379 (51.0) |
224 (56.6) |
155 (44.7) |
|
BMI (kg/m2) (n = 3,434)†
|
21.54 ± 3.69 |
21.67 ± 3.66 |
21.36 ± 3.73 |
0.018 |
|
Low-BMI (BMI < 18.5) |
719 (20.9) |
399 (19.6) |
320 (22.9) |
0.029 |
|
Normal-BMI (18.5 ≤ BMI < 23) |
1,553 (45.2) |
921 (45.2) |
632 (45.2) |
|
|
High-BMI (BMI ≥ 23) |
1,162 (33.8) |
717 (35.2) |
445 (31.9) |
|
|
Albumin (g/dL) |
3.08 ± 0.59 |
3.12 ± 0.61 |
3.03 ± 0.55 |
< 0.001 |
|
Protein (g/dL) |
6.12 ± 0.88 |
6.15 ± 0.90 |
6.06 ± 0.85 |
0.002 |
|
Total cholesterol (mg/dL) |
134.20 ± 44.69 |
136.31 ± 46.98 |
131.4 1± 41.30 |
< 0.001 |
|
Hemoglobin (g/dL) |
10.62 ± 1.73 |
10.63 ± 1.76 |
10.61 ± 1.68 |
0.690 |
|
CRP (mg/dL) |
4.20 ± 5.80 |
4.44 ± 6.07 |
3.90 ± 5.42 |
0.003 |
Levels of biochemical nutritional markers
The levels of serum albumin (p < 0.001), protein (p = 0.002), total cholesterol (p < 0.001), and C-reactive protein (p = 0.003) decreased with increasing patients’ age (
Table 2); the haemoglobin levels were similar between the 2 aged-based groups; however, like other biochemical nutritional markers, they were lower than normal levels (p = 0.690).
Table 3 shows the distribution of falls risk in each BMI group by age. Among the low-BMI patient population, 76.6% of those in the 65-74 years age group had a moderate-to-high falls risk, whereas this proportion was 71.2% among those in the ≥ 75 years age group. The rates of ‘high risk’ from falls risk assessment according to BMI were as follows: the low-BMI group had significantly higher rates than other BMI groups in both 65–74 years and ≥ 75 years aged-group (25.0% [low BMI] vs. 9.2% [normal BMI] vs. 10.1% [high BMI], p < 0.001) and ≥ 75 years age groups (26.9% [low BMI] vs. 17.4% [normal-BMI] vs. 13.8% [high-BMI], p = 0.047).
Table 3Association BMI and falls risk according to age group
Table 3
|
Variables |
65–74 years (n = 328, 56.5 %) |
≥ 75 years (n = 253, 43.5 %) |
|
BMI |
p value |
BMI |
p value |
|
Low-BMI |
Normal-BMI |
High-BMI |
Low-BMI |
Normal-BMI |
High-BMI |
|
Risk of falls assessment |
|
|
|
< 0.001 |
|
|
|
0.047 |
|
High risk |
17 (25.0) |
13 (9.2) |
12 (10.1) |
14 (26.9) |
21 (17.4) |
11 (13.8) |
|
Moderate risk |
29 (42.6) |
40 (28.4) |
28 (23.5) |
23 (44.3) |
37 (30.6) |
28 (35.0) |
|
No risk |
22 (32.4) |
88 (62.4) |
79 (66.4) |
15 (28.8) |
63 (52.1) |
41 (51.2) |
All-cause mortality
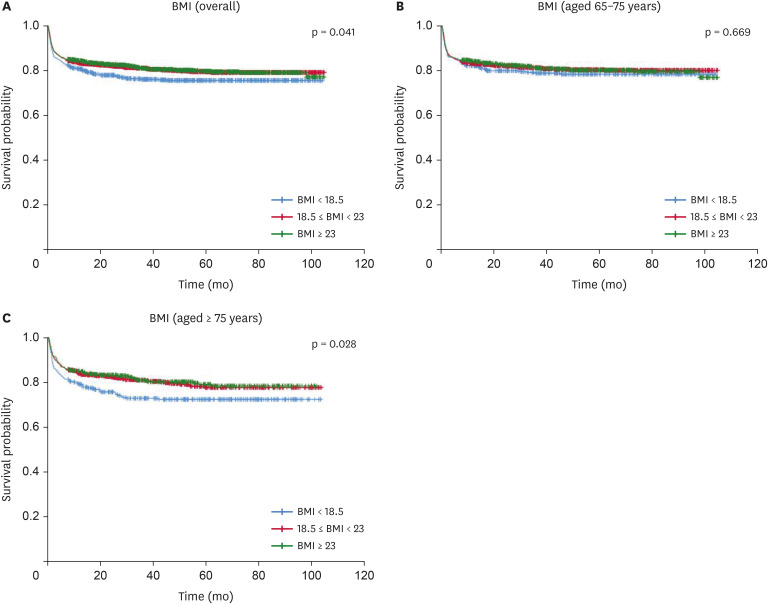
Figure 1 shows the all-cause mortality according to BMI as per age categories. The survival rates tended to be lower (p = 0.041) in the low-BMI group than those in the other BMI-based groups (
Figure 1A). No significant difference (p = 0.669) was noted in survival rates among BMI groups in the 65−74 years age group (
Figure 1B). However, the survival rates of patients in the ≥ 75 years age group tended to be lower (p = 0.028) in the low-BMI group than those in the other groups (
Figure 1C).
Figure 1
Kaplan-Meier curve comparing overall survival on BMI.
Kaplan-Meier curve comparing overall survival on BMI in (A) overall hospitalized older adults, (B) hospitalized older adults with aged 65–74 years, and (C) hospitalized older adults with aged ≥ 75 years.
BMI, body mass index (kg/m2).
DISCUSSION
Malnutrition and falls risk affect patients of all the age groups; however, old age adults are more vulnerable [
6]. Although the negative associations of malnutrition with mortality and falls risk in old age adults have been verified in several previous studies, a detailed analysis on the basis of different age categories was still lacking.
There are many assessment tools and varying diagnostic criteria for malnutrition [
5,
8,
10,
11,
12,
13,
14,
18,
19,
20,
21,
22,
23,
24]. Although the most appropriate tool for evaluating malnutrition in older adults is unknown, very low BMI, an indication of malnutrition, is associated with negative clinical outcomes in older adults [
8,
9]. In this study, BMI was used to evaluate the nutritional status in old age groups, and low-BMI was considered as indicating malnutrition. This study showed significant differences in low-BMI and falls risk between the two age groups (< 75 and ≥ 75 years) who required nutritional support at the time of hospitalization. Additionally, it revealed that patients ≥ 75 years old with low-BMI tended to show association with mortality.
Old age adults are hospitalized more often than young patients due to associated chronic comorbidities. During the hospital stay, patients’ intake is often poor due to the lack of appetite; as reported, most patients in the hospital eat less than 50% of the served meals, leading to an increase in the proportion of patients with malnutrition [
35]. Further, it was also reported that among old age patients who were not malnourished at admission, 37% showed malnutrition during hospitalization at the facility or hospital [
5]. NST referrals are made for patients at risk of malnutrition or patients with potential risk of worsening nutritional status due to insufficient oral intake following surgery or other reasons, despite no current nutritional problems. In this study, the participants were selected from vulnerable older adult groups and referred for nutritional support by the NST at the time of hospitalization. However, even for the same participants, the prevalence of undernutrition and clinical outcomes vary depending on the timing of assessment and provision of nutritional therapy. This study analyzed data collected at the time of admission, besides mortality that was measured as a long-term outcome, and hence, the effect of NST nutritional support during hospitalization was not reflected in the results.
In general, the prevalence of malnutrition varies depending on methods used for assessment, such as the anthropometric indicators or nutritional assessment tools [
36,
37,
38,
39]. In a previous prospective multicenter study, about 18% of the old age adults were found to be malnourished, and age was indicated as an important influencing factor [
38]. In this study, patients aged ≥ 75 years were found to have a higher incidence of low-BMI than patients aged between 65 and 74 years at the time of hospital admission. This suggests that among hospitalized old age adults who required nutritional therapy at the time of admission, the proportion of patients potentially at risk of deteriorating nutritional status was high in the 65−74 years age group (young old age patients), while those aged ≥ 75 years were already more likely to be undernourished. Hence, patients aged ≥ 75 years require practical nutritional interventions focused on improving the worsening nutritional status, while efforts to prevent deteriorating current nutritional status would be helpful for patients in the 65−74 years age group.
Biochemical nutritional markers are important indicators that reflects the nutritional status. Low albumin and hemoglobin levels are common among hospitalized patients and are important parameters in the assessment of nutritional status in both acute and chronically ill patients [
40]. In this study, biochemical nutritional markers were significantly lower than normal levels and associated with aging. Although the hemoglobin level analysis showed that there was no difference according to age, both groups showed significantly lower levels than normal. Therefore, biochemical nutritional markers are also worsening with increasing age and should be closely monitored as indicators of nutritional status when providing nutritional intervention for those who are referred to the NST.
Malnutrition increases falls risk [
6,
12,
20,
24,
41], and BMI should be evaluated when assessing the risk for falls [
20,
24]. However, malnutrition was rarely mentioned as a risk factor for falls [
23,
42], and some studies have found no significant association [
17,
18] or U-shaped association [
41] between the nutritional status and falls. This study showed that low-BMI, but not high-BMI, is associated with falls risk. These results were consistent with previous study suggesting increased falls risk in individuals with the lowest BMI [
24]. Further, about 70% of the old age adults with low-BMI (all age groups) were found to have a moderate to high falls risk in this study. The impact of low-BMI on the falls risk may be related to sarcopenia, which can aggravate the decline in muscle and physical function [
20,
21,
22,
43]. The causes of falls are multifactorial, and include the nutritional status, health conditions, environmental factors and activities, and drug therapy [
44,
45]. These factors, other than the nutritional status, were included in previously developed screening tools for assessing falls risk. Since falls have also been observed in some patients classified as having low falls risk by MFS, additional new factors affecting falls need to be identified to improve the accuracy of the falls assessment tools [
1,
2,
4]. Although this study provides evidence that lower BMI tended to be associated with higher falls risk in hospitalized older patients, further iterative studies are needed. Hence, BMI, as an easy nutritional assessment measure may provide additional screening assistance for patients at high-risk of falls in the clinical settings. Furthermore, improving the nutritional status of the patients may be considered an appropriate fall prevention strategy to successfully reduce falls risk. The potential relationship between the nutritional status and falls risk is identifiable by collection of information from various clinical settings. Additional studies using other well-known falls risk screening tools such as Hendrich Fall Risk Model (HFRM) and the St. Thomas Risk Assessment Tool In Falling Elderly Inpatients (STRATIFY) are required to clearly evaluate the interplay between nutritional status and falls risk. Further evaluation of BMI is needed to determine its predictive validity for falls risk [
46,
47].
This study also strengthens the importance of age in low-BMI and falls risk; the prevalence of both increased as the age of the patients increased, and individuals with higher mean age were found to be more vulnerable. We found that the proportion of patients with moderate or high falls risk was 11.8% higher in patients aged ≥ 75 years than that of those aged 65−74 years; this not only supports previous results [
20,
21,
23,
24] but also confirms age-dependent differences. In this regard, with increasing age in the older adults, more attention should be focused on the deterioration of nutritional status and falls risk: this may be important for planning adequate prevent interventions in clinical fields.
Nutritional status changes constantly depending on various clinical conditions, and mortality may be also dynamically affected [
48]. Mortality is significantly associated with malnutrition [
11,
25,
38,
43,
44,
49], and malnutrition is identified as an independent risk factor for mortality in old age adults [
50]. Further, old age patients with low-BMI also showed association with increased mortality risk [
11,
49,
50]. In this study, low-BMI did not affect the mortality rate in the 65−74 years age group; however, in those aged ≥ 75 years, it was affected by low-BMI, indicating more negative clinical outcomes. Therefore, even among old-aged adults, the nutritional status has a different effect on mortality when the age was further categorized. Thus, the nutritional status of those aged ≥ 75 years old requires more attention from the time of admission. Efforts to improve the nutritional status may be expected to improve the survival rate; it is necessary to continuously accumulate data on BMI and mortality, in various situations.
This study had certain limitations. First, due to the retrospective nature of this study, all the factors that can affect the nutritional status of hospitalized old age patients were not analyzed. Second, this study evaluated the nutritional status of the participants by using the BMI criteria only. Additional evaluation using anthropometric measurements, such as the degree of weight changes or various nutritional assessment tools, such as the Mini Nutritional Assessment tool, to evaluate the nutritional status of hospitalized elderly are required. Third, this study analyzed variables measured at the time of admission, and hence, the effect of the nutritional support from NST during hospitalization could not be analyzed. Future studies should focus on understanding the effects of strategic nutrition interventions according to different age categories.
CONCLUSION
This study findings indicated that the low-BMI and falls risk increased with aging. Further, low-BMI was associated with increased falls risk. Although low-BMI was found to be correlated with mortality, age-dependency was observed. Hence, age-specific strategies are needed to improve falls risk and low-BMI occurrence. Finally, vigorous efforts to manage the nutritional status and falls risk may reduce negative clinical outcomes in old age hospitalized patients.
NOTES
-
Conflict of Interest: The authors declare that they have no competing interests.
-
Author Contributions:
Conceptualization: Kim E, Seol EM, Lee HJ.
Data curation: Kim E, Seol EM, Lee HJ.
Formal analysis: Kim E, Lee HJ.
Investigation: Kim E, Seol EM, Lee HJ.
Methodology: Kim E, Lee HJ.
Project administration: Kim E, Seol EM, Lee HJ.
Writing - original draft: Kim E.
Writing - review & editing: Kim E, Seol EM, Lee HJ.
ACKNOWLEDGEMENTS
This research did not receive any specific grant from funding agencies in the public, commercial, or not-for-profit sectors. We would like to thank Editage for English language editing. We also thank the privacy team at Seoul National University Hospital for their assistance with the collection of survival data.
REFERENCES
- 1. Carazo M, Sadarangani T, Natarajan S, Katz SD, Blaum C, Dickson VV. Prognostic utility of the Braden Scale and the Morse Fall Scale in hospitalized patients with heart failure. West J Nurs Res 2017;39:507-523.
- 2. Jewell VD, Capistran K, Flecky K, Qi Y, Fellman S. Prediction of falls in acute care using the Morse Fall Risk Scale. Occup Ther Health Care 2020;34:307-319.
- 3. Lim SL, Ong KC, Chan YH, Loke WC, Ferguson M, Daniels L. Malnutrition and its impact on cost of hospitalization, length of stay, readmission and 3-year mortality. Clin Nutr 2012;31:345-350.
- 4. Manemann SM, Chamberlain AM, Boyd CM, Miller DM, Poe KL, Cheville A, Weston SA, Koepsell EE, Jiang R, Roger VL. Fall risk and outcomes among patients hospitalized with cardiovascular disease in the community. Circ Cardiovasc Qual Outcomes 2018;11:e004199.
- 5. Wikby K, Ek AC, Christensson L. Nutritional status in elderly people admitted to community residential homes: comparisons between two cohorts. J Nutr Health Aging 2006;10:232-238.
- 6. Eglseer D, Hoedl M, Schoberer D. Malnutrition risk and hospital-acquired falls in older adults: a cross-sectional, multicenter study. Geriatr Gerontol Int 2020;20:348-353.
- 7. Borkent JW, Naumann E, Vasse E, van der Heijden E, de van der Schueren MAE. Prevalence and determinants of undernutrition in a sample of Dutch community-dwelling older adults: results from two online screening tools. Int J Environ Res Public Health 2019;16:1562-1576.
- 8. Chan TC, Luk JK, Chu LW, Chan FH. Association between body mass index and cause-specific mortality as well as hospitalization in frail Chinese older adults. Geriatr Gerontol Int 2015;15:72-79.
- 9. Tamiya H, Yasunaga H, Matusi H, Fushimi K, Akishita M, Ogawa S. Comparison of short-term mortality and morbidity between parenteral and enteral nutrition for adults without cancer: a propensity-matched analysis using a national inpatient database. Am J Clin Nutr 2015;102:1222-1228.
- 10. Lee SH, Kim DH, Park JH, Kim S, Choi M, Kim H, Seul DE, Park SG, Jung JH, Han K, Park YG. Association between body mass index and mortality in the Korean elderly: a nationwide cohort study. PLoS One 2018;13:e0207508.
- 11. Winter JE, MacInnis RJ, Wattanapenpaiboon N, Nowson CA. BMI and all-cause mortality in older adults: a meta-analysis. Am J Clin Nutr 2014;99:875-890.
- 12. Zheng W, McLerran DF, Rolland B, Zhang X, Inoue M, Matsuo K, He J, Gupta PC, Ramadas K, Tsugane S, Irie F, Tamakoshi A, Gao YT, Wang R, Shu XO, Tsuji I, Kuriyama S, Tanaka H, Satoh H, Chen CJ, Yuan JM, Yoo KY, Ahsan H, Pan WH, Gu D, Pednekar MS, Sauvaget C, Sasazuki S, Sairenchi T, Yang G, Xiang YB, Nagai M, Suzuki T, Nishino Y, You SL, Koh WP, Park SK, Chen Y, Shen CY, Thornquist M, Feng Z, Kang D, Boffetta P, Potter JD. Association between body-mass index and risk of death in more than 1 million Asians. N Engl J Med 2011;364:719-729.
- 13. Holyday M, Daniells S, Bare M, Caplan GA, Petocz P, Bolin T. Malnutrition screening and early nutrition intervention in hospitalised patients in acute aged care: a randomised controlled trial. J Nutr Health Aging 2012;16:562-568.
- 14. WHO Expert Consultation. Appropriate body-mass index for Asian populations and its implications for policy and intervention strategies. Lancet 2004;363:157-163.
- 15. Baek S, Piao J, Jin Y, Lee SM. Validity of the Morse Fall Scale implemented in an electronic medical record system. J Clin Nurs 2014;23:2434-2440.
- 16. Morse JM, Morse RM, Tylko SJ. Development of a scale to identify the fall prone. Can J Aging 1989;8:366-377.
- 17. Adly NN, Abd-El-Gawad WM, Abou-Hashem RM. Relationship between malnutrition and different fall risk assessment tools in a geriatric in-patient unit. Aging Clin Exp Res 2020;32:1279-1287.
- 18. Bauer JD, Isenring E, Torma J, Horsley P, Martineau J. Nutritional status of patients who have fallen in an acute care setting. J Hum Nutr Diet 2007;20:558-564.
- 19. Naseri C, Haines TP, Etherton-Beer C, McPhail S, Morris ME, Flicker L, Netto J, Francis-Coad J, Lee DA, Shorr R, Hill AM. Reducing falls in older adults recently discharged from hospital: a systematic review and meta-analysis. Age Ageing 2018;47:512-519.
- 20. Neyens J, Halfens R, Spreeuwenberg M, Meijers J, Luiking Y, Verlaan G, Schols J. Malnutrition is associated with an increased risk of falls and impaired activity in elderly patients in Dutch residential long-term care (LTC): a cross-sectional study. Arch Gerontol Geriatr 2013;56:265-269.
- 21. Schaap LA, van Schoor NM, Lips P, Visser M. Associations of sarcopenia definitions, and their components, with the incidence of recurrent falling and fractures: the longitudinal aging study Amsterdam. J Gerontol A Biol Sci Med Sci 2018;73:1199-1204.
- 22. Vandewoude MF, Alish CJ, Sauer AC, Hegazi RA. Malnutrition-sarcopenia syndrome: is this the future of nutrition screening and assessment for older adults? J Aging Res 2012;2012:651570.
- 23. Gazibara T, Kurtagic I, Kisic-Tepavcevic D, Nurkovic S, Kovacevic N, Gazibara T, Pekmezovic T. Falls, risk factors and fear of falling among persons older than 65 years of age. Psychogeriatrics 2017;17:215-223.
- 24. Trevisan C, Crippa A, Ek S, Welmer AK, Sergi G, Maggi S, Manzato E, Bea JW, Cauley JA, Decullier E, Hirani V, LaMonte MJ, Lewis CE, Schott AM, Orsini N, Rizzuto D. Nutritional status, body mass index, and the risk of falls in community-dwelling older adults: a systematic review and meta-analysis. J Am Med Dir Assoc 2019;20:569-582.e7.
- 25. Felder S, Lechtenboehmer C, Bally M, Fehr R, Deiss M, Faessler L, Kutz A, Steiner D, Rast AC, Laukemann S, Kulkarni P, Stanga Z, Haubitz S, Huber A, Mueller B, Schuetz P. Association of nutritional risk and adverse medical outcomes across different medical inpatient populations. Nutrition 2015;31:1385-1393.
- 26. Mueller C, Compher C, Ellen DM. American Society for Parenteral and Enteral Nutrition (A.S.P.E.N.) Board of Directors. A.S.P.E.N. clinical guidelines: Nutrition screening, assessment, and intervention in adults. JPEN J Parenter Enteral Nutr 2011;35:16-24.
- 27. Thibault R, Abbasoglu O, Ioannou E, Meija L, Ottens-Oussoren K, Pichard C, Rothenberg E, Rubin D, Siljamäki-Ojansuu U, Vaillant MF, Bischoff SC. ESPEN guideline on hospital nutrition. Clin Nutr 2021;40:5684-5709.
- 28. Wesley JR. Nutrition support teams: past, present, and future. Nutr Clin Pract 1995;10:219-228.
- 29. Seol EM, Suh YS, Ju DL, Bae HJ, Kim E, Lee HJ. Nutrition support team reconsultation during nutrition therapy in Korea. JPEN J Parenter Enteral Nutr 2021;45:357-365.
- 30. Centers for Disease Control and Prevention (CDC). National center for chronic disease prevention and health promotion. 2021. cited 2021 July 21. Available from https://www.cdc.gov/chronicdisease/about/index.htm
- 31. Korea Institute for Health and Social Affairs. 2017 National Survey of Older Koreans: Findings and Implications. 2018. cited 2018 January. Available from https://www.kihasa.re.kr/publish/report/view?type=all&seq=29648
- 32. O’Connell ML, Coppinger T, Lacey S, Arsenic T, McCarthy AL. The nutritional status and dietary intake of free-living seniors: a cross-sectional study. Clin Nutr ESPEN 2021;43:478-486.
- 33. Chung E, Lee SH, Lee HJ, Kim YH. Comparative study of young-old and old-old people using functional evaluation, gait characteristics, and cardiopulmonary metabolic energy consumption. BMC Geriatr 2023;23:400.
- 34. Sung YH, Cho MS, Kwon IG, Jung YY, Song MR, Kim K, Won S. Evaluation of falls by inpatients in an acute care hospital in Korea using the Morse Fall Scale. Int J Nurs Pract 2014;20:510-517.
- 35. Porter Starr KN, McDonald SR, Bales CW. Nutritional vulnerability in older adults: a continuum of concerns. Curr Nutr Rep 2015;4:176-184.
- 36. Kaiser MJ, Bauer JM, Rämsch C, Uter W, Guigoz Y, Cederholm T, Thomas DR, Anthony PS, Charlton KE, Maggio M, Tsai AC, Vellas B, Sieber CC. Mini Nutritional Assessment International Group. Frequency of malnutrition in older adults: a multinational perspective using the mini nutritional assessment. J Am Geriatr Soc 2010;58:1734-1738.
- 37. Chen CC, Bai YY, Huang GH, Tang ST. Revisiting the concept of malnutrition in older people. J Clin Nurs 2007;16:2015-2026.
- 38. O’Shea E, Trawley S, Manning E, Barrett A, Browne V, Timmons S. Malnutrition in hospitalised older adults: a multicentre observational study of prevalence, associations and outcomes. J Nutr Health Aging 2017;21:830-836.
- 39. Vanderwee K, Clays E, Bocquaert I, Verhaeghe S, Lardennois M, Gobert M, Defloor T. Malnutrition and nutritional care practices in hospital wards for older people. J Adv Nurs 2011;67:736-746.
- 40. Akirov A, Masri-Iraqi H, Atamna A, Shimon I. Low albumin levels are associated with mortality risk in hospitalized patients. Am J Med 2017;130:1465.e11-1465.e19.
- 41. Ogliari G, Ryg J, Andersen-Ranberg K, Scheel-Hincke LL, Masud T. Association between body mass index and falls in community-dwelling men and women: a prospective, multinational study in the Survey of Health, Ageing and Retirement in Europe (SHARE). Eur Geriatr Med 2021;12:837-849.
- 42. Deandrea S, Bravi F, Turati F, Lucenteforte E, La Vecchia C, Negri E. Risk factors for falls in older people in nursing homes and hospitals. A systematic review and meta-analysis. Arch Gerontol Geriatr 2013;56:407-415.
- 43. Morley JE, Anker SD, von Haehling S. Prevalence, incidence, and clinical impact of sarcopenia: facts, numbers, and epidemiology-update 2014. J Cachexia Sarcopenia Muscle 2014;5:253-259.
- 44. Healey F, Monro A, Cockram A, Adams V, Heseltine D. Using targeted risk factor reduction to prevent falls in older in-patients: a randomised controlled trial. Age Ageing 2004;33:390-395.
- 45. World Health Organization. WHO global report on falls prevention in older age. 2007. cited 2008 March 17. Available from https://www.who.int/publications/i/item/9789241563536
- 46. Nassar N, Helou N, Madi C. Predicting falls using two instruments (the Hendrich Fall Risk Model and the Morse Fall Scale) in an acute care setting in Lebanon. J Clin Nurs 2014;23:1620-1629.
- 47. Silva SO, Barbosa JB, Lemos T, Oliveira LA, Ferreira AS. Agreement and predictive performance of fall risk assessment methods and factors associated with falls in hospitalized older adults: a longitudinal study. Geriatr Nurs 2023;49:109-114.
- 48. Park JH, Kim E, Seol EM, Kong SH, Park DJ, Yang HK, Choi JH, Park SH, Choe HN, Kweon M, Park J, Choi Y, Lee HJ. Prediction model for screening patients at risk of malnutrition after gastric cancer surgery. Ann Surg Oncol 2021;28:4471-4481.
- 49. Locher JL, Roth DL, Ritchie CS, Cox K, Sawyer P, Bodner EV, Allman RM. Body mass index, weight loss, and mortality in community-dwelling older adults. J Gerontol A Biol Sci Med Sci 2007;62:1389-1392.
- 50. Dramé M, Dia PA, Jolly D, Lang PO, Mahmoudi R, Schwebel G, Kack M, Debart A, Courtaigne B, Lanièce I, Blanchard F, Novella JL. Factors predictive of long-term mortality in patients aged 75 years or older hospitalized from the emergency department: the SAFES cohort. Presse Med 2009;38:1068-1075.


