ABSTRACT
A diet rich in proinflammatory components and inflammation are suggested to be significant risk factors for multiple sclerosis (MS). This study aimed to investigate the association between the risk of MS and the inflammatory potential of an individual’s diet and dietary diversity through pro-inflammatory/anti-inflammatory food intake score (PAIFIS) and dietary diversity score (DDS). In a hospital-based case–control study, 397 participants, including 197 patients with MS and 200 healthy participants aged over 18 years, were evaluated. The history of smoking, dietary intake, and anthropometric characteristics, including body mass index, waist circumference, total body fat, and fat-free mass were assessed. A validated 160-item semiquantitative food frequency questionnaire was used to calculate the PAIFIS and DDS scores. The mean age of the participants was 32.45 ± 8.66 years, and most were females (274, 79.4%). The PAIFIS score was significantly higher among MS patients than healthy participants (p = 0.001). Between PAIFIS and DDS, only PAFIS was significantly related to MS risk (odds ratio, 1.002; 95% confidence interval, 1.001–1.004; p = 0.001). PAIFIS, as an index of dietary inflammation, can predict MS. Further studies are needed to document these findings.
-
Keywords: Multiple sclerosis; Diet records; Micronutrients
INTRODUCTION
Multiple sclerosis (MS) is an inflammatory, neurodegenerative autoimmune disease of the central nervous system. It is traditionally viewed as a two-stage MS, with early inflammation responsible for relapsing–remitting disease and delayed neurodegeneration causing non-relapsing progression, i.e., secondary and primary progressive MS [
1]. MS affects young adults, especially women aged 20–40 years [
2]. There is an increasing trend in the incidence and prevalence of MS in developed and developing countries [
1]. It is estimated that approximately 2.8 million people worldwide have MS [
3]. According to the international MS prevalence categorization, Iran is located in a low-risk region for this disease (5–25 cases per 100,000 individuals); however, the prevalence of MS reaches 35.5–51.9 cases per 100,000 individuals in the central areas of the country [
4].
MS is characterized by demyelination in the brain and spinal cord, which is influenced by acute and chronic inflammation. Therefore, modulation of milieu inflammation can be a protective factor against the occurrence, symptoms, and progression of MS [
5]. As a modifiable factor, dietary patterns are closely related to the incidence of MS and its complications [
6]. A diet rich in antioxidant and anti-inflammatory components (fresh fruits and raw and cooked vegetables) can prevent inflammation in the body. A diet rich in proinflammatory components (red meat, processed meat, sugar, candies, and snacks) can induce the production of inflammatory factors [
7]. There are several indices to evaluate the dietary inflammatory load [
8]. The pro-inflammatory/anti-inflammatory food intake score (PAIFIS) is among the recently validated indices [
9]. PAIFIS is a potential marker to determine the inflammatory load through a food frequency questionnaire (FFQ) [
9].
In addition to the Western pattern (high in red and processed meats, sweets and desserts, French fries, and refined grains), which directly contributes to increased body inflammation, increasing calorie intake and obesity can indirectly increase inflammation levels [
10,
11,
12]. Furthermore, micronutrient malnutrition affects the incidence, progression, and improvement of MS [
13]. The dietary diversity score (DDS) is useful in assessing and predicting inadequate micronutrient intake [
14]. This definition of food diversity is commonly used to assess individuals' dietary habits and patterns. This is calculated by summing the number of foods or food groups consumed during this time [
15].
Regardless of the current global interest in MS, there is a shortage of scientific evidence regarding the course of the disease, its symptomatology, and the relationship between dietary patterns and the incidence of MS [
16]. To our knowledge, this is the first study evaluating the relationship between PAIFIS, DDS, and odds of developing MS. We hypothesized that individuals with higher dietary inflammation (higher PAIFIS scores) and lower dietary diversity (lower DDS) may have increased odds of MS. Elucidating the role of overall dietary quality, rather than individual foods or nutrients, is essential for establishing lifestyle recommendations to reduce MS risk. Therefore, the novelty of this research lies in its simultaneous investigation into how dietary inflammation and diversity are associated with MS susceptibility. The study provides new evidence regarding the relationship between PAIFIS and DDS, two understudied diet quality indices, with MS odds. The findings may motivate further research and carry implications for nutritional guidelines targeting MS prevention.
MATERIALS AND METHODS
The objective of this study was to examine the correlation between an individual's risk of developing MS and the inflammatory potential of their diet, as well as their level of dietary diversity using the PAIFIS and DDS. The research received approval from the Research Committee of the Mashhad University of Medical Sciences, Iran. The study adheres to the principles outlined in the Declaration of Helsinki. All participants provided written informed consent before participating in this study. This study was carried out with the approval of the Ethics Committee of Mashhad University of Medical Sciences (IR.MUMS.REC.1393.182), and all personal information about participants will be kept secure in a database.
Study design and participants
This case–control study involved 197 patients with relapsing-remitting MS aged between 18 and 65 years. These patients were selected from the Mashhad MS Association Registry in Northeast Iran 2015. The research population included newly registered MS patients who had not changed their diet in the past six months. Additionally, 200 healthy individuals without neurological diseases were selected for the control group based on specific criteria. These criteria included being from the same hospital as the cases, having no acute medical conditions unrelated to pregnancy, and not having long-term dietary modifications. The control group was matched with the case group based on age (in 10-year groups), sex, education level, and body mass index (BMI). The participants were given a brief explanation of how to answer the questions in the FFQ. The researchers recorded the names, age, height, weight, body composition, gender, menopause, smoking habits, and educational status of the participants.
The exclusion criteria for both groups were as follows: (1) following a specific diet in the last year, (2) taking any food supplements, and (3) under- or overestimation of energy intake (< 800 or > 4,200 kcal/day). All participants provided written informed consent by completing and signing a consent form.
Sample size
A sample size formula was used to determine the necessary sample size in correlation studies. In a survey by Jahromi et al., the correlation coefficient between the traditional diet tertile score and the risk of MS was 0.27, considered as effect size for sample size calculation [
6].
Demographic data
The skilled interviewers gathered information regarding the participants' demographics and smoking habits while ensuring accuracy and attention to detail.
Anthropometric measurements
Trained healthcare professionals used the Centers for Disease Control and Prevention's Anthropometry Procedures Manual 2007 to record accurate anthropometric measurements of each individual who participated in the National Health and Nutrition Examination Survey [
17]. The participants' body composition and weight were measured while wearing minimal clothing and no shoes. To obtain data, a bioelectrical impedance analyzer (Tanita BC-418 Body Composition Analyzer) was used and recorded to the nearest 100 g. Their height was measured in a standing position without shoes using a tape measure with shoulders in a normal position, and the data were recorded to the nearest 0.5 cm. The waist circumference (WC) was measured twice at a level midway between the lowest rib and iliac crest using a flexible tape, and the recorded data were to the nearest millimeter. BMI was calculated using the formula: weight in kilograms divided by height in meters squared. The subjects were then classified based on their BMI using the cutoff points determined by the World Health Organization and categorized as underweight (< 18.5 kg/m
2), healthy weight (18.5–24.9 kg/m
2), overweight (25–29.9 kg/m
2), or obese (≥ 30 kg/m
2).
Assessment of dietary intake
The study evaluated the participants' dietary habits using a semiquantitative FFQ, containing 160 Iranian food items. The FFQ was developed and validated by Mashhad University of Medical Sciences [
18]. The participants completed the FFQ during face-to-face interviews with expert dietitians. The experts confirmed the household portions using photographs to ensure accurate measurement of food intake. The average food intake was determined based on the typical portion sizes consumed by the general Iranian population. Standard units were created using the average serving sizes of everyday food items such as a bowl of yogurt and chips, a glass of beverage, or a plate of rice. A food photo album with ten pictures depicting the average portion sizes and household measures was presented at the beginning of the FFQ to ensure consistency. Participants were asked about the frequency of their consumption of various food items in the past month. Their responses were categorized into four groups: never/less than once a month, monthly (1–3 times/month), weekly (1–6 times/week), and daily (1–6 times/day or more). Portion sizes were classified as small (less than half of the persistent moderate use), medium (equal to the determined average use), and large (one and a half times more than the moderate use or more). The frequency of consuming each food was recorded and converted to daily intake, while the serving size of the consumed items was converted to grams using household measures. The researchers asked these questions neutrally, without judging the participants' eating habits.
To determine DDS, we divided foods into five main groups: grains, vegetables, fruits, meats, and dairy products, according to the Food Guide Pyramid [
19]. The main groups mentioned were divided into 23 subgroups. Seven of the groups reflected bread and grain-based products, and seven categories of vegetables were included. There were also two primary categories of fruits and juices, four groups of meat products (meat, fish, poultry, eggs), and three groups of dairy products—these groups constituted the remaining 23 categories. These categories show the dietary diversity across the groups of the food guide pyramid. For a respondent to be considered a "consumer" of any of the food group categories, they needed to have consumed at least half a serving per the quantity criteria outlined in the Food Guide Pyramid at some point during the two-day period of the survey. Each of the five broad food categories received a maximum diversity score of 2 out of the ten possible score points, and the total score was the sum of the scores of the five main groups [
20].
Most previous studies have used the Dietary Inflammatory Index to evaluate the dietary inflammatory load by assessing dietary data collected from 24-hour dietary recall interviews [
8]. The PAIFIS is among the recently validated indices [
9]. The PAIFIS was calculated using subjective assessment tools to evaluate food consumption using a FFQ. The grams of pro-inflammatory (∑PI) and anti-inflammatory (∑AI) food profiles were added together for each participant. Finally, the ∑AI value was subtracted from the ∑PI value to determine each participant'snet sum of pro-inflammatory foods [
9].
The Statistical Package for Social Sciences (SPSS) software version 22 (IBM SPSS Statistics for Windows, Version 21.0; IBM Corp., Armonk, NY, USA). The Kolmogorov–Smirnov test was used to evaluate the normality of continuous variables. Continuous variables with a normal distribution are presented as the mean and standard deviation (SD), and nonnormally distributed variables are presented as the median and interquartile range (IQR). Categorical variables are presented using frequencies and percentages. Comparison of continuous variables between study groups was performed using the Mann–Whitney test, while the comparison of the distribution pattern of categorical variables between groups was performed using the chi-square test. The relationship between study variables and MS was evaluated using binary logistic regression. The level of statistical significance was p < 0.05.
RESULTS
A total of 397 participants, including 197 (49.6%) patients with MS and 200 (50.4%) healthy participants, were included in this study. The mean age of the participants was 32.45 ± 8.66 years, and the majority of the participants were female (274, 79.4%). A comparison of the demographic and anthropometric characteristics between MS patients and healthy participants is shown in
Table 1. Patients with MS had a significantly higher total body fat percentage (p = 0.031) and lower fat-free mass (p < 0.001), and the prevalence of smoking was significantly higher in MS patients than in healthy participants (p = 0.01).
Table 1 Comparison of demographic and anthropometric characteristics between MS patients and healthy participants
Table 1
|
Variables |
MS |
Healthy |
p value |
|
Age (yr) |
32.00 (27.00–37.25) |
31.00 (26.00–37.00) |
0.296*
|
|
Weight (kg) |
64.15 (55.38–73.03) |
66.22 ± 14.39 |
0.556*
|
|
Height (cm) |
162.00 (157.00–168.00) |
160.00 (156.00–167.00) |
0.100*
|
|
BMI (kg/m2) |
24.20 (21.10–27.43) |
24.70 (21.60–29.00) |
0.245*
|
|
Waist circumference (cm) |
83.41 ± 12.70 |
82.00 (72.00–92.00) |
0.551*
|
|
Total body fat (%) |
28.80 ± 7.86 |
27.30 (19.90–33.90) |
0.031*,†
|
|
Fat free mass (%) |
40.80 (36.58–47.13) |
45.30 (42.00–51.40) |
< 0.001*,†
|
|
Sex |
|
|
0.395‡
|
|
Male |
39 (22.4) |
32 (18.7) |
|
Female |
135 (77.6) |
139 (81.3) |
|
Smoking |
40 (23.1) |
16 (9.4) |
0.001†,‡
|
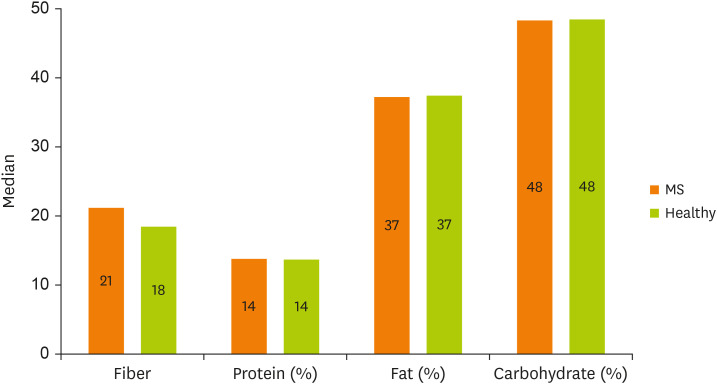
The median and IQR for energy intake of the MS patients were 2,508.25 (1,843.91–3,037.13), and the mean and SD for energy intake of the healthy participants were 2,233.03 ± 837.29. There was a significant difference in terms of energy intake between the MS patients and healthy participants based on the Mann–Whitney test (p = 0.003). The percentage of energy from protein, fat and carbohydrates and the grams of fiber intake among MS patients and healthy participants are presented in
Figure 1. There was no significant difference in the percentage of energy from proteins (p = 0.522), fat (p = 0.885), carbohydrates (p = 0.753), or fiber intake (p = 0.056).
Figure 1
Median energy percentage from protein, fat, and carbohydrate as well as fiber intake (g) among MS patients and healthy participants.
MS, multiple sclerosis.

Table 2 presents the DDS and PAIFIS scores of the MS patients and healthy participants are compared in
Table 2. There was only a significant difference in the PAIFIS score between MS patients and healthy participants (p = 0.001), indicating that the PAIFIS score was significantly higher among MS patients than among healthy participants.
Table 2 Comparison of DDS and PAIFIS scores between MS patients and healthy participants
Table 2
|
Variables |
MS |
Healthy |
p value*
|
|
DDS |
6.86 (5.43, 7.79) |
6.81 ± 1.32 |
0.339 |
|
PAIFIS |
−268.55 (−518.66, 104.81) |
−382.20 (−625.04, 202.46) |
0.001†
|
The relationships between the study variables and MS are shown in
Table 3. There was a significant relationship between male sex (p < 0.001), smoking (p = 0.013), WC (p = 0.025), body fat (p = 0.015) and fat-free mass (p < 0.001) percentages, fiber intake (p = 0.014), PAIFIS score (p = 0.001) and MS. These findings indicate that male sex and smoking were associated with a 49.857- and 30.018-fold increased risk of MS, respectively, and for a one-percent increase in body fat, a one-gram increase in fiber intake and a one-point increase in PAIFIS score were associated with a 1.105-, 1.069-, and 1.002-fold increase in the risk of MS, respectively. A one-percent increase in fat-free mass was associated with a 0.222-fold reduction in the risk of MS.
Table 3 Relationship between study variables and multiple sclerosis
Table 3
|
Variables |
p value |
OR |
95% CI for OR |
|
Lower |
Upper |
|
Age |
0.305 |
0.980 |
0.943 |
1.019 |
|
Sex (male) |
< 0.001*
|
49.857 |
12.627 |
196.858 |
|
Smoking |
0.013*
|
30.018 |
1.265 |
7.198 |
|
BMI |
0.417 |
0.948 |
0.833 |
1.079 |
|
Waist circumference |
0.025*
|
1.065 |
1.008 |
1.125 |
|
Body fat (%) |
0.015*
|
1.105 |
1.020 |
1.197 |
|
Fat free mass (%) |
< 0.001*
|
0.778 |
0.724 |
0.836 |
|
Energy intake |
0.176 |
1.000 |
1.000 |
1.001 |
|
Fiber |
0.014*
|
1.069 |
1.014 |
1.013 |
|
Protein (% cal) |
0.082 |
1.211 |
0.976 |
1.503 |
|
Fat (% cal) |
0.483 |
1.058 |
0.903 |
1.241 |
|
Carbohydrate (% cal) |
0.220 |
1.049 |
0.972 |
1.133 |
|
DDS |
0.765 |
0.962 |
0.748 |
1.238 |
|
PAIFIS |
0.001*
|
1.002 |
1.001 |
1.004 |
DISCUSSION
The dietary and lifestyle behaviors of the MS population have not undergone comprehensive scrutiny due to the expected challenges in collecting reliable retrospective data. Despite numerous scientific investigations into the correlation between MS and nutrition, there is no agreement on the appropriate dietary practices for improving disease progression and symptoms [
21]. A diet rich in antioxidant and anti-inflammatory components can prevent inflammation in the body, and a diet rich in proinflammatory components can produce inflammatory factors [
7]. In the current study, we found that the risk of MS was higher among individuals with a higher dietary inflammatory load, which was defined by a higher PAIFIS score. This means that individuals who consume more proinflammatory food groups, such as sugar-sweetened beverages, processed meat, red meat, candies, and snacks, and fewer anti-inflammatory food groups, such as fruits and vegetables (F/V), may have an increased risk of MS. Additionally, individuals with a higher total body fat percentage, higher WC, and lower fat-free mass were also more likely to have MS. To the best of our knowledge, this is one of the first studies reporting the association between DDSs and the risk of MS. However, the current study did not find a significant relationship between the risk of MS and the DDS score. An explanation for this outcome is that a higher DDS is linked to greater energy consumption and thus may be linked to the development of obesity [
22]. Therefore, it is recommended to focus on increasing the diversity score for healthy food groups such as vegetables and whole grains.
According to Keykhaei et al., [
2] consuming a diet rich in fruits, vegetables, salads, stews, bread, and low-fat dairy can lower the risk of MS. Additionally, Saeedirad et al. [
23] found that a higher intake of plant-based protein can reduce the risk of MS. In contrast, food items with high levels of saturated fatty acids were linked to a greater risk of MS than those rich in fiber. Additionally, previous studies mentioned that plant-based diets with antioxidant components correlated with a lower MS risk [
6,
24]. A case–control study conducted in Iran using an interview-based approach reported that individuals who consumed higher amounts of F/V, typical components of the Mediterranean diet, had a significantly reduced risk of developing MS [
25]. F/V are good sources of flavonoids, plant sterols, carotenoids, vitamins, minerals, and other antioxidants [
26]. Considering the anti-inflammatory content of F/V, the findings of these studies can be attributed to the anti-inflammatory content of the diet.
The anti-inflammatory properties of flavonoids are achieved through various mechanisms, including inhibiting regulatory enzymes and transcription factors that significantly control inflammation mediators. Flavonoids are also potent antioxidants that can scavenge free radicals and reduce their formation, significantly impacting immune cells and immune mechanisms involved in the inflammatory process. For example, flavonoids have been shown to suppress the maturation markers CD80 and CD86, which are essential for CD4+ T-cell activation, leading to an inhibitory effect on cytokine secretion and the proliferative response of CD4+ T cells [
27,
28,
29,
30]. CD4+ and CD8+ T cells are present in MS lesions, with CD4+ T cells being predominant in acute lesions and CD8+ T cells more frequently observed in chronic lesions, contributing to the progression of autoimmunity and cardiovascular disease. The success of several T-cell-targeted therapies further reinforces the importance of T cells in MS pathogenesis, and inhibiting the formation of CD4+ CTLs could slow the progression of MS [
31,
32]. Despite these results, some articles reported that vegetables and fruits have no significant correlation with having MS and its complications [
8,
33]. Unlike F/V, which have anti-inflammatory properties, consuming high amounts of red meat, processed meat, saturated or trans-fat, and ultra-processed foods made from refined ingredients or alcohol have been linked to pro-inflammatory processes and increased inflammatory cytokines [
29]. Researchers revealed that the prevalence of MS was higher in a dietary pattern high in animal fats, meat products, and sugars [
21,
34].
Although there is inconsistency regarding the role of diet in the etiology of MS, a healthy dietary pattern and certain nutrients have generally been associated with a decreased risk of MS. Moreover, chronic inflammation could trigger the development of MS. Another emerging hypothesis for the preventive effects of food items against MS is host immune response regulation, which includes the role of gut commensal microorganisms and their ability to elicit proinflammatory responses [
35]. Intestinal dysbiosis, where the Firmicutes pathogenic bacteria become the predominant gut microbiota [
36], provokes intestinal endotoxemia by lipopolysaccharides, intestinal inflammation, and low-grade chronic systemic inflammation. These changes have been linked to increased BMI [
37].
As evidenced by a systematic review, the best-designed studies investigating body composition looked at three anthropometric measures: BMI, lean body mass, and body fat amount [
38]. In this study, WC and percent body fat were related to the risk of MS (odds ratio [OR], 1.065; 95% confidence interval [CI], 1.008–1.125; p = 0.025 and OR, 1.105; 95% CI, 1.02–1.197; p = 0.015, respectively), and an inverse relationship was noted between MS risk and fat-free mass (OR, 0.77; 95% CI, 0.72–0.83; p = 0.001). Weight excess may aggravate the physical and mental health of MS patients [
39]. High BMI and WC may exacerbate these symptoms [
40] by triggering insulin resistance [
41], intensifying the proliferation of T helper 17 cells [
42], oxidative stress, and the production of inflammatory cytokines [
43].
The role of sex is of utmost importance in the development, progression, and treatment of MS [
44]. The effect of sex on the clinical course of MS is uncertain and complex to evaluate. There are some confounders, such as the age of onset and whether the disease is progressive from onset. Another confounder in evaluating the effect of sex is that the outcome and the severity of MS can be assessed differently. Commonly used measures include the time to reach different levels of disability and the time of development of progressive MS [
45]. Similar to the previous literature, MS was more prevalent in women in our study [
46]. In contrast, the regression analysis indicated that male sex was a risk factor for MS. This discrepancy might be due to the small number of male participants in this study.
Early case–control studies have shown that a history of smoking as an environmental factor could play a role in MS susceptibility [
47,
48]. After that, numerous case–control, and population cohort investigations have been conducted, with a nearly unanimous consensus that smoking tobacco products heightens vulnerability to MS [
49,
50,
51,
52,
53,
54]. Furthermore, findings from studies conducted in New Zealand propose that smoking habits could contribute to the latitudinal pattern of MS susceptibility in that region [
55]. Consistent with these findings, our study revealed a correlation between smoking and an elevated likelihood of developing MS (OR, 30.01; 95% CI, 1.26–7.19; p = 0.013).
Although previous studies have shown a protective effect of dietary fiber against MS [
56], a positive association was observed between fiber intake and the odds of MS in the current study (OR, 1.069; 95% CI, 1.014–1.012; p = 0.014). However, despite the role of individual nutrients, it is essential to note that many unidentified compounds exist in different foods and potential interactions between the nutrients. Therefore, dietary pattern analysis seems more reasonable than evaluating individual nutrients or foods [
57]. Dietary diversity, as one of the characteristics of a healthy diet, represents the consumption of various food items within and between food groups [
58].
In addition to reports indicating a positive association between DDS and macro- and micronutrient intake [
22,
59], multiple research studies have indicated a negative correlation between the DDS and chronic illnesses, including metabolic syndrome, cardiovascular diseases, hypertension, and cancer [
60,
61,
62]. However, this study, did not find any significant association between DDS and the incidence of MS. This finding might be related to the changes MS patients have made in their dietary habits after the diagnosis.
Based on the findings of this study, PAIFIS could be a dietary predictor for MS. Therefore, dietary recommendations should include food sources that increase PAIFIS scores. In terms of dietary diversity, the findings of our study could not find a relationship between DDS and MS. Having a diverse diet is a general nutrition recommendation. However, as a higher DDS is associated with higher energy intake [
22] and obesity [
63], it is essential to emphasize that the recommendation to increase dietary diversity is associated with considering energy intake. Increasing the diversity score for healthy food groups such as vegetables and whole grains is better.
One of the limitations of the current study is that it only explored dietary diversity as one aspect of lifestyle and did not evaluate other nutritional behaviors, such as the timing and frequency of meals and snacks, which are crucial in predicting dietary patterns. Additionally, the result of dietary diversity assessment may vary significantly depending on the target population, with discrepancies reported across races, cultures, and geographical regions. It is suggested that future studies assess eating behaviors, snack consumption, and meal patterns and that a longitudinal study be conducted on this topic [
64]. Moreover, the possibility of recall bias in evaluating dietary patterns by FFQ assessment should not be overlooked [
65].
It is also important to note that potential confounding variables, such as Epstein–Barr virus infection, Drug use, and sun exposure on the incidence of MS, were not evaluated and adjusted in this study. This study indicated that dietary inflammation could influence MS development. However, further longitudinal research is warranted to establish temporal relationships between the intake of specific food groups and nutrients and the uncidence of MS. Potential confounders like vitamin D status and Ebstein-Barr virus infection should be addressed in further studies. The current study did not include the disability level, disease duration, and physical activity among MS patients due to financial and time restrictions. Therefore, it is suggested that further studies evaluate the relationship between dietary intakes and MS with regard to disease state, severity, disability, and physical activity. While this study builds on previous diet-MS associations, objective nutritional biomarkers are preferable to minimize recall bias. More extensive studies adjusting for all confounders are imperative to clarify diet-MS connections for translation to nutritional recommendations and clinical practice.
CONCLUSION
In conclusion, we demonstrated that subjects with a higher PAIFIS had a higher risk for MS. However, we found no significant association between the DDS and MS risk. More observational research would be needed, including cross-sectional and cohort studies seeking to investigate these interactions. Given the worldwide role of diet in general population health, improving nutritional patterns through educational programs will likely reduce MS risk.
Mashhad University of Medical Scienceshttps://doi.org/10.13039/501100004748
930169
NOTES
-
Funding: This research was supported by grants from the Mashhad University of Medical Sciences of Iran (grant number: 930169).
-
Conflict of Interest: The authors declare that they have no competing interests.
-
Author Contributions:
Conceptualization: Nematy M, Hatami A, Ahmadi-khorram M.
Data curation: Keykhaei F.
Formal analysis: Jafarzadeh-Esfehani A.
Investigation: Keykhaei F, Hatami A, Ahmadi-khorram M.
Methodology: Nematy M, Jafarzadeh-Esfehani A.
Project administration: Keykhaei F, Hatami A, Ahmadi-khorram M.
Supervision: Nematy M, Jafarzadeh-Esfehani A.
Writing - original draft: Hatami A, Ahmadi-khorram M.
Writing – review & editing: Jafarzadeh-Esfehani A.
ACKNOWLEDGEMENTS
The authors would like to thank the participation of all individuals for their assistance in this research project.
REFERENCES
- 1. Dobson R, Giovannoni G. Multiple sclerosis - a review. Eur J Neurol 2019;26:27-40.
- 2. Keykhaei F, Norouzy S, Froughipour M, Nematy M, Saeidi M, Jarahi L, Amiri F, Malek Ahmadi M, Norouzy A. Adherence to healthy dietary pattern is associated with lower risk of multiple sclerosis. J Cent Nerv Syst Dis 2022;14:11795735221092516.
- 3. Walton C, King R, Rechtman L, Kaye W, Leray E, Marrie RA, Robertson N, La Rocca N, Uitdehaag B, van der Mei I, Wallin M, Helme A, Angood Napier C, Rijke N, Baneke P. Rising prevalence of multiple sclerosis worldwide: insights from the atlas of MS, third edition. Mult Scler 2020;26:1816-1821.
- 4. Bagheri M, Maghsoudi Z, Fayazi S, Elahi N, Tabesh H, Majdinasab N. Several food items and multiple sclerosis: a case-control study in Ahvaz (Iran). Iran J Nurs Midwifery Res 2014;19:659-665.
- 5. Saul AM, Taylor BV, Blizzard L, Simpson-Yap S, Oddy WH, Shivappa N, Hébert JR, Black LJ, Ponsonby AL, Broadley SA, Lechner-Scott J, van der Mei I, Lucas RM, Dear K, Dwyer T, Broadley S, Kilpatrick T, Williams D, Shaw C, Chapman C, Coulthard A, Pender MP, Valery P. Ausimmune/AusLong Investigators. A pro-inflammatory diet in people with multiple sclerosis is associated with an increased rate of relapse and increased FLAIR lesion volume on MRI in early multiple sclerosis: a prospective cohort study. Mult Scler 2023;29:1012-1023.
- 6. Jahromi SR, Toghae M, Jahromi MJ, Aloosh M. Dietary pattern and risk of multiple sclerosis. Iran J Neurol 2012;11:47-53.
- 7. Stoiloudis P, Kesidou E, Bakirtzis C, Sintila SA, Konstantinidou N, Boziki M, Grigoriadis N. The role of diet and interventions on multiple sclerosis: a review. Nutrients 2022;14:1150.
- 8. da Costa Silva BY, de Carvalho Sampaio HA, Shivappa N, Hebert JR, da Silva Albuquerque L, Carioca AA, D’Almeida JA, Maia CS, de Melo ML. Dietary inflammatory index and clinical course of multiple sclerosis. Eur J Clin Nutr 2019;73:979-988.
- 9. Azevedo-Garcia LG, Torres-Leal FL, Aristizabal JC, Berg G, Carvalho HB, De Moraes AC. Reliability and validity estimate of the pro-inflammatory/anti-inflammatory food intake score in South American pediatric population: SAYCARE study. Int J Environ Res Public Health 2023;20:1038.
- 10. Saghafi-Asl M, Mirmajidi S, Asghari Jafarabadi M, Vahid F, Shivappa N, Hébert JR, Ebrahimzadeh Attari V. The association of dietary patterns with dietary inflammatory index, systemic inflammation, and insulin resistance, in apparently healthy individuals with obesity. Sci Rep 2021;11:7515.
- 11. Lucas M, Chocano-Bedoya P, Schulze MB, Mirzaei F, O’Reilly ÉJ, Okereke OI, Hu FB, Willett WC, Ascherio A. Inflammatory dietary pattern and risk of depression among women. Brain Behav Immun 2014;36:46-53.
- 12. Barbaresko J, Koch M, Schulze MB, Nöthlings U. Dietary pattern analysis and biomarkers of low-grade inflammation: a systematic literature review. Nutr Rev 2013;71:511-527.
- 13. Khosravi-Largani M, Pourvali-Talatappeh P, Rousta AM, Karimi-Kivi M, Noroozi E, Mahjoob A, Asaadi Y, Shahmohammadi A, Sadeghi S, Shakeri S, Ghiyasvand K, Tavakoli-Yaraki M. A review on potential roles of vitamins in incidence, progression, and improvement of multiple sclerosis. eNeurologicalSci 2018;10:37-44.
- 14. Zhao W, Yu K, Tan S, Zheng Y, Zhao A, Wang P, Zhang Y. Dietary diversity scores: an indicator of micronutrient inadequacy instead of obesity for Chinese children. BMC Public Health 2017;17:440.
- 15. Kong W, Jiang T, Ning Y, Guo Y, Liu H, Lyu X, Li M. Dietary diversity, diet quality, and oxidative stress in older adults. Geriatr Nurs 2022;48:158-163.
- 16. Marck CH, Probst Y, Chen J, Taylor B, van der Mei I. Dietary patterns and associations with health outcomes in Australian people with multiple sclerosis. Eur J Clin Nutr 2021;75:1506-1514.
- 17. Centers for Disease Control and Prevention. National Health and Nutrition Examination Survey (NHANES): anthropometry procedures manual. Atlanta, GA: Centers for Disease Control and Prevention; 2007.
- 18. Ghazizahedi S, Nouri M, Norouzy A, Nemati M, Safarian M, Mohajeri SAR, Esmaeely H, Shalaie N. Scientific: validity and reproducibility of Iranian food frequency questionnaire. Nutr Food Sci Res 2014;1:16.
- 19. Nachvak SM, Abdollahzad H, Mostafai R, Moradi S, Pasdar Y, Rezaei M, Esksndari S. Dietary diversity score and its related factors among employees of Kermanshah University of Medical Sciences. Clin Nutr Res 2017;6:247-255.
- 20. Kant AK, Block G, Schatzkin A, Ziegler RG, Nestle M. Dietary diversity in the US population, NHANES II, 1976–1980. J Am Diet Assoc 1991;91:1526-1531.
- 21. Esposito S, Bonavita S, Sparaco M, Gallo A, Tedeschi G. The role of diet in multiple sclerosis: a review. Nutr Neurosci 2018;21:377-390.
- 22. Foote JA, Murphy SP, Wilkens LR, Basiotis PP, Carlson A. Dietary variety increases the probability of nutrient adequacy among adults. J Nutr 2004;134:1779-1785.
- 23. Saeedirad Z, Ariyanfar S, Noormohammadi M, Ghorbani Z, Naser Moghadasi A, Shahemi S, Ghanaatgar M, Rezaeimanesh N, Hekmatdoost A, Ghaemi A, Razeghi Jahromi S. Higher dietary acid load might be a potent derivative factor for multiple sclerosis: the results from a case-control study. Nutrients 2023;15:3311.
- 24. Shivappa N, Hebert JR, Behrooz M, Rashidkhani B. Dietary inflammatory index and risk of multiple sclerosis in a case-control study from Iran. Neuroepidemiology 2016;47:26-31.
- 25. Sedaghat F, Jessri M, Behrooz M, Mirghotbi M, Rashidkhani B. Mediterranean diet adherence and risk of multiple sclerosis: a case-control study. Asia Pac J Clin Nutr 2016;25:377-384.
- 26. World Health Organization. Increasing fruit and vegetable consumption to reduce the risk of noncommunicable diseases [Internet]. 2023. cited 2023 August 9. Available from https://www.who.int/tools/elena/interventions/fruit-vegetables-ncds
- 27. Li Y, Yu Q, Zhao W, Zhang J, Liu W, Huang M, Zeng X. Oligomeric proanthocyanidins attenuate airway inflammation in asthma by inhibiting dendritic cells maturation. Mol Immunol 2017;91:209-217.
- 28. Lin W, Wang W, Wang D, Ling W. Quercetin protects against atherosclerosis by inhibiting dendritic cell activation. Mol Nutr Food Res 2017;61:1700031.
- 29. Maleki SJ, Crespo JF, Cabanillas B. Anti-inflammatory effects of flavonoids. Food Chem 2019;299:125124.
- 30. Masilamani M, Wei J, Bhatt S, Paul M, Yakir S, Sampson HA. Soybean isoflavones regulate dendritic cell function and suppress allergic sensitization to peanut. J Allergy Clin Immunol 2011;128:1242-1250.e1.
- 31. Peeters LM, Vanheusden M, Somers V, Van Wijmeersch B, Stinissen P, Broux B, Hellings N. Cytotoxic CD4+ T cells drive multiple sclerosis progression. Front Immunol 2017;8:1160.
- 32. Chitnis T. The role of CD4 T cells in the pathogenesis of multiple sclerosis. Int Rev Neurobiol 2007;79:43-72.
- 33. Rotstein DL, Cortese M, Fung TT, Chitnis T, Ascherio A, Munger KL. Diet quality and risk of multiple sclerosis in two cohorts of US women. Mult Scler 2019;25:1773-1780.
- 34. Azary S, Schreiner T, Graves J, Waldman A, Belman A, Guttman BW, Aaen G, Tillema JM, Mar S, Hart J, Ness J, Harris Y, Krupp L, Gorman M, Benson L, Rodriguez M, Chitnis T, Rose J, Barcellos LF, Lotze T, Carmichael SL, Roalstad S, Casper CT, Waubant E. Contribution of dietary intake to relapse rate in early paediatric multiple sclerosis. J Neurol Neurosurg Psychiatry 2018;89:28-33.
- 35. Ochoa-Repáraz J, Kirby TO, Kasper LH. The gut microbiome and multiple sclerosis. Cold Spring Harb Perspect Med 2018;8:a029017.
- 36. Riccio P, Rossano R. Nutrition facts in multiple sclerosis. ASN Neuro 2015;7:1759091414568185.
- 37. Riccio P. The molecular basis of nutritional intervention in multiple sclerosis: a narrative review. Complement Ther Med 2011;19:228-237.
- 38. Wens I, Dalgas U, Stenager E, Eijnde BO. Risk factors related to cardiovascular diseases and the metabolic syndrome in multiple sclerosis - a systematic review. Mult Scler 2013;19:1556-1564.
- 39. Oliveira SR, Simão AN, Kallaur AP, de Almeida ER, Morimoto HK, Lopes J, Dichi I, Kaimen-Maciel DR, Reiche EM. Disability in patients with multiple sclerosis: influence of insulin resistance, adiposity, and oxidative stress. Nutrition 2014;30:268-273.
- 40. Jelinek GA, De Livera AM, Marck CH, Brown CR, Neate SL, Taylor KL, Weiland TJ. Associations of lifestyle, medication, and socio-demographic factors with disability in people with multiple sclerosis: an international cross-sectional study. PLoS One 2016;11:e0161701.
- 41. Altowaijri G, Fryman A, Yadav V. Dietary interventions and multiple sclerosis. Curr Neurol Neurosci Rep 2017;17:1-10.
- 42. Endo Y, Yokote K, Nakayama T. The obesity-related pathology and Th17 cells. Cell Mol Life Sci 2017;74:1231-1245.
- 43. Hagan KA, Munger KL, Ascherio A, Grodstein F. Epidemiology of major neurodegenerative diseases in women: contribution of the nurses’ health study. Am J Public Health 2016;106:1650-1655.
- 44. Greer JM, McCombe PA. Role of gender in multiple sclerosis: clinical effects and potential molecular mechanisms. J Neuroimmunol 2011;234:7-18.
- 45. Amato MP, Ponziani G. A prospective study on the prognosis of multiple sclerosis. Neurol Sci 2000;21:S831-S838.
- 46. Hammond SR, de Wytt C, Maxwell IC, Landy PJ, English D, McLeod JG, McCall MG. The epidemiology of multiple sclerosis in Queensland, Australia. J Neurol Sci 1987;80:185-204.
- 47. Thorogood M, Hannaford PC. The influence of oral contraceptives on the risk of multiple sclerosis. Br J Obstet Gynaecol 1998;105:1296-1299.
- 48. Antonovsky A, Leibowitz U, Smith HA, Medalie JM, Balogh M, Kats R, Halpern L, Alter M. Epidemiologic study of multiple sclerosis in Israel: I. An overall review of methods and findings. Arch Neurol 1965;13:183-193.
- 49. Carlens C, Hergens MP, Grunewald J, Ekbom A, Eklund A, Höglund CO, Askling J. Smoking, use of moist snuff, and risk of chronic inflammatory diseases. Am J Respir Crit Care Med 2010;181:1217-1222.
- 50. Hedström AK, Bäärnhielm M, Olsson T, Alfredsson L. Tobacco smoking, but not Swedish snuff use, increases the risk of multiple sclerosis. Neurology 2009;73:696-701.
- 51. Jafari N, Hoppenbrouwers IA, Hop WC, Breteler MM, Hintzen RQ. Cigarette smoking and risk of MS in multiplex families. Mult Scler 2009;15:1363-1367.
- 52. Silva KRP, Alvarenga RMP, Fernandez y Fernandez O, Alvarenga H, Thuler LCS. Potential risk factors for multiple sclerosis in Rio de Janeiro: a case-control study. Arq Neuropsiquiatr 2009;67:229-234.
- 53. Rodríguez Regal A, del Campo Amigo M, Paz-Esquete J, Martínez Feijoo A, Cebrián E, Suárez Gil P, Mouriño MA. A case-control study of the influence of the smoking behaviour in multiple sclerosis. Neurologia 2009;24:177-180.
- 54. Russo C, Morabito F, Luise F, Piromalli A, Battaglia L, Vinci A, Trapani Lombardo V, de Marco V, Morabito P, Condino F, Quattrone A, Aguglia U. Hyperhomocysteinemia is associated with cognitive impairment in multiple sclerosis. J Neurol 2008;255:64-69.
- 55. Fowles J, Christophersen A, Fernando D, Lea R, Woodward A, Dickson S, Hosking M, Berezowski R. Secondhand tobacco smoke exposure in New Zealand bars: results prior to implementation of the bar smoking ban. N Z Med J 2006;119:U1931.
- 56. Ghadirian P, Jain M, Ducic S, Shatenstein B, Morisset R. Nutritional factors in the aetiology of multiple sclerosis: a case-control study in Montreal, Canada. Int J Epidemiol 1998;27:845-852.
- 57. Slattery ML. Analysis of dietary patterns in epidemiological research. Appl Physiol Nutr Metab 2010;35:207-210.
- 58. Ruel MT. Is dietary diversity an indicator of food security or dietary quality? A review of measurement issues and research needs. Food Nutr Bull 2003;24:231-232.
- 59. Arimond M, Wiesmann D, Becquey E, Carriquiry A, Daniels MC, Deitchler M, Fanou-Fogny N, Joseph ML, Kennedy G, Martin-Prevel Y, Torheim LE. Simple food group diversity indicators predict micronutrient adequacy of women’s diets in 5 diverse, resource-poor settings. J Nutr 2010;140:2059S-2069S.
- 60. McCullough ML, Feskanich D, Stampfer MJ, Giovannucci EL, Rimm EB, Hu FB, Spiegelman D, Hunter DJ, Colditz GA, Willett WC. Diet quality and major chronic disease risk in men and women: moving toward improved dietary guidance. Am J Clin Nutr 2002;76:1261-1271.
- 61. Fernandez E, Negri E, La Vecchia C, Franceschi S. Diet diversity and colorectal cancer. Prev Med 2000;31:11-14.
- 62. Miller WL, Crabtree BF, Evans DK. Exploratory study of the relationship between hypertension and diet diversity among Saba Islanders. Public Health Rep 1992;107:426-432.
- 63. Raynor HA, Epstein LH. Dietary variety, energy regulation, and obesity. Psychol Bull 2001;127:325-341.
- 64. Tseng M.. Validation of dietary patterns assessed with a food-frequency questionnaire. Am J Clin Nutr 1999;70:422.
- 65. Melamed A, Robinson JN. Case-control studies can be useful but have many limitations: study design: case-control studies. BJOG 2019;126:23.

 , Maryam Ahmadi-khorram1