ABSTRACT
Patients with colorectal cancer may experience symptoms such as diarrhea, nausea, and anorexia, during surgery and chemotherapy, which can increase the risk of malnutrition. In addition, dietary habits play a key role in the onset of colorectal cancer; therefore, it is necessary to improve dietary habits to prevent recurrence during treatment after diagnosis. In this study, a clinical nutritionist conducted 4 interviews for patients diagnosed with colorectal cancer and scheduled for colectomy: before surgery, after surgery, 1st chemotherapy, and 2nd chemotherapy, and provided nutrition care for each treatment course to determine its effects on nutrition status and disease prognosis. Significant weight loss but no decrease in muscle mass was observed during treatment. Body fat mass, although not statistically significant, showed a decreasing tendency. The percentage of people who responded ‘yes’ to the below items increased after compared to before receiving nutrition education: ‘I eat meat or eggs more than 5 times a week,’ ‘I eat seafood at least three times a week,’ ‘I eat vegetables at every meal,’ ‘I eat fruits every day,’ and ‘I eat milk or dairy products every day.’ These results indicate that the patients changed their dietary habit from a monotonous eating pattern to a pattern of consuming various food groups after receiving nutrition education. These results suggest that continuous nutrition care by clinical dietitians, according to the patient’s treatment process, can help improve the patient's nutritional status and establish healthy eating habits.
-
Keywords: Colorectal cancer; Clinical dietitian; Dietary habit; Body composition; Nutritional management
INTRODUCTION
According to the National Cancer Registry Statistics published by the National Cancer Center and Ministry of Health and Welfare in 2021, colorectal cancer has the second highest incidence rate among gastrointestinal cancers following stomach cancer [
1]. A recent study in the United States reported that the incidence of colorectal cancer in individuals below 50 years was the highest in Korea among 42 countries, with an average annual increase of 4.2% in this age group [
2]. Recently, mortality rate of most cancer types has shown a decreasing trend, however, the rate is slower for colorectal cancer than for gastric, liver, and lung cancers in men. In addition, colorectal cancer has been reported as the leading cause of death following lung and liver cancers [
1].
The treatment methods for colorectal cancer include chemotherapy, surgery, and radiation therapy, with surgical treatment being the primary method. In such cases, adjuvant chemotherapy is generally performed for microscopic tumors that may persist after surgical treatment [
3]. Patients with cancer may suffer from malnutrition before diagnosis, and the risk of malnutrition may increase depending on the stage of cancer progression [
4]. Patients with colorectal cancer experience various symptoms such as diarrhea, constipation, and dyspepsia after colectomy [
5]. In particular, patients receiving chemotherapy after surgery may present symptoms of nausea, vomiting, anorexia, and weight loss along with an increased risk of malnutrition [
6].
Nutritional status of patients with cancer is a major factor contributing to the recovery and prevention of complications, and considering that malnutrition can act as a major cause of death in such patients, it is important to detect nutritional problems and improve nutritional health of patients at an early stage to prevent nutrition-related complications [
7]. According to the report ‘Diet, Nutrition, Physical Activity, and Colorectal Cancer’ published by the World Cancer Research Fund (WCRF), the consumption of alcohol, processed meat, and red meat has been reported to be the main factor responsible for the increased risk of colorectal cancer [
8]. Dietary habits play a role in the onset of colorectal cancer, and therefore, it is necessary to improve eating habits to prevent its recurrence after diagnosis.
Previous studies have investigated the nutritional status of patients with solid tumors undergoing chemotherapy [
9,
10,
11] and surgery [
12,
13]. However, few studies have evaluated the nutritional status of patients with solid tumors who received adjuvant chemotherapy after surgery and underwent nutritional interventions at each stage during surgery and chemotherapy.
Therefore, this study aimed to investigate whether appropriate nutritional interventions for each treatment stage of colorectal cancer patients undergoing surgery and chemotherapy can help reduce nutritional problems and adhere healthy eating habits. In addition, the effect of nutritional intervention by clinical dietitians was determined based on changes in body composition, biochemical analysis, nutrient intake, and patient-generated subjective global assessment (PG-SGA) score.
MATERIALS AND METHODS
Recruitment of research patients
We recruited patients diagnosed with colorectal cancer and scheduled for colectomy from September 1, 2022 to February 20, 2023. The lead researcher personally interviewed the research patients, explained them about the research objective and investigation items, and obtained their informed consent to participate ensuring confidentiality of personal data, moreover, the patients were promised that they can leave the study at any time according to their will, and that their unwillingness to participate would not affect their treatment.
Consent form was obtained from patients who agreed to participate in the study. Patients with a history of dementia or mental illness were excluded from the study considering difficulty in evaluating the effect of nutrition education and counseling in such patients. The patients were recruited after receiving approval from the Institutional Review Board (IRB) of Chungnam National University Hospital. Nutrition interventions used during the study are shown in
Figure 1, and investigation items are shown in
Table 1. Information about sex, age, marital status, family history of colorectal cancer, disease stage, and surgical method used for the patients was obtained by referring to medical records. Stage classification was performed using the TNM classification of the American Joint Committee on Cancer.
Figure 1Nutrition interventions during the study.
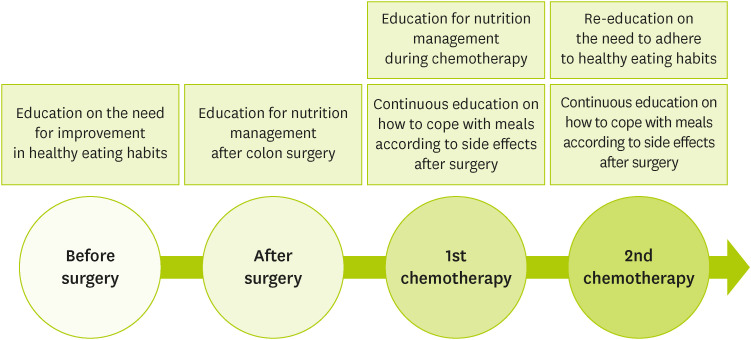
Table 1Investigation items during the study
Table 1
|
Period |
Before surgery |
After surgery |
1st chemotherapy |
2nd chemotherapy |
|
Visits |
Visit 1 (Admission) |
Visit 2 (Admission) |
Visit 3 (Admission/Outpatient) |
Visit 4 (Admission/Outpatient) |
|
Weeks (day) |
Day 0 |
Day 4 |
4 weeks ± 7 days |
6 weeks ± 7 days |
|
Written consent*
|
■ |
|
|
|
|
Investigation of medical and treatment history†
|
■ |
|
|
|
|
Demographic survey‡
|
■ |
|
|
|
|
Body composition testing§
|
■ |
■ |
■ |
■ |
|
Biochemical analysisll
|
■ |
■ |
■ |
■ |
|
Evaluation of inclusion/exclusion criteria |
■ |
|
|
|
|
Eating habits survey |
■ |
|
|
■ |
|
Nutritional assessment through PG-SGA |
■ |
|
|
■ |
|
Nutrient intake assessment |
■ |
■ |
■ |
■ |
|
Physical symptoms experienced¶ during treatment |
■ |
■ |
■ |
■ |
|
Recognition of importance of nutrition education and utilization of education resources |
|
■ |
|
■ |
Measurement of body composition
Changes in the body composition of patients were measured four times (before surgery, after surgery, 1st chemotherapy, 2nd chemotherapy) during the study period using body composition analyzers InBody Dial (for portable use) and InBody 270 (InBody Co., Ltd., Seoul, Korea) based on the principle of bioelectrical impedance analysis (BIA). BIA is easy to perform, noninvasive, and proven technique in terms of objectivity, reliability, and validity [
14].
A body fat mass of 25% or more in men and 30% or more in women was considered ‘excess body fat mass’ [
15]. According to the guidelines of the Korean Society for Obesity, patients were classified as underweight if their p is less than 18.5 kg/m
2, normal at body mass index (BMI) of 18.5–22.9 kg/m
2, overweight at BMI of 23.0–24.9 kg/m
2, and obese at BMI of 25.0 kg/m
2 [
16].
The presence or absence of symptoms experienced by the patients was investigated through interviews conducted 4 times during the study period (before surgery, after surgery, 1st chemotherapy, 2nd chemotherapy) and medical records. Symptoms included constipation, diarrhea, weight loss, anorexia, sensation of residual stool, abdominal discomfort, nausea and vomiting, dyspepsia, anal pain, abdominal pain, bloody and frequent stool. As the symptoms experienced by patients may vary depending on the treatment process, multiple responses were made for this survey item.
Nutritional assessment
The nutritional status was evaluated using the scored PG-SGA, which is widely used nutritional evaluation tool for patients with cancer [
17]. PG-SGA uses simple questions, allowing easy evaluation of nutritional status of patients through interviews and based on clinical symptoms, and it is particularly useful for investigating nutritional health improvement based on the scored results [
18]: less than 2 points was classified as good, 2–3 points as malnutrition level 1, 4–8 points as malnutrition level 2, and 9 or more points as malnutrition level 3.
The National Cancer Information Center’s ‘My Diet Evaluation Table’ was used for dietary habit survey [
19]. The first survey was conducted based on usual eating habits before surgery, and the second survey was conducted on the same survey paper during 2nd chemotherapy to observe changes in eating behavior during the treatment period. Nutrient intake was evaluated throughout the entire 4th interview stage, and daily dietary history was investigated using a 24-hour recall method, followed by nutritional analysis using the Can Pro 5.0 (web version) of the Korean Nutrition Society (Seoul, Korea).
Hemoglobin, total protein, albumin, white blood cell (WBC), lymphocyte, sodium (Na), potassium (K), and chlorine (Cl) contents were determined during biochemical analysis. Hemoglobin level decreases under conditions such as malnutrition, bone marrow failure, and hemorrhage, and total protein and albumin levels decrease when the body’s inflammatory response increases. The WBC count increases during infection and neoplastic disease and decreases during malnutrition and in patients undergoing chemotherapy and radiotherapy. Lymphocyte count is an indicator of different conditions, including cancer chemotherapy, radiation therapy, and trauma. Malnutrition is indicated if lymphocyte count is less than 1,500 cells/mm
3. Na, K, and Cl may fluctuate in cases of dysregulation of body water, diarrhea, vomiting, or dehydration [
20].
The patients were inquired about the source of nutrition-related information—‘TV programs,’ ‘SNS (YouTube),’ ‘specialty publication, ‘Specialists in hospitals (doctors, nurses, clinical dietitian)’. Education needs were surveyed for 2 times (before surgery, 2nd chemotherapy), and the degree of utilization of nutrition education resources was investigated during the last (4th) interview (2nd chemotherapy). The patients were asked to directly check the relevant questions in the questionnaire, and the degree of application of nutrition education was evaluated as ‘not applied at all,’ ‘almost not applied,’ ‘normally,’ ‘applied a little,’ ‘applied a lot’ on a 5-point scale.
Statistical analysis
The data were analyzed using the Statistical Package for the Social Sciences (SPSS) (version 25.0; IBM Corp., Armonk, NY, USA) program. Frequency analysis was conducted to identify the general characteristics of the study patients, and a descriptive statistical analysis was conducted to identify the level of research variables. A χ2 test was conducted to identify differences in anthropometric values, including sex, symptoms experienced during treatment, PG-SGA score, and eating habits, according to the treatment process. A paired sample t-test was conducted to verify the difference in the perception of the importance of nutrition education after surgery and after chemotherapy. Analysis of variance (ANOVA) was conducted to determine differences in body composition, nutrient intake, and biochemical parameters depending on the treatment process. Statistical significance was set at a significance level of 5% for the above analyses, and the sample size was calculated using G*Power 3.1.9, at significance level (α value) 0.05, power 0.9, and effect size 0.25; number of samples calculated by setting the effect size to 0.25 was 30 persons.
RESULT
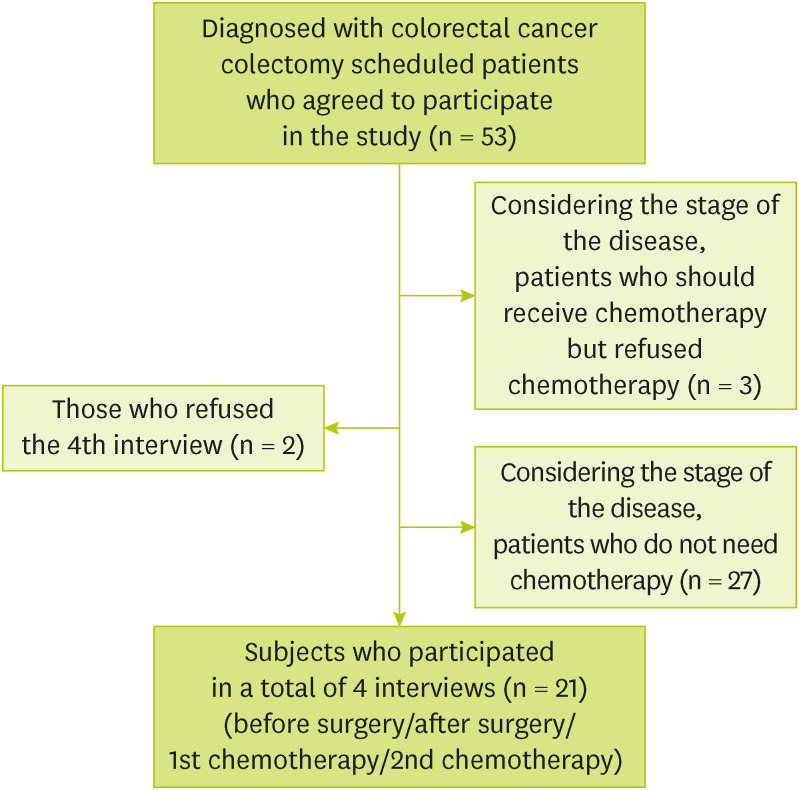
Among a total of 53 patients, 3 patients who refused chemotherapy despite the need for adjuvant chemotherapy based on the stage of the disease, 27 patients who did not require adjuvant chemotherapy based on the stage of the disease, and 2 patients who refused to participate in the 4th interview (2nd chemotherapy) were excluded. A total of 21 patients participated in all four interviews (
Figure 2). The general characteristics and anthropometric values of 53 patients were analyzed (before surgery). For each item of the treatment process, analysis was performed on 21 patients who participated in all four interviews (before surgery, after surgery, 1st chemotherapy, 2nd chemotherapy).
Figure 2 Recruitment of research subjects.
General characteristics
There were 13 male (61.9%) and 8 female (38.1%) patients. As for age, there were 9 patients in the age group 50–59 years (42.0%), 6 patients in the age group 60–69 years (28.5%), and 7 patients were ≥ 70 years old (28.5%), with an average age of 62.61 years old. Regarding marital status, 19 (90.5%) were married, 2 (9.5%) were divorced. A family history of colorectal cancer was present in 3 patients (14.3%) and absent in 18 patients (85.7%). The disease stage 2 in 3 patients (14.3%), stage 3 in 12 patients (57.1%), stage 4 in 6 patients (28.6%). The surgical methods used were laparoscopic low anterior resection in 12 patients (57.0%), left hemicolectomy in 2 (9.5%), right hemicolectomy in 2 (9.5%), robotic low anterior resection of the rectum in 2 (23.0%) (
Table 2). The average weight was 63.62 kg, the average muscle mass was 23.68 kg, the average fat mass was 31.29 kg, and the average BMI was 25.3 kg/m
2 (
Table 3).
Table 2General characteristics of research subjects (n = 21)
Table 2
|
Factor |
Classification |
No. (%) |
|
Sex |
Male |
13 (61.9) |
|
Female |
8 (38.1) |
|
Age (yr) |
40–49 |
0 (0.0) |
|
50–59 |
9 (42.0) |
|
60–69 |
6 (28.5) |
|
≥ 70 |
6 (28.5) |
|
Mean ± Standard deviation |
62.61 ± 8.16 |
|
Marital status |
Married |
19 (90.5) |
|
Unmarried |
0 (0.0) |
|
Bereaved |
0 (0.0) |
|
Divorced |
2 (9.5) |
|
Family history of colorectal cancer |
Present |
3 (14.3) |
|
Absent |
18 (85.7) |
|
Disease stage |
Stage 0 |
0 (0.0) |
|
Stage 1 |
0 (0.0) |
|
Stage 2 |
3 (14.3) |
|
Stage 3 |
12 (57.1) |
|
Stage 4 |
6 (28.6) |
|
Surgical method |
Low anterior resection |
12 (57.0) |
|
Left hemicolectomy |
2 (9.5) |
|
Right hemicolectomy |
2 (9.5) |
|
Low anterior resection of rectum |
5 (23.0) |
|
All |
21 (100.0) |
Table 3Body measurements at 1st interview (before surgery) (n = 21)
Table 3
|
Measurements |
Minimum value |
Maximum value |
Average |
Standard deviation |
|
Weight (kg) |
48.6 |
91.5 |
66.2 |
11.13 |
|
Muscle mass (kg) |
17.7 |
32.3 |
24.5 |
4.31 |
|
Fat mass (%) |
15.3 |
52.1 |
31.7 |
9.27 |
|
BMI (kg/m2) |
20.4 |
37.6 |
25.3 |
3.98 |
Comparison of symptoms experienced during treatment
The symptoms experienced during treatment was shown in
Table 4. Weight loss was 47.6% before surgery, 14.3% after surgery, 4.8% at 1st chemotherapy, and 14.3% at 2nd chemotherapy (χ
2 = 13.791, p < 0.01). Vomiting incidence gradually increased to 9.5% after surgery, 23.8% at 1st chemotherapy, and 38.1% at 2nd chemotherapy (χ
2 = 11.930, p < 0.01), and dyspepsia showed a gradual decrease from 23.8% before surgery to 4.8% after surgery (χ
2 = 12.205, p < 0.01). The incidence of abdominal pain gradually decreased from 19.0% before surgery to 9.5% after surgery (χ
2 = 7.897, p < 0.05). Bloody stools were present in 52.4% before surgery and none after surgery (χ
2 = 37.973, p < 0.001). Patients with absence of symptoms showed a gradual increase in number with 47.6% after surgery, 38.1% at 1st chemotherapy, and 47.6% at 2nd chemotherapy (χ
2 = 14.571, p < 0.01).
Table 4Comparison of symptoms experienced during treatment (n = 21)
Table 4
|
Symptom |
Classification |
Before surgery |
After surgery |
1st chemo-therapy |
2nd chemo-therapy |
χ2 (p) |
|
Constipation |
No |
14 (66.7) |
19 (90.5) |
19 (90.5) |
18 (85.7) |
5.829 (0.120) |
|
Yes |
7 (33.3) |
2 (9.5) |
2 (9.5) |
3 (14.3) |
|
Diarrhea |
No |
17 (81.0) |
21 (100.0) |
20 (95.2) |
20 (95.2) |
6.462 (0.091) |
|
Yes |
4 (19.0) |
0 (0.0) |
1 (4.8) |
1 (4.8) |
|
Weight loss |
No |
11 (52.4) |
18 (85.7) |
20 (95.2) |
18 (85.7) |
13.791** (0.003) |
|
Yes |
10 (47.6) |
3 (14.3) |
1 (4.8) |
3 (14.3) |
|
Anorexia |
No |
17 (81.0) |
19 (90.5) |
15 (71.4) |
17 (81) |
2.471 (0.481) |
|
Yes |
4 (19.0) |
2 (9.5) |
6 (28.6) |
4 (19) |
|
Sensation of incomplete evacuation of stool |
No |
20 (95.2) |
20 (95.2) |
21 (100.0) |
21 (100.0) |
2.049 (0.562) |
|
Yes |
1 (4.8) |
1 (4.8) |
0 (0.0) |
0 (0.0) |
|
Abdominal discomfort |
No |
21 (100.0) |
20 (95.2) |
21 (100) |
21 (100) |
3.036 (0.386) |
|
Yes |
0 (0.0) |
1 (4.8) |
0 (0.0) |
0 (0.0) |
|
Nausea and vomiting |
No |
21 (100.0) |
19 (90.5) |
16 (76.2) |
13 (61.9) |
11.930** (0.008) |
|
Yes |
0 (0.0) |
2 (9.5) |
5 (23.8) |
8 (38.1) |
|
Dyspepsia |
No |
16 (76.2) |
20 (95.2) |
21 (100.0) |
21 (100.0) |
12.205** (0.007) |
|
Yes |
5 (23.8) |
1 (4.8) |
0 (0.0) |
0 (0.0) |
|
Anal pain |
No |
20 (95.2) |
20 (95.2) |
21 (100.0) |
21 (100.0) |
2.049 (0.562) |
|
Yes |
1 (4.8) |
1 (4.8) |
0 (0.0) |
0 (0.0) |
|
Abdominal pain |
No |
17 (81.0) |
19 (90.5) |
21 (100.0) |
21 (100.0) |
7.897* (0.048) |
|
Yes |
4 (19.0) |
2 (9.5) |
0 (0.0) |
0 (0.0) |
|
Bloody stool |
No |
10 (47.6) |
21 (100.0) |
21 (100.0) |
21 (100.0) |
37.973*** (< 0.001) |
|
Yes |
11 (52.4) |
0 (0.0) |
0 (0.0) |
0 (0.0) |
|
Frequent stool |
No |
19 (90.5) |
17 (81.0) |
19 (90.5) |
18 (85.7) |
1.151 (0.765) |
|
Yes |
2 (9.5) |
4 (19.0) |
2 (9.5) |
3 (14.3) |
|
No symptoms |
No |
21 (100.0) |
11 (52.4) |
13 (61.9) |
11 (52.4) |
14.571** (0.002) |
|
Yes |
0 (0.0) |
10 (47.6) |
8 (38.1) |
10 (47.6) |
|
All |
21 (100.0) |
21 (100.0) |
21 (100.0) |
21 (100.0) |
|
Nutritional assessment and comparison of eating habits
the differences in the PG-SGA scores depending on the treatment process revealed no statistically significant differences in PG-SGA scores according to the measurement period (
Table 5). Eating habits before and after providing nutrition education to patients were shown in
Table 6. The percentage of ‘yes’ responses was higher after than that before providing education for the following items: ‘I eat 3 side dishes excluding soup and kimchi at mealtime.’ (χ
2 = 6.000, p < 0.05), ‘I don’t overeat.’ (χ
2 = 9.882, p < 0.01), ‘I eat a well-balanced diet that considers nutrients.’ (χ
2 = 22.444, p < 0.001), ‘I eat meat or eggs more than 5 times a week.’ (χ
2 = 7.855, p < 0.05), ‘I eat seafood (fish, squid, shellfish, etc.) more than 3 times a week.’ (χ
2 = 9.133, p < 0.05), ‘I eat vegetables (except kimchi), seaweed, and mushrooms at every meal.’ (χ
2 = 12.128, p < 0.01), ‘I eat fruit every day.’ (χ
2 = 8.018, p < 0.05), ‘I eat milk or dairy products (yogurt, cheese) every day.’ (χ
2 = 12.145, p < 0.01), ‘I feel the food is salty when I eat out.’ (χ
2 = 8.476, p < 0.05). ‘I eat salty foods such as salted fish and pickled vegetables every day.’ (χ
2 = 8.133, p < 0.05), ‘I like to eat hot food.’ (χ
2 = 10.738, p < 0.01), ‘I eat fatty meats (pork belly, ribs, etc.) at least once every 3 days.’ (χ
2 = 21.000, p < 0.001), ‘I go to a charcoal grill or a meat restaurant at least once.’ (χ
2 = 18.828, p < 0.001), ‘I eat processed meat foods (ham, bacon, sausage, etc.), ramen, or instant food three or more times a week.’ appeared (
Table 6).
Table 5Differences in PG-SGA level according to the treatment process (n = 21)
Table 5
|
Variables |
Classification |
Before surgery |
2nd chemotherapy |
χ2 (p) |
|
PG-SGA |
Normal |
0 (0.0) |
2 (9.5) |
4.130 (0.248) |
|
Malnutrition stage 1 |
6 (28.6) |
7 (33.3) |
|
Malnutrition stage 2 |
9 (42.9) |
10 (47.6) |
|
Malnutrition stage 3 |
6 (28.6) |
2 (9.5) |
|
All |
21 (100.0) |
21 (100.0) |
|
Table 6Comparison of eating habits before and after providing nutrition education (n = 21)
Table 6
|
Question |
Before education |
After education |
χ2 (p) |
|
I eat 3 meals a day 5 or more times a week. |
|
|
5.792 (0.055) |
|
No |
4 (19.0) |
2 (9.5) |
|
Sometimes |
4 (19.0) |
0 (0.0) |
|
Yes |
13 (61.9) |
19 (90.5) |
|
My meal intake takes an average of 10 minutes. |
|
|
0.159 (0.924) |
|
No |
6 (28.6) |
6 (28.6) |
|
Sometimes |
4 (19) |
5 (23.8) |
|
Yes |
11 (52.4) |
10 (47.6) |
|
I eat 3 side dishes excluding soup and kimchi. |
|
|
6.000* (0.050) |
|
No |
5 (23.8) |
0 (0.0) |
|
Sometimes |
6 (28.6) |
6 (28.6) |
|
Yes |
10 (47.6) |
15 (71.4) |
|
I don't overeat. |
|
|
9.882** (0.007) |
|
No |
5 (23.8) |
0 (0) |
|
Sometimes |
3 (14.3) |
0 (0) |
|
Yes |
13 (61.9) |
21 (100) |
|
I eat a well-balanced diet that considers nutrients. |
|
|
22.444*** (< 0.001) |
|
No |
8 (38.1) |
0 (0) |
|
Sometimes |
8 (38.1) |
1 (4.8) |
|
Yes |
5 (23.8) |
20 (95.2) |
|
I eat multigrain rice almost every day. |
|
|
0.525 (0.769) |
|
No |
7 (33.3) |
8 (38.1) |
|
Sometimes |
6 (28.6) |
4 (19) |
|
Yes |
8 (38.1) |
9 (42.9) |
|
I eat meat or eggs 5 or more times a week. |
|
|
7.855* (0.020) |
|
No |
2 (9.5) |
1 (4.8) |
|
Sometimes |
12 (57.1) |
4 (19) |
|
Yes |
7 (33.3) |
16 (76.2) |
|
I eat seafood (fish, squid, shellfish, etc.) at least 3 times a week. |
|
|
9.133* (0.010) |
|
No |
10 (47.6) |
2 (9.5) |
|
Sometimes |
9 (42.9) |
11 (52.4) |
|
Yes |
2 (9.5) |
8 (38.1) |
|
I eat vegetables (except kimchi), seaweed, and mushrooms at every meal. |
|
|
12.128** (0.002) |
|
No |
10 (47.6) |
1 (4.8) |
|
Sometimes |
7 (33.3) |
7 (33.3) |
|
Yes |
4 (19.0) |
13 (61.9) |
|
I eat fruit every day. |
|
|
8.018* (0.018) |
|
No |
7 (33.3) |
2 (9.5) |
|
Sometimes |
6 (28.6) |
2 (9.5) |
|
Yes |
8 (38.1) |
17 (81.0) |
|
I eat milk or dairy products (yogurt, cheese) every day. |
|
|
12.145** (0.002) |
|
No |
7 (33.3) |
2 (9.5) |
|
Sometimes |
11 (52.4) |
5 (23.8) |
|
Yes |
3 (14.3) |
14 (66.7) |
|
When I eat out, I feel that the food is salty. |
|
|
8.476* (0.014) |
|
No |
7 (33.3) |
0 (0.0) |
|
Sometimes |
8 (38.1) |
13 (61.9) |
|
Yes |
6 (28.6) |
8 (38.1) |
|
I don't eat badly burnt parts. |
|
|
1.024 (0.311) |
|
No |
0 (0.0) |
0 (0.0) |
|
Sometimes |
0 (0.0) |
1 (4.8) |
|
Yes |
21 (100.0) |
20 (95.2) |
|
I don't eat moldy food. |
|
|
- |
|
No |
0 (0.0) |
0 (0.0) |
|
Sometimes |
0 (0.0) |
0 (0.0) |
|
Yes |
21 (100.0) |
21 (100.0) |
|
I eat salty foods such as salted fish and pickled vegetables every day. |
|
|
8.133* (0.017) |
|
No |
11 (52.4) |
19 (90.5) |
|
Sometimes |
6 (28.6) |
2 (9.5) |
|
Yes |
4 (19.0) |
0 (0.0) |
|
I like to eat hot food. |
|
|
10.738** (0.005) |
|
No |
7 (33.3) |
17 (81.0) |
|
Sometimes |
10 (47.6) |
4 (19.0) |
|
Yes |
4 (19.0) |
0 (0.0) |
|
I eat fatty meats (pork belly, ribs, etc.) at least once every 3 days. |
|
|
21.000*** (< 0.001) |
|
No |
7 (33.3) |
21 (100.0) |
|
Sometimes |
6 (28.6) |
0 (0.0) |
|
Yes |
8 (38.1) |
0 (0.0) |
|
I go to a charcoal grill or a meat restaurant at least once. |
|
|
18.828*** (< 0.001) |
|
No |
8 (38.1) |
21 (100.0) |
|
Sometimes |
9 (42.9) |
0 (0.0) |
|
Yes |
4 (19.0) |
0 (0.0) |
|
I eat processed meat foods (ham, bacon, sausage, etc.), ramen, or instant food three or more times a week. |
|
|
7.152* (0.028) |
|
No |
13 (61.9) |
20 (95.2) |
|
Sometimes |
5 (23.8) |
1 (4.8) |
|
Yes |
3 (14.3) |
0 (0.0) |
|
I eat sweet foods (ice cream, cake, snacks, soda, honey, sugar, etc.) every day. |
|
|
5.584 (0.061) |
|
No |
10 (47.6) |
17 (81) |
|
Sometimes |
10 (47.6) |
3 (14.3) |
|
Yes |
1 (4.8) |
1 (4.8) |
|
All |
21 (100.0) |
21 (100.0) |
|
Comparison of nutrient intake according to the treatment process
Calories (F = 20.994, p < 0.001) and carbohydrate (F = 28.463, p < 0.001) intake were higher before surgery, 1st chemotherapy, and 2nd chemotherapy than that after surgery. Protein (F = 11.364, p < 0.001) and fat (F = 2.761, p < 0.05) intake were higher at 1st and 2nd chemotherapy than that after surgery, and dietary fiber intake was higher at 2nd chemotherapy than that after surgery (F = 5.237, p < 0.01) (
Table 7).
Table 7Comparison of nutrient intake according to the treatment course (n = 21)
Table 7
|
Nutrient intake |
Before surgery |
After surgery |
1st chemotherapy |
2nd chemotherapy |
F |
p |
|
Calories (kcal) |
1,466.01 ± 589.28b
|
905.39 ± 343.59a
|
1,723.38 ± 388.82b
|
1,751.16 ± 607.63b
|
20.994***
|
< 0.001 |
|
Carbohydrate (g) |
216.64 ± 71.68b
|
115.57 ± 33.69a
|
252.16 ± 73.03b
|
250.62 ± 73.07b
|
28.463***
|
< 0.001 |
|
Protein (g) |
56.91 ± 26.50ab
|
40.87 ± 22.89a
|
68.78 ± 18.47b
|
69.50 ± 29.25b
|
11.364***
|
< 0.001 |
|
Fat (g) |
38.76 ± 31.59ab
|
30.33 ± 16.14a
|
45.37 ± 16.10b
|
49.30 ± 30.16b
|
2.761*
|
0.050 |
|
Dietary fiber (g) |
20.85 ± 12.23ab
|
16.60 ± 7.00a
|
22.91 ± 9.02ab
|
25.51 ± 10.73b
|
5.237**
|
0.007 |
Comparison of body measurements according to the treatment process
Weight was higher before and after surgery than that at 1st chemotherapy and 2nd chemotherapy (F = 11.216, p < 0.001) (
Table 8). There was no significant difference in muscle mass, fat mass and BMI of the patients according to the treatment process.
Table 8Comparison of body measurements according to the treatment process (n = 21)
Table 8
|
Measurements |
Before surgery |
After surgery |
1st chemotherapy |
2nd chemotherapy |
F |
p |
|
Weight (kg) |
66.18 ± 11.41b
|
66.36 ± 10.76b
|
63.90 ± 10.76a
|
64.25 ± 10.38a
|
11.216***
|
< 0.001 |
|
Muscle mass (kg) |
24.48 ± 4.42 |
24.86 ± 4.70 |
24.47 ± 4.71 |
24.64 ± 4.46 |
0.924 |
0.403 |
|
Fat mass (%) |
31.70 ± 9.50 |
29.26 ± 10.07 |
28.57 ± 10.02 |
28.47 ± 9.03 |
3.555 |
0.053 |
|
BMI (kg/m2) |
25.33 ± 4.08 |
24.42 ± 6.42 |
24.47 ± 3.77 |
24.62 ± 3.66 |
0.679 |
0.434 |
Comparison of biochemical parameters according to the treatment process
The hemoglobin content before surgery and 2nd chemotherapy was higher than that after surgery and 1st chemotherapy (F = 8.625, p < 0.001). Total protein (F = 14.340, p < 0.001), albumin (F = 15.977, p < 0.001), and lymphocyte (F = 12.398, p < 0.001) levels were significantly lower after surgery than those before surgery and 1st chemotherapy. WBC content was higher before surgery, after surgery, and 1st chemotherapy than that at 2nd chemotherapy (F = 8.543, p < 0.001); K (F = 3.058, p < 0.05) and Cl (F = 3.384, p < 0.05) showed higher levels at 2nd chemotherapy than those after surgery (
Table 9).
Table 9Comparison of biochemical parameters according to the treatment process (n = 21)
Table 9
|
Parameters |
Before surgery |
After surgery |
1st chemotherapy |
2nd chemotherapy |
F |
p |
|
Hemoglobin |
12.89 ± 1.85b
|
11.65 ± 1.54a
|
11.90 ± 1.82a
|
12.34 ± 1.30b
|
8.625***
|
< 0.001 |
|
Total protein |
6.66 ± 0.80b
|
5.94 ± 0.67a
|
6.70 ± 0.80b
|
7.12 ± 0.43b
|
14.340***
|
< 0.001 |
|
Albumin |
4.00 ± 0.42b
|
3.47 ± 0.41a
|
3.79 ± 0.30b
|
3.98 ± 0.23b
|
15.977***
|
< 0.001 |
|
WBC |
7,644.76 ± 1,963.72b
|
8,171.90 ± 3,435.23b
|
6,810.48 ± 2,622.25b
|
4,938.24 ± 1,936.91a
|
8.543***
|
< 0.001 |
|
Lymphocyte |
1,948.10 ± 586.49b
|
1,412.38 ± 468.04a
|
1,637.62 ± 530.90b
|
1,860.00 ± 570.75b
|
12.398***
|
< 0.001 |
|
Na |
140.00 ± 2.30 |
140.81 ± 2.69 |
140.81 ± 2.98 |
141.81 ± 2.14 |
2.630 |
0.058 |
|
K |
4.28 ± 0.35ab
|
4.11 ± 0.32a
|
4.22 ± 0.35ab
|
4.39 ± 0.41b
|
3.058*
|
0.035 |
|
Cl |
104.64 ± 2.21ab
|
103.55 ± 2.50a
|
105.21 ± 3.12ab
|
105.82 ± 2.58b
|
3.384*
|
0.024 |
The main sources providing nutrition information and recognition of the importance of nutrition education
Sources of nutrition information were television programs (10 patients, 47.6%), SNS (YouTube) (10 patients, 47.6%), and professional books (1 patient, 4.8%). Degree of utilization was normal (2 patients, 9.5%), apply a little (5 patients, 23.8%), and apply a lot (14 patients, 66.7%); the level of help was moderate (1 patient, 4.8%), a little helpful (3 patients, 14.3%), a lot of help (17 patients, 81.0%) (
Table 10). The difference in the perception of the importance of nutrition education after surgery and chemotherapy was statistically significant (t = −3.081, p < 0.01). It was higher after chemotherapy (M = 4.67) than after surgery (M = 4.05) (
Table 11).
Table 10Sources of nutrition-related information and the degree of utilization of nutrition education (n = 21)
Table 10
|
Investigation item |
No. (%) |
|
Sources of nutrition-related information |
|
|
Television programs |
10 (47.6) |
|
SNS (YouTube) |
10 (47.6) |
|
Specialty publication |
1 (4.8) |
|
Specialists in hospitals (doctors, nurses, and clinical dietitian) |
0 (0.0) |
|
Degree of utilization of nutrition education |
|
|
I don't apply at all |
0 (0.0) |
|
I rarely apply |
0 (0.0) |
|
Normal |
2 (9.5) |
|
I apply a little |
5 (23.8) |
|
I apply a lot |
14 (66.7) |
|
Degree of help through nutrition education |
|
|
It didn't help at all |
0 (0.0) |
|
It was of little help |
0 (0.0) |
|
Normal |
1 (4.8) |
|
It was a little helpful |
3 (14.3) |
|
It was very helpful |
17 (81.0) |
|
All |
21 (100.0) |
Table 11Comparison of perceptions on the importance of nutrition education after surgery and chemotherapy (n = 21)
Table 11
|
Investigation point |
Average |
Standard deviation |
t |
p |
|
After surgery |
4.05 |
0.74 |
−3.081**
|
< 0.006 |
|
After chemotherapy |
4.67 |
0.58 |
DISCUSSION
The average body fat mass and BMI of the patients participating in the study was 31.2% and 25.3 kg/m
2, respectively. The average body fat mass was higher than the standard value reported in previous studies as 25% for men and 30% for women [
15]; BMI was above the diagnostic criteria for obesity (25 kg/m
2) [
15]. The WCRF suggests body fat mass as a contributing factor to the increased risk of colorectal cancer and recommend to maintain an appropriate body weight as one of the main ways to prevent cancer [
8]. A previous study on colorectal cancer survivors demonstrated that high body fat mass was a significant independent risk factor for the recurrence of progressive adenoma [
21]. In addition, a study examining the relationship between obesity and overweight and cancer reported that an increase in BMI by 2 kg/m
2 led to an increased risk of rectal cancer by 7% [
22]. A cohort study involving 1,630 patients with colorectal cancer showed that the lower the muscle mass, the higher the risk of hospitalization, complications, and mortality after colorectal surgery. Therefore, preserving muscle mass can lower risks after surgery [
23]. In addition, according to a study on 229 patients with stage 3 colorectal cancer undergoing chemotherapy after surgery, a decrease in muscle mass during treatment was associated with poor prognosis and mortality [
24]. In this study, although there was significant weight loss during the study period, there was no significant decrease in muscle mass. Body fat mass showed a tendency to decrease, although the difference was not statistically significant. In other words, muscle mass was preserved, and body fat tended to decrease. Considering higher body fat mass and BMI of the study patients than the standard values and the results of previous studies, the changes observed at the beginning of the study were positive.
In this study, incidence of nausea and vomiting increased after chemotherapy, and dyspepsia, abdominal pain, and bloody stool gradually decreased after surgery. A previous study involving 34,640 patients with colorectal cancer receiving adjuvant chemotherapy after surgery revealed that nausea and vomiting were the most frequently reported symptoms after chemotherapy, followed by diarrhea and neutropenia [
25]. Despite pharmacological advances such as antiemetics, 20%–70% of patients receiving chemotherapy experience nausea and vomiting during treatment, which can lead to reduced nutrient intake and malnutrition, worsening the prognosis of the patient [
26]. Therefore, patients with colorectal cancer undergoing chemotherapy should be educated to manage the symptoms of nausea and vomiting before starting chemotherapy, and this is an important part of maintaining proper nutritional status. During the study period, no significant differences in the rate of defecation-related symptoms, such as diarrhea, constipation, and frequent stool, were observed. Anticancer drugs such as capecitabine and 5-fluorouracil, which are often used for patients with colorectal cancer, frequently cause diarrhea [
27], and decreased oral intake due to anorexia, nausea, and vomiting during chemotherapy can lead to constipation. Previous studies have reported that approximately 40%–90% of patients with cancer undergoing chemotherapy experience constipation [
28,
29]. Based on this, it is thought that symptoms such as diarrhea and constipation in patients with colorectal cancer can appear during all treatment processes, such as surgery and chemotherapy. Therefore, it is necessary for clinical dietitians to continuously educate patients on appropriate dietary plans for maintaining proper nutritional status.
The pattern of eating a variety of food groups has been developed from monotonous eating habits after nutrition education. A study on 1,953 individuals reported that eating a variety of food groups tended to lower the risk of colorectal cancer, although the results were not statistically significant [
30]. In a multiethnic cohort study, patients were classified into 1st to 5th quintiles according to their dietary fiber intake, and the association between dietary fiber intake and incidence of colorectal cancer was examined. The group with the highest dietary fiber intake showed a 51% lower risk of colon cancer in men and 25% in women than that of the group with the lowest dietary fiber intake [
31]. In the European Prospective Investigation into Cancer and Nutrition study, 452,755 patients were followed up for an average of 8.8 years, and an inverse correlation was observed between fruit and vegetable intake and incidence of colorectal cancer [
32]. In the Women’s Health Study, a large cohort of women (36,976 healthy women aged ≥ 45 years) was followed up for an average of 10 years, and the risk of colorectal cancer was reduced by 21% compared to the group with the lowest fruit and vegetable intake [
33]. Based on the results of these previous studies, it is necessary to educate patients with colorectal cancer to consume fruits and vegetables consistently daily to prevent disease recurrence in the future. In this study, the percentage of respondents who answered ‘yes’ to the question, ‘I eat dairy products every day.’ increased after receiving education. The WCRF reported dairy intake as a ‘probable dietary factor’ that could reduce the risk of colorectal cancer [
8]. A meta-analysis of 9 cohort studies found that consuming 200 and 400 mL of dairy daily reduced the risk of developing colorectal cancer by approximately 9% and 17%. This suggests that calcium present in dairy products reduces bile and fatty acid formation, improves intestinal health, and is effective in preventing colorectal cancer [
34].
Further, during the study period, the proportion of those who answered ‘yes’ to the question, ‘I eat meat or eggs more than 5 times a week.’ increased, and the proportion of those who answered ‘yes’ to the question, ‘I eat fatty meat (pork belly, ribs, etc.) at least once every 3 days.’ and ‘When eating out, go to a charcoal grill or a meat restaurant at least once.’ decreased. In 2015, the International Agency for Research on Cancer classified processed meat as a “human carcinogen” and red meat as a “probable human carcinogen” [
35]. A recent meta-analysis of 45 studies on colorectal cancer survivors reported that the consumption of processed meat after diagnosis increased mortality rate of the patients [
36]. Therefore, the WCRF recommends limiting the consumption of processed meat. The recommended consumption of red meat (beef, pork, and lamb) is less than 500 g per week [
8]. The European Society for Clinical Nutrition and Metabolism (ESPEN) stated that sufficient protein intake is necessary after surgery as protein requirement increases due to stress and catabolism after surgery. Therefore, for patients who undergo surgery, a protein intake > 1.5 g/kg per day is recommended [
37]. Moreover, according to the Nutrition Guidelines for Cancer Patients published by ESPEN, it is recommended that patients with cancer should consume at least 1.0 g/kg and up to > 1.5 g/kg of protein per day [
38]. Therefore, after surgery, patients with colorectal cancer should limit their intake of processed meat and be cautious about excessive intake of red meat, but should consume sufficient protein. As sufficient protein intake is required, nutrition education by a clinical dietitian should be provided to plan individualized requirement of protein intake through various food sources of protein.
The intake of calories, carbohydrates, proteins, fats, and fibers increased during the study period. In particular, the intake of calories, carbohydrates, proteins, fats, and dietary fibers was the lowest after surgery. In this study, the lead researcher visited the patients on the 4th day after surgery to investigate their food intake as food intake decreased temporarily immediately after colectomy and due to concerns about food digestion. In addition, the importance of nutrition management during chemotherapy was conveyed to the study patients at the start of chemotherapy (third interview), in addition to managing meals with side effects such as anorexia, and the recommended intake for each patient. According to the survey conducted in the 4th interview, for the question, ‘the level of application of knowledge acquired through nutrition education,’ 23.8% of the respondents answered ‘a little’ and 66.7% responded ‘a lot,’ indicating that nutrition education by clinical dietitians led to positive effects through increase in calories, carbohydrate, protein, fat, and dietary fiber intake by patients during the treatment period. The study findings revealed an increase in oral intake and positive changes in eating habits during treatment, no significant difference was observed in nutritional status evaluation using PG-SGA between before surgery (1st interview) and 2nd chemotherapy (4th interview). This might be due to the increased incidence rate of nausea, vomiting and anorexia after starting chemotherapy compared to before surgery, although the rate of weight loss during chemotherapy decreased compared to before surgery.
According to biochemical analysis results, hemoglobin, total protein, albumin, and lymphocyte levels after surgery were the lowest among all stages during the study period, and WBC levels were the lowest during 2nd chemotherapy. Since stress response and catabolism increase after surgery, the plasma protein level may lower temporarily, and hemoglobin can be lowered in case of bleeding [
20]; therefore, their lowest levels may be observed after surgery. In particular, lymphocytes are reduced in cases of tumor or malnutrition [
20], and the level of less than 1,500 cells/mm
3 indicates malnutrition. The lymphocyte count was observed low after surgery because of lack of sufficient calorie intake owing to immediate fasting before surgery, which was, however, stabilized after 1–2 days due to sufficient oral intake. WBC, an indicator that decreases during chemotherapy, was the lowest during 2nd chemotherapy.
Most study patients obtained nutrition-related information through television programs and SNS (YouTube). It has been reported that many patients with cancer indiscriminately use folk remedies or health functional foods due to inaccurate information [
39]. In the study by Jun et al. [
40], evidence-based individual nutrition education should be provided to patients to improve nutrition knowledge, nutrition management ability, and help maintain an appropriate nutritional status, which can improve their survival rate and quality of life. In addition, a greater awareness about the importance of nutrition education was achieved after the start of chemotherapy than that after surgery. This seems to reflect the desire to gain more knowledge related to nutrition because the study patients had practical difficulties in meal planning while experiencing various symptoms during surgery and chemotherapy.
A study on patients with gynecological cancer undergoing chemotherapy emphasized that continuing education during the treatment period can improve patients’ self-management of the disease [
41]. According to a recent study on patients with colorectal cancer undergoing chemotherapy after surgery, although the patients had a high willingness for nutrition management, they could not apply the contents of education because nutrition management was not performed continuously. The authors suggest that it is necessary to continuously perform individualized nutrition management such as monitoring according to the treatment cycle [
6]. In a study conducted in New Zealand involving 40 patients with colorectal cancer, more than 98% of the patients were interested in obtaining nutrition education after being diagnosed; moreover, 75% of them were willing to change their eating habits, but the hospitals where they were treated did not provide dietary information that would meet their individual needs [
42]. In a recent study by Lewandowska et al. [
43], patients with cancer should receive nutrition counseling and education from a qualified nutritionist specializing in clinical nutrition during treatment to minimize the risk of complications such as malnutrition, which may affect the disease prognosis and their quality of life. Therefore, considering the results of the present and previous studies, a clinical dietitian should provide cancer patients with appropriate nutrition information according to their treatment processes, and the hospital should have appropriate food and nutrition facility.
This study has several limitations. First, the sample size was small. It was calculated as 30 using G*Power 3.1.9, but the number of patients satisfying this number could not be recruited. However, it is of great significance that four interviews were conducted per research subject before surgery, after surgery, 1st chemotherapy, and 2nd chemotherapy, and the nutritional status during each treatment process was continuously monitored. Second, the 24-hour recall method was used to investigate the patient’s meal intake history has the disadvantage that it does not completely reflect the patient's usual meal history, and it may not be inaccurate because the patient must report nutrient intake based on memory [
44]. Other methods of intake survey include a meal diary and a food frequency questionnaire. In a meal diary, patients may record fewer or more than their usual meal intake. In addition, because the subject itself has to record the type and amount of food consumed, it is difficult to accurately evaluate the food intake with insufficient knowledge about food ingredients or detailed records of food intake [
44]. Food frequency questionnaires can easily determine a subject's overall dietary pattern of major foods over a long period, but they are limited in accurately analyzing the intake or understanding detailed information about eating habits [
44]. Each method of intake survey has limitations; therefore, the 24-hour recall method, which is the most suitable method for this study, was used. An experienced clinical dietitian conducted interviews using various food group models to determine the exact food intake.
In conclusion, considering the results of the present and previous studies, patients with colorectal cancer may suffer from malnutrition even before diagnosis and experience various symptoms during surgery and chemotherapy. Clinical dietitians providing appropriate nutrition information throughout the treatment process and performing individual nutritional interventions can help patients maintain a proper nutritional status. This may have a positive effect on the disease prognosis.
Chungnam National University Hospitalhttps://doi.org/10.13039/501100007631
NOTES
-
Funding: This research was supported by the Chungnam National University Hospital Research Fund, 2022.
-
Conflict of Interest: The authors declare that they have no competing interests.
-
Author Contributions:
Conceptualization: Kang HI, Ryu HW, Lee KH.
Data curation: Son J, Jung EY.
Formal analysis: Son J.
Investigation: Son J.
Supervision: Ryu HW, Lee KH.
Validation: Son J.
Visualization: Son J.
Writing - original draft: Son J.
Writing - review & editing: Kang HI, Jung EY.
REFERENCES
- 1. Korea Center Cancer Registry. Cancer occurrence status. Goyang: Korea Center Cancer Registry; 2021.
- 2. Patel SG, Karlitz JJ, Yen T, Lieu CH, Boland CR. The rising tide of early-onset colorectal cancer: a comprehensive review of epidemiology, clinical features, biology, risk factors, prevention, and early detection. Lancet Gastroenterol Hepatol 2022;7:262-274.
- 3. Hall W. NIH consensus conference. Adjuvant therapy for patients with colon and rectal cancer. JAMA 1990;264:1444-1450.
- 4. Kelly K. An overview of how to nourish the cancer patient by mouth. Cancer 1986;58:1897-1901.
- 5. Jeong G, Kim K, Kwak Y. Quality of life in colorectal cancer patients according to the severity of symptom clusters classification. Asian Oncol Nurs 2014;14:74-83.
- 6. Park HJ, Kil HS, Cho WY. Qualitative study of compliance with nutritional management in colorectal cancer patient undergoing chemotherapy. Korean J Community Nutr 2020;25:303-316.
- 7. Kim EK, Yang YH, Choi-Kwon S. Nutritional status of cancer patients upon admission. J Korean Acad Nurs 1999;29:271-280.
- 8. World Cancer Research Fund, American Institute for Cancer Research. Diet, nutrition, physical activity and colorectal cancer [Internet]. 2018. cited 2021 February. Available from https://www.wcrf.org/wp-content/uploads/2021/02/Colorectal-cancer-report.pdf
- 9. Park KO, Choi-Kwon S. Effects of individualized nutritional education programs on the level of nutrient intake and nutritional status of colorectal cancer patients undergoing palliative chemotherapy. J Korean Acad Nurs 2012;42:799-809.
- 10. Nho JH, Kim SR, Kang GS, Kwon YS. Relationships among malnutrition, depression and quality of life in patients with gynecologic cancer receiving chemotherapy. Korean J Women Health Nurs 2014;20:117-125.
- 11. Lee H, Choi-Kwon S. The relationships among chemotherapy-induced nausea and vomiting (CINV), non-pharmacological coping methods, and nutritional status in patients with gynecologic cancer. J Korean Acad Nurs 2017;47:731-743.
- 12. Cho JW, Youn JY, Choi MG, Rha MY, Lee JE. Assessing nutritional status in outpatients after gastric cancer surgery: a comparative study of five nutritional screening tools. Korean J Community Nutr 2021;26:280-295.
- 13. Lee SH, Lee HJ, Hyun S, Lee MS, Kim DH, Kim YD. Nutritional intake and postoperative pulmonary complications among lung cancer patients who underwent pulmonary resection. J Korean Biol Nurs Sci 2021;23:11-21.
- 14. Kwon MH, Han B, Cho SJ, Cho JH. Analysis of body fat mass index for Korean adults. Korean J Fam Pract 2021;11:81-85.
- 15. Sim SJ, Park HS. The cut-off values of body fat to identify cardiovascular risk among Korean adults. J Korean Soc Study Obes 2004;13:14-21.
- 16. Korean Society for the Study of Obesity. Clinical practice guidelines for obesity. Seoul: Korean Society for the Study of Obesity; 2022.
- 17. Pt-Global. The scored patient-generated subjective global assessment (PG-SGA©) [Internet]. c2014. cited 2021 February. Available from https://pt-global.org/pt-global/
- 18. Isenring E, Bauer J, Capra S. The scored patient-generated subjective global assessment (PG-SGA) and its association with quality of life in ambulatory patients receiving radiotherapy. Eur J Clin Nutr 2003;57:305-309.
- 19. National Cancer Information Center. My eating habit assessment [Internet]. 2013. cited 2013 October 18. Available from https://www.cancer.go.kr/lay1/S1T226C228/contents.do
- 20. The Korean Dietetic Association. Manual of medical nutrition therapy. 4th ed. Seoul: The Korean Dietetic Association; 2022.
- 21. Park J, Kim JH, Lee HJ, Park SJ, Hong SP, Cheon JH, Kim WH, Park JS, Jeon JY, Kim TI. The effects of physical activity and body fat mass on colorectal polyp recurrence in patients with previous colorectal Cancer. Cancer Prev Res (Phila) 2017;10:478-484.
- 22. Calle EE, Kaaks R. Overweight, obesity and cancer: epidemiological evidence and proposed mechanisms. Nat Rev Cancer 2004;4:579-591.
- 23. Xiao J, Caan BJ, Cespedes Feliciano EM, Meyerhardt JA, Peng PD, Baracos VE, Lee VS, Ely S, Gologorsky RC, Weltzien E, Kroenke CH, Kwan ML, Alexeeff SE, Castillo AL, Prado CM. Association of low muscle mass and low muscle radiodensity with morbidity and mortality for colon cancer surgery. JAMA Surg 2020;155:942-949.
- 24. Jung HW, Kim JW, Kim JY, Kim SW, Yang HK, Lee JW, Lee KW, Kim DW, Kang SB, Kim KI, Kim CH, Kim JH. Effect of muscle mass on toxicity and survival in patients with colon cancer undergoing adjuvant chemotherapy. Support Care Cancer 2015;23:687-694.
- 25. Wagner AD, Grothey A, Andre T, Dixon JG, Wolmark N, Haller DG, Allegra CJ, de Gramont A, VanCutsem E, Alberts SR, George TJ, O’Connell MJ, Twelves C, Taieb J, Saltz LB, Blanke CD, Francini E, Kerr R, Yothers G, Seitz JF, Marsoni S, Goldberg RM, Shi Q. Sex and adverse events of adjuvant chemotherapy in colon cancer: an analysis of 34 640 patients in the ACCENT database. J Natl Cancer Inst 2021;113:400-407.
- 26. Gala D, Wright HH, Zigori B, Marshall S, Crichton M. Dietary strategies for chemotherapy-induced nausea and vomiting: a systematic review. Clin Nutr 2022;41:2147-2155.
- 27. Marsé H, Van Cutsem E, Grothey A, Valverde S. Management of adverse events and other practical considerations in patients receiving capecitabine (Xeloda). Eur J Oncol Nurs 2004;8:S16-S30.
- 28. Larkin PJ, Cherny NI, La Carpia D, Guglielmo M, Ostgathe C, Scotté F, Ripamonti CI. ESMO Guidelines Committee. Diagnosis, assessment and management of constipation in advanced cancer: ESMO clinical practice guidelines. Ann Oncol 2018;29:iv111-iv125.
- 29. Staats PS, Markowitz J, Schein J. Incidence of constipation associated with long-acting opioid therapy: a comparative study. South Med J 2004;97:129-134.
- 30. Fernandez E, Negri E, La Vecchia C, Franceschi S. Diet diversity and colorectal cancer. Prev Med 2000;31:11-14.
- 31. Nomura AM, Hankin JH, Henderson BE, Wilkens LR, Murphy SP, Pike MC, Le Marchand L, Stram DO, Monroe KR, Kolonel LN. Dietary fiber and colorectal cancer risk: the multiethnic cohort study. Cancer Causes Control 2007;18:753-764.
- 32. van Duijnhoven FJ, Bueno-De-Mesquita HB, Ferrari P, Jenab M, Boshuizen HC, Ros MM, Casagrande C, Tjønneland A, Olsen A, Overvad K, Thorlacius-Ussing O, Clavel-Chapelon F, Boutron-Ruault MC, Morois S, Kaaks R, Linseisen J, Boeing H, Nöthlings U, Trichopoulou A, Trichopoulos D, Misirli G, Palli D, Sieri S, Panico S, Tumino R, Vineis P, Peeters PH, van Gils CH, Ocké MC, Lund E, Engeset D, Skeie G, Suárez LR, González CA, Sánchez MJ, Dorronsoro M, Navarro C, Barricarte A, Berglund G, Manjer J, Hallmans G, Palmqvist R, Bingham SA, Khaw KT, Key TJ, Allen NE, Boffetta P, Slimani N, Rinaldi S, Gallo V, Norat T, Riboli E. Fruit, vegetables, and colorectal cancer risk: the European Prospective Investigation into Cancer and Nutrition. Am J Clin Nutr 2009;89:1441-1452.
- 33. Lin J, Zhang SM, Cook NR, Rexrode KM, Liu S, Manson JE, Lee IM, Buring JE. Dietary intakes of fruit, vegetables, and fiber, and risk of colorectal cancer in a prospective cohort of women (United States). Cancer Causes Control 2005;16:225-233.
- 34. Aune D, Lau R, Chan DS, Vieira R, Greenwood DC, Kampman E, Norat T. Dairy products and colorectal cancer risk: a systematic review and meta-analysis of cohort studies. Ann Oncol 2012;23:37-45.
- 35. Bouvard V, Loomis D, Guyton KZ, Grosse Y, Ghissassi FE, Benbrahim-Tallaa L, Guha N, Mattock H, Straif K. International Agency for Research on Cancer Monograph Working Group. Carcinogenicity of consumption of red and processed meat. Lancet Oncol 2015;16:1599-1600.
- 36. Hoang T, Kim H, Kim J. Dietary intake in association with all-cause mortality and colorectal cancer mortality among colorectal cancer survivors: a systematic review and meta-analysis of prospective studies. Cancers (Basel) 2020;12:3391.
- 37. Weimann A, Braga M, Carli F, Higashiguchi T, Hübner M, Klek S, Laviano A, Ljungqvist O, Lobo DN, Martindale R, Waitzberg DL, Bischoff SC, Singer P. ESPEN guideline: clinical nutrition in surgery. Clin Nutr 2017;36:623-650.
- 38. Muscaritoli M, Arends J, Bachmann P, Baracos V, Barthelemy N, Bertz H, Bozzetti F, Hütterer E, Isenring E, Kaasa S, Krznaric Z, Laird B, Larsson M, Laviano A, Mühlebach S, Oldervoll L, Ravasco P, Solheim TS, Strasser F, de van der Schueren M, Preiser JC, Bischoff SC. ESPEN practical guideline: clinical nutrition in cancer. Clin Nutr 2021;40:2898-2913.
- 39. Kim YS, Kim SY, Jung KA, Kwon SH, Jang YK, Park MH, Hwang SJ. Dietary behaviors and consumption of health food among the cancer patients. J East Asian Soc Diet Lif 2005;15:516-523.
- 40. Jun M, Kim M, Choi K, Kim D. The effect factors of quality of life on patients undergoing chemotherapy after stomach cancer surgery. J Korean Oncol Nurs 2002;2:83-93.
- 41. Kim AS, Lee ES, Kim SH. Effects of telephone intervention as supportive nursing on self-care practices and qualify of life for gynecological cancer patients under chemotherapy. J Korean Acad Nurs 2007;37:744-753.
- 42. Pullar JM, Chisholm A, Jackson C. Dietary information for colorectal cancer survivors: an unmet need. N Z Med J 2012;125:27-37.
- 43. Lewandowska A, Religioni U, Czerw A, Deptała A, Karakiewicz B, Partyka O, Pajewska M, Sygit K, Cipora E, Kmieć K, Augustynowicz A, Mękal D, Waszkiewicz M, Barańska A, Mináriková D, Minárik P, Merks P. Nutritional treatment of patients with colorectal cancer. Int J Environ Res Public Health 2022;19:6881.
- 44. Mahan LK. Krause’s food & the nutrition care process. 14th ed. St. Louis (MO): Elsevier; 2017.


