ABSTRACT
Early prevention of sarcopenia can be an important strategy for muscle maintenance, but most studies target subjects at slightly pre-sarcopenic state. Our previous paper describes the effect of protein supplements rich in leucine and vitamin D on muscle condition, and in this paper, we performed a sub-analysis to evaluate who benefitted the most in terms of improvement in muscle health. A 12-week randomized clinical trial of 120 healthy adults (aged 50 to 80) assigned to an intervention group (n = 60) or control group (n = 60) were analyzed. Subjects in the intervention group received, twice per day, a protein supplement containing (per serving) 800 IU of vitamin D, 20 g of protein (3 g of total leucine), 300 mg of calcium, 1.1 g of fat, and 2.5 g of carbohydrate. The subjects were classified into ‘insufficient’ and ‘sufficient’ groups at 25-hydroxyvitamin D (25[OH]D) value of 30 ng/mL. The skeletal muscle mass index normalized to the square of the skeletal muscle mass (SMM) height (kg/m2) increased significantly in the ‘insufficient group’ difference value of change between weeks 0 and 12 (Δ1.07 ± 2.20; p = 0.037). The SMM normalized by body weight (kg/kg, %) was higher, but not significantly, in the insufficient group (Δ0.38 ± 0.69; p = 0.050). For people with insufficient (serum 25[OH]D), supplemental intake of protein and vitamin D, calcium, and leucine and adequate energy intake increases muscle mass in middle-aged and older adults and would be likely to exert a beneficial effect on muscle health.
-
Trial Registration
Clinical Research Information Service Identifier:
KCT0005111
-
Keywords: Leucine; Muscles; Protein; Vitamin D
INTRODUCTION
Sarcopenia is a decrease in muscle mass and strength that occurs with age [
1,
2]. Sarcopenia triples risk of falls [
1,
3]. Also, the risk of death doubles every 1 kg/m
2 decrease in muscle mass, which is recognized as an important health problem, especially among older adults [
1,
4].
Loss of muscle mass is closely related to decreased protein intake. Changes in mass are determined by the balance of protein synthesis and muscle breakdown [
5]. Protein intake can preserve or increase muscle mass by stimulating muscle protein synthesis and reducing catabolism. The branched-chain amino acids leucine, isoleucine, and valine are the only essential amino acids that are oxidized primarily outside the liver. Specifically, leucine is responsible for regulating muscle protein turnover [
6]. We previously found that feeding leucine-added protein to older adults with sarcopenia for 12 weeks increased both appendicular skeletal muscle mass and total lean body mass at the same time [
7].
Vitamin D is one of the nutrients that affect the musculoskeletal system, and vitamin D deficiency is one of the factors that due to loss of muscle mass and strength [
1,
8]. Results from the Korean National Health and Nutrition Survey between 2009 to 2011 suggests [
1], the lower the serum vitamin D level in Korean adults over 50 years of age, the higher the risk of sarcopenia. The relationship between vitamin D and muscle mass mechanisms may include: 1) The vitamin D and parathyroid hormone (PTH) pathways are associated with loss of muscle mass. Parathyroid hormone increases serum calcium levels, and vitamin D deficiency increases PTH secretion, increasing the calcium concentration in muscle cells, reducing cytokine synthesis, and increasing breakdown [
1,
9]. 2) Vitamin D binds to the vitamin D receptor in muscle cells, promoting protein synthesis and growth of muscle cells [
10]. So, with insufficient vitamin D, proximal muscle strength is weakened, and type 2 muscle fiber atrophy is observed [
3]. 3) Vitamin D prevents muscle weakness caused by inflammation and lowers the level of inflammation, one of the risk factors for developing sarcopenia [
11].
Previous studies on protein supplements that include vitamin D have generally been conducted in older adults over the age of 65, and studies in healthy people, including adults, are rare. Serum vitamin D levels in Koreans have decreased significantly at all ages and tend to decrease most rapidly between the ages of 40 to 50 [
12]. This is because less sun exposure and the effects of UV rays reduce the ability of aged skin to synthesize vitamin D3 [
13]. A randomized study evaluating functional improvement in an elderly population with low vitamin D status showed that vitamin D supplementation improved vitamin D storage which was associated with functional improvement in vitamin D status [
14,
15]. The relationship between vitamin D, functional performance, and psychomotor function typing in older adults with falls was investigated in a prospective summary study [
14,
16] Deficiency of vitamin D showed impaired neuromuscular function, leading to increased falls. In addition, a previous study found a positive and strong correlation serum between the 25-hydroxyvitamin D3 (25[OH]D3) serum concentration and femur strength in older women [
17,
18]. A study investigating whether serum 25-hydroxyvitamin D (25[OH]D) and serum PTH levels were associated with muscle loss and muscle mass loss in older adults over 65 found that low serum 25(OH)D levels and high PTH levels increase the risk of sarcopenia in older adults [
3]. Therefore, we hypothesized that continuous intake of protein supplements containing vitamin D in healthy adults and elderly people insufficient in serum vitamin D can be effective for absorption in the body, increase muscle mass, and improve muscle strength and body function.
Therefore, this study was conducted to verify the effects of a vitamin D-containing mixture (per serving 800 IU of vitamin D, 20 g of protein [3 g of total leucine], 300 mg of calcium, 1.1 g of fat, and 2.5 g of carbohydrate) on physiological indicators, muscle mass, physical function items, muscle strength, and physical ability for 12 weeks in Koreans aged 50–80 years. This study will serve as evidence for changes in muscle mass and the need for increased vitamin D intake according to blood vitamin D levels in middle-aged and elderly Koreans.
MATERIALS AND METHODS
Settings and study design
Our study was conducted as a 12-week scheduled randomized controlled trial (RCT). Prior analysis determined that a sample size of 102 was required to detect the least significant change of 0.151 (standard deviation [SD] = 0.301) in appendicular skeletal muscle mass (ASM) using dual-energy X-ray absorptiometry (DXA); this achieved 90% power to detect differences at the 0.05 alpha level. Considering that the dropout rate was 15%, 120 volunteers were recruited, which were assigned to the intervention (n = 60) or placebo (n = 60) group [
19]. Neither the investigators nor the participants knew the random codes or results. In this study, an in-depth analysis was conducted for only the intervention group, which was used to evaluate the improvement in muscle health with vitamin D level. The World Health Organization defined 25(OH)D concentrations of 10 ng/mL or less as deficiency and 20 ng/mL or less as deficiency [
20], and the US Institute of Medicine (IOM) defined 12 ng/mL or less as deficiency, 20 ng/mL or higher is considered normal [
21]. However, as the standards are still not unified, vitamin D deficiency is defined as less than 20 ng/mL (50 nmol/L), 21–29 ng/mL as relative deficiency, and 30 ng/mL or more as sufficient [
22]. Based on Ajou University Hospital’s which conducted the study, blood measurement reference, those who had serum vitamin D levels below 30 ng/mL at week 0 were assigned to the ‘insufficient’ group and those having over 30 ng/mL were assigned to the ‘sufficient’ group. In the intervention group, 6 out of 60 volunteers dropped out of the study and 23 participants from the insufficient group and 31 participants from the sufficient group were included in the analysis. Also, in the control group, 3 out of 60 volunteers dropped out of the study and 23 participants from the insufficient group and 34 participants from the sufficient group were included in the analysis. Further details are described in Kang et al. [
19].
The study was conducted from September 2019 and finished by February 2020 during the season where sun exposure is the lowest throughout the year. Healthy adults aged 50 to 80 were recruited and they all visited Ajou University Hospital in Gyeonggi-do. All subjects submitted informed consent for inclusion prior to participation in the study. The study was conducted in accordance with the Helsinki Declaration, and the protocol was approved by the Institutional Review Board (IRB) Ethics Committee of both Kyung Hee University and Ajou University Hospital in April 2019 (No. KHSIRB 2019-004, No. AJIRB-MED-FOD-1948). In addition, this study was registered in the Clinical Research Information Service (KCT0005111), a nonprofit online registration system for domestic clinical trials established by the Korean Centers for Disease Control and Prevention (KCDC). The KCDC has joined the WHO International Clinical Trials Registry Platform (ICTRP) as the 11th member of its Primary Registry, also, the full trial protocol for this study is available here. Authors do not share participant data that is not personally identifiable.
Participants
The inclusion criteria: 1) 50 to less than 80 years old, 2) having an appendicular skeletal muscle mass index (ASMI) greater than 5.4 kg/m2 for women, 7.0 kg/m2 for men or more measured by DXA (GE Healthcare, Madison, WI, USA) measurements, 3) subjects within a body mass index (BMI) of 18.5–27 kg/m2. Exclusion criteria were as follows: 1) estimated glomerular filtration rate (eGFR) of 60 mL/min/1.73 m2 or less, 2) currently receiving insulin therapy, taking steroids or testosterone-based drugs, 3) having chronic lung disease, 4) taking 1,000 IU or more of vitamin D, 5) eating a special diet for disease management purposes, 6) history of high-intensity strength training in the past 6 months, 7) musculoskeletal disorders that made exercise difficult, 8) muscle mass intervuntreated or unregulated cardiovascular disease that may affect exercise, 9) less than 5 years after treatment of malignant tumor, and 10) cirrhosis, diabetes, or other chronic disease.
Study products and compliance
The participants were assigned to consume 2.5 g twice a day for 12 weeks of protein mixture powder (90% milk protein and 10% soy protein, Muscle Health Solution Formula; Maeil Dairies Co., Ltd., Pyeongtaek, Korea), which is a mixture of 800 IU of vitamin D (20 µg), 20 g of protein (3,000 mg of total leucine), 300 mg of calcium, 1.1 g of fat, and carbohydrate. The detailed composition of the product is as follows: vitamin D: fortified with 100% vitamin D3 (cholecalciferol); protein: casein 50%: whey 40%: vegetable protein (separated soy protein) 10%; calcium: 65% of calcium derived from milk protein, 16% derived from vegetable protein, and about 19% derived from calcium carbonate and calcium triphosphate; leucine: 68% derived from a protein source are 90% milk protein and 10% soy protein. And the remainder fortified with mono-amino acid (L-leucine). And control participants received isocaloric-placebo supplement powder (carbohydrate 25 g) twice a day for 12 weeks.
Primary outcomes: muscle mass
Participants in this study were measured using DXA and bioelectrical impedance analysis (BIA) after at least 8 hours of fasting. ASMI (kg/m2) = ASM (kg)/Height (m2), ASM normalized by body weight (ASM/weight, %) = ASM (kg)/Body weight (kg) × 100, ASM normalized by BMI (ASM/BMI) = ASM (kg)/BMI (kg/m2), visceral adipose tissue (VAT) metrics consisting of VAT volume (cm3) and VAT mass (g) were measured using DXA.
Double-energy X-ray absorptiometry is based on the degree of attenuation of transmitted radiation, which depends on the body composition and thickness of the area where the radiation passes through the human body. It gives very accurate values in one measurement and has the advantage of setting the amount of fat and muscle throughout the body. In the definition of sarcopenia, bone tissue occupies most of the head and pelvis, and the thickness of the trunk affects the measurement of the trunk. The relative error is large because fat, muscle, and bone tissue overlap in several layers [
23,
24]. When the body’s moisture level changes by more than 5%, the fat measurement decreases.
The principle of the method of measuring the amount of skeletal muscle using BIA is to consider the human body as the sum of several conductors and to calculate the body composition by evaluating the degree of resistance to current flow in each conductor. Muscle mass is estimated by subtracting the amount of water and fat from your body weight. For the BIA method, food, drinking water, and exercise should be prohibited at least 4 hours before measurement, and the room temperature should be kept at 18°C to 24°C to reduce measurement errors. In this study, attention was paid to fasting for at least 8 hours and maintaining body temperature during measurements to reduce these errors.
Secondary outcomes: muscle strength
Muscle strength was measured before and after the study. For the measurement of femoral muscle strength, a Commander Echo Muscle Tester (microFET2; HOGGAN Ergo, Salt Lake City, UT, USA) was used to measure the right and left legs three times each, with the average values being recorded. In addition, the grip strength (kg) of the right and left hands were each assessed three times using a dynamometer (Jamar, Plus+ Digital Hand Dynamometer; Jamar Performance Preferred, Anaheim, CA, USA) and the average values and SDs were recorded.
Anthropometric analysis
Height was measured using an automatic height and weight measuring device (GL-150; G-tech International, Uijeongbu, Korea). Additionally, the body composition analyzer (InBody720; Biospace, Seoul, Korea) was used to measure weight (kg) and BMI (kg/m2), while arm and calf circumferences were measured using a tape measure.
Physical performance and physical activity questionnaire
The short physical performance battery (SPPB) test was used to measure physical performance. An evaluation table was used to measure and record standing balance, 4-m gait speed, and repeated chair stands. For each item, 0 points equated to inability to perform and 1 to 4 points were assigned depending on task performance. Finally, a score of 12 points indicated that the subject had earned 4 points for each task. All testing was carried out by a single expert inspector. The physical performance of each subject was assessed at the beginning and at the end of the study. The trained dietitian asked the participants to complete an International Physical Activity Questionnaire (IPAQ) at each visit to monitor changes in physical activity at weeks 0, 4, and 8.
Blood analysis
Blood analyses were performed before and after the study. Each participant’s blood was collected after at least 8 hours of fasting by a registered phlebotomist. Serum 25(OH)D was analyzed with Chemi-luminescence immunoassay (Kit: ADVIA Centaur Vit.D Total [Vit.D], SIEMENS ADVIA Centaur XPT module).
Dietary intake
Participants were asked not to change their daily eating habits during the study period. Three-day diet records were collected to monitor dietary changes during weeks 0, 4, 8, and 12, which were analyzed using CAN pro 5.0 software (Computer-assisted Analysis Program for Korean Nutrition Society Professionals ver. 5.0, 2015; The Korean Nutrition Society, Seoul, Korea).
Statistical analysis
The data were analyzed using the Statistical Package for Social Sciences (SPSS) ver. 25.0 (IBM Korea, Seoul, Korea). To establish if there was a difference in baseline between the 2 groups, an independent t-test was performed for the continuous variable and a χ2 test for the categorical variable. Descriptive differences between groups in the participant population were analyzed using an independent t-test for means comparison.
RESULTS
Baseline characteristics of participants
There was no significant difference (p = 0.53 and p = 0.62, respectively) in the proportions of males and females in the intervention and control in the insufficient and sufficient groups. Data for body composition, muscle function, and complete blood count (
Table 1) did not significantly differ between the intervention and control in the insufficient and sufficient groups. However, the age of the participants was significantly different between groups in the sufficient group (62.4 ± 7 years for the intervention group and 58.5 ± 6 years for the control group, p = 0.02). The eGFR data are not presented because all participants had levels greater than 60 mL/min/1.73 m
2 both before and after the study.
Table 1Baseline characteristics of subjects
Table 1
|
Characteristics |
Insufficient group (n = 46) |
Sufficient group (n = 65) |
|
Control (n = 23) |
Intervention (n = 23) |
p value |
Control (n = 34) |
Intervention (n = 31) |
p value |
|
Age |
59.5 ± 5 |
59 ± 6 |
0.86 |
58.5 ± 6 |
62.4 ± 7 |
0.02*
|
|
Sex |
|
|
0.53 |
|
|
0.62 |
|
Men (%) |
6 (26.1) |
8 (34.8) |
8 (23.5) |
9 (29.0) |
|
Women (%) |
17 (73.9) |
15 (65.2) |
26 (76.5) |
22 (71.0) |
|
Weight (kg) |
62 ± 7 |
63 ± 8 |
0.54 |
60 ± 6 |
60.7 ± 8.5 |
0.81 |
|
Height (cm) |
160 ± 6 |
161 ± 8 |
0.75 |
161 ± 6 |
159 ± 7 |
0.42 |
|
BMI (kg/m2) |
23.9 ± 1.6 |
24 ± 1.8 |
0.50 |
23 ± 1.9 |
23.7 ± 2 |
0.34 |
|
DXA |
|
|
|
|
|
|
|
Muscle mass |
|
|
|
|
|
|
|
|
ASM (kg) |
16.7 ± 3 |
17 ± 3.8 |
0.68 |
16.8 ± 3 |
17 ± 4 |
0.79 |
|
|
ASM/wt (kg/kg, %) |
27 ± 3 |
27 ± 3 |
0.99 |
27.8 ± 3 |
27.8 ± 3 |
0.96 |
|
|
ASMI (kg/m2) |
6 ± 0.8 |
6 ± 0.8 |
0.79 |
6 ± 0.8 |
6 ± 1 |
0.44 |
|
|
ASM/BMI (kg/[kg/m2]) |
0.7 ± 0.1 |
0.7 ± 0.1 |
0.79 |
0.7 ± 0.1 |
0.7 ± 0.1 |
0.76 |
|
Visceral adipose tissue |
|
|
|
|
|
|
|
|
VAT volume (cm3) |
860 ± 350 |
1,005 ± 575 |
0.30 |
809 ± 436 |
831.7 ± 416 |
0.83 |
|
|
VAT mass (g) |
812 ± 331 |
980.9 ± 510 |
0.19 |
763 ± 411.7 |
784 ± 392 |
0.83 |
|
BIA |
|
|
|
|
|
|
|
SMM (kg) |
23 ± 3.7 |
23.7 ± 5 |
0.73 |
23 ± 4 |
23.8 ± 4 |
0.85 |
|
SMM/Wt (kg/kg, %) |
37.7 ± 3 |
37 ± 4 |
0.88 |
39 ± 4.7 |
39 ± 3 |
0.40 |
|
SMMI (kg/m2) |
9 ± 0.9 |
9 ± 1.1 |
0.80 |
9 ± 1 |
9 ± 1 |
0.41 |
|
SMM/BMI (kg/[kg/m2]) |
0.9 ± 0.1 |
0.98 ± 0.1 |
0.88 |
1 ± 0.1 |
1 ± 0.1 |
0.67 |
|
Muscle function |
|
|
|
|
|
|
|
Arm circumference (cm) |
30 ± 1.7 |
30.8 ± 1.9 |
0.18 |
29 ± 1.7 |
30 ± 2 |
0.22 |
|
Calf circumference (cm) |
34.9 ± 2 |
35 ± 3.19 |
0.88 |
34.7 ± 2.1 |
35 ± 2.7 |
0.27 |
|
SPPB (score) |
11.7 ± 0.4 |
11.7 ± 0.4 |
0.73 |
11 ± 1 |
11.5 ± 0.8 |
0.39 |
|
Femoral muscle strength (N) |
203 ± 40.5 |
184.7 ± 44.8 |
0.36 |
162 ± 50 |
168 ± 46.4 |
0.64 |
|
Grip strength (kg) |
26.8 ± 7.6 |
30 ± 8.6 |
0.08 |
26.7 ± 6.2 |
27.8 ± 7.7 |
0.53 |
|
IPAQ |
1,705 ± 1,361 |
1,408 ± 1,071 |
0.41 |
2,496 ± 1,977 |
2,193 ± 1,619 |
0.50 |
|
Blood test |
|
|
|
|
|
|
|
25(OH)D (ng/mL)†
|
25.7 ± 3 |
25 ± 3 |
0.54 |
42 ± 9 |
41.9 ± 9 |
0.92 |
Dropouts and compliance
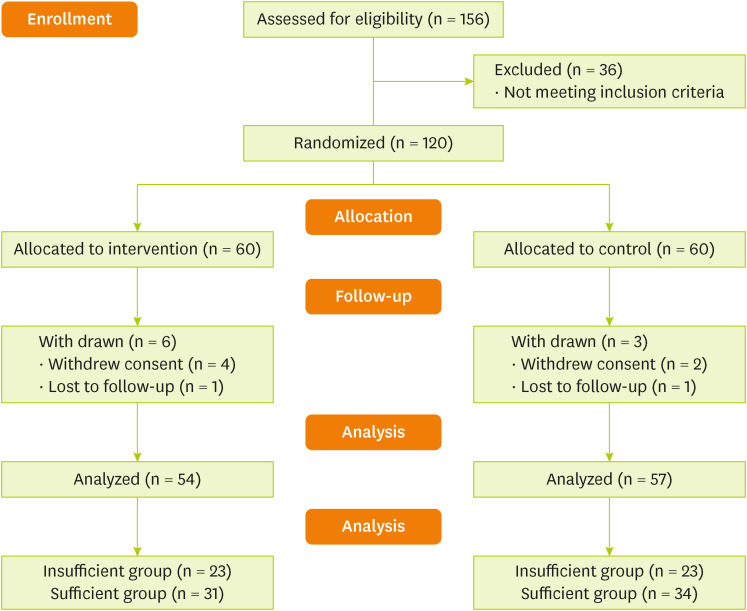
A total of 111 datasets from 54 participants in the intervention group and 57 controls were used in the final analysis, which included participants for whom follow-up was completed (
Figure 1). During the study, a total of nine participants dropped out (dropout rate of 9.2%). Six participants were dropped from the intervention group due to enrolling error (n = 1), withdrawal of consent (n = 4), and loss to follow-up (n = 1). In the control group, 3 participants were dropped for reasons such as non-compliance (n = 2) and loss to follow-up (n = 1). Reasons for withdrawal of consent were adverse reactions such as constipation (n = 1), heartburn (n = 1), and skin rash (n = 1), as well as simple change of mind (n = 1). To assess compliance, the participants were asked to record the number of supplements they consumed every day; the reported compliance exceeded 80%.
Figure 1Flow chart of the study population.

Effects of intervention on muscle health, physical performance, and blood measurements
Based on physical performance, to the 54 participants who fulfilled the criteria for analysis until the end of the trial. Continuous variables are reported as means ± SD. There was no significant change in muscle index results measured by DXA in both groups (
Table 2). No significant effects were observed on muscle function and IPAQ between the 2 groups.
Table 2Muscle health and blood measurement changes during the 12-week study period
Table 2
|
Measurements |
Insufficient group (n = 46) |
Sufficient group (n = 65) |
|
Control (n = 23) (12–0 weeks) |
Intervention (n = 23) (12–0 weeks) |
p value |
Control (n = 34) (12–0 weeks) |
Intervention (n = 31) (12–0 weeks) |
p value |
|
Muscle mass |
|
|
|
|
|
|
|
DXA |
|
|
|
|
|
|
|
|
Δ ASM (kg) |
0.1 ± 0.5 |
0.2 ± 0.4 |
0.65 |
0.1 ± 0.4 |
0.1 ± 0.6 |
0.81 |
|
|
Δ ASM/wt (kg/kg, %) |
−0.01 ± 0.7 |
−0.02 ± 0.6 |
0.94 |
−0.04 ± 0.6 |
0.1 ± 0.9 |
0.34 |
|
|
Δ ASMI (kg/m2) |
0.05 ± 0.2 |
0.07 ± 0.1 |
0.62 |
0.06 ± 0.1 |
0.05 ± 0.2 |
0.92 |
|
|
Δ ASM/BMI (kg/[kg/m2]) |
0.01 ± 0.01 |
−0.01 ± 0.01 |
0.80 |
−0.00 ± 0.01 |
0.00 ± 0.02 |
0.37 |
|
VAT |
|
|
|
|
|
|
|
|
Δ VAT volume (cm3) |
−0.8 ± 106.6 |
74 ± 294 |
0.25 |
36 ± 116 |
−30 ± 124 |
0.40 |
|
|
Δ VAT mass (g) |
−1.5 ± 100.6 |
37 ± 190.5 |
0.39 |
33.7 ± 110 |
−28.5 ± 117.7 |
0.66 |
|
Muscle function |
|
|
|
|
|
|
|
Δ Arm circumference (cm) |
0.3 ± 0.5 |
0.5 ± 0.6 |
0.27 |
0.2 ± 0.5 |
0.2 ± 0.4 |
0.73 |
|
Δ Calf circumference (cm) |
−0.4 ± 1.4 |
−0.08 ± 2.3 |
0.59 |
−0.4 ± 1.4 |
−0.7 ± 1.3 |
0.40 |
|
Δ SPPB (score) |
−0.04 ± 0.7 |
0.1 ± 0.4 |
0.25 |
0.4 ± 0.9 |
0.2 ± 0.8 |
0.28 |
|
Δ Femoral muscle strength (N) |
−12 ± 52 |
−18.6 ± 52 |
0.66 |
5.5 ± 47 |
14.4 ± 38 |
0.18 |
|
Δ Grip strength (kg) |
−0.2 ± 2.5 |
−0.4 ± 3.2 |
0.84 |
−1.2 ± 3.7 |
−0.5 ± 3.6 |
0.46 |
|
Δ IPAQ |
98 ± 1,268 |
308 ± 1,959 |
0.66 |
715 ± 2,041 |
−147 ± 1,699 |
0.07 |
|
Blood measurement |
|
|
|
|
|
|
|
Δ 25(OH)D (ng/mL) |
−1.6 ± 8.8 |
12.3 ± 9 |
0.00*
|
−10.1 ± 9.1 |
1.4 ± 10.4 |
0.00*
|
A muscle index measured by BIA, non-significantly increased in the insufficient group compared with the control group (Δ0 ± 0.7 in the control group vs. Δ0.3 ± 0.6 in the intervention group, insufficient group; p = 0.050). The skeletal muscle mass index (SMMI; kg/m2) was significantly higher in the insufficient group compared with the control group (Δ0.07 ± 0.2 in the control group vs. Δ1 ± 2.2 in the intervention group, insufficient group; p = 0.03).
At 12 weeks, serum 25(OH)D increased from baseline to 12 weeks in the intervention group, in the insufficient group (−Δ1.6 ± 8.8 in the control group vs. Δ12.3 ± 9 in the intervention group, insufficient group; p = 0.00) and increased from baseline to 12 weeks in the intervention group, in the sufficient group (−Δ10.1 ± 9.1 in the control group vs. Δ1.4 ± 10.4 in the intervention group, sufficient group; p = 0.00) (
Table 2).
The dietary intakes of the participants were measured at every visit (
Table 3). Usual meal intake was evaluated excluding supplement intake. We found that vitamin D (μg) intake decreased significantly after 12 weeks of the intervention group only in the sufficient group (p = 0.02).
Table 3Changes of dietary intake during the 12-week study
Table 3
|
Dietary intakes |
Insufficient group (n = 46) |
Sufficient group (n = 65) |
|
Control (n = 23) (12–0 weeks) |
Intervention (n = 23) (12–0 weeks) |
p value |
Control (n = 34) (12–0 weeks) |
Intervention (n = 31) (12–0 weeks) |
p value |
|
Δ Energy (kcal) |
18 ± 414 |
221 ± 857 |
0.31 |
151 ± 407 |
−62.4 ± 500 |
0.06 |
|
Δ Carbohydrate (g) |
−4.1 ± 64 |
46.1 ± 11 |
0.07 |
4 ± 69 |
−20 ± 92.9 |
0.24 |
|
Δ Protein (g) |
2.8 ± 28.7 |
15.3 ± 35.6 |
0.19 |
10.2 ± 22.4 |
−0.4 ± 27.3 |
0.08 |
|
Δ Fat (g) |
3.5 ± 26 |
−0.7 ± 37.3 |
0.65 |
9.8 ± 21.7 |
1.7 ± 25.3 |
0.17 |
|
Δ Vitamin A (ugRAE) |
26.4 ± 303 |
62.5 ± 630 |
0.80 |
−49.8 ± 453 |
−31.2 ± 397 |
0.86 |
|
Δ Vitamin D (ug) |
1.3 ± 5.5 |
0.2 ± 7.4 |
0.58 |
2.2 ± 5.7 |
−0.8 ± 4.6 |
0.02*
|
|
Δ Vitamin E |
−0.8 ± 9.2 |
1.3 ± 13.7 |
0.53 |
1.4 ± 9.6 |
−0.07 ± 11.7 |
0.56 |
|
Δ Vitamin K |
60 ± 257 |
149.5 ± 413 |
0.38 |
131.9 ± 494 |
40.1 ± 285 |
0.37 |
|
Δ Thiamin (mg) |
0.06 ± 0.4 |
0.2 ± 0.8 |
0.53 |
0.2 ± 0.6 |
0.1 ± 0.1 |
0.46 |
|
Δ Riboflavin(mg) |
0.4 ± 0.9 |
0.05 ± 0.7 |
0.15 |
0.3 ± 0.7 |
−0.06 ± 0.7 |
0.05 |
|
Δ Niacin (mgNE) |
1.7 ± 6.1 |
3.9 ± 8.7 |
0.31 |
1.6 ± 4.6 |
−1.1 ± 6.6 |
0.05 |
|
Δ Vitamin B6 (mg) |
−0.03 ± 2.1 |
0.9 ± 2.8 |
0.19 |
1.2 ± 4.1 |
0.5 ± 3.6 |
0.44 |
|
Δ Calcium (mg) |
71.8 ± 330 |
77 ± 295 |
0.95 |
92.8 ± 313 |
−91.3 ± 353 |
0.03*
|
|
Δ Isoleucine (mg) |
544 ± 1,692 |
900 ± 1,282 |
0.42 |
193 ± 1,312 |
184 ± 1,408 |
0.10 |
|
Δ Leucine (mg) |
234 ± 125 |
614 ± 121 |
0.22 |
234 ± 759 |
36.82 ± 930 |
0.35 |
|
Δ Lysine (mg) |
333 ± 858 |
276 ± 554 |
0.79 |
450 ± 442 |
−1.85 ± 614 |
0.29 |
|
Δ Valine (mg) |
340 ± 202 |
294 ± 513 |
0.79 |
439 ± 997 |
−81 ± 467 |
0.10 |
DISCUSSION
Kang et al. [
19], previously investigated the effects of a 12-week leucine-enriched protein supplementation specifically affecting muscle synthesis in healthy Korean adults and older adults. It was demonstrated that a complex of leucine-enriched protein, calcium, and vitamin D, which has a significant impact on muscle growth, can prevent and improve sarcopenia [
19]. In this study, an in-depth analysis examined the relationship between vitamin D, a nutrient that affects muscle mass, and muscle health by dividing it into deficient and sufficient groups based on the serum 25(OH)D level. We investigated whether providing a protein mixture with vitamin D helped maintain or strengthen muscle health in people over 50 years old who lack sufficient serum 25(OH)D levels and/or whether the serum 25(OH)D concentration can reach normal or sufficient levels. Although 12 weeks of nutritional intervention did not lead to a significant improvement in SPPB or muscle strength, in the insufficient group with a low 25(OH)D concentration, skeletal muscle mass was improved. This suggests that the complex may normalize vitamin D and improve muscle health.
This area of research is primarily focused on the acute effects of muscle protein synthesis in frail older people who have experienced significant muscle loss. In studies of healthy middle-aged and older people, only a few long-term supplemental intervention studies have been conducted to evaluate changes that improve sarcopenia. In a study by Chanet et al. [
25], which studied muscle protein synthesis (MPS) data for vitamin D, investigated the role of vitamin D deficiency on reduced MPS through its impact on ectopic lipid accumulation and related intracellular signaling pathways. In this study, they developed 15-month-old rats fed a diet low in vitamin D. As a result, it was confirmed that animals with vitamin D deficiency initially did not have hypercalcemia/hyperphosphatemia when supplemented with vitamin D for 3 months, and serum 25(OH)D concentration increased more than 10 times. In addition, the results of recent studies in humans are similar to those in animals. The mechanism behind the reduction in muscle protein synthesis due to vitamin D deficiency was at least in part due to the activation of the eIF2α stress sensor. Interestingly, vitamin D supplementation in vitamin D deficient mice prevented this change. The results of this paper have not been verified in humans, but support that vitamin D is a major metabolic regulator of muscle cells and contributes to the prevention and optimal management of sarcopenia. Our results are supported by those of intervention studies showing improved muscle strength and functional performance after vitamin D supplementation in older people with 25(OH)D deficiency [
3,
14,
16,
26]. However, administration of oral vitamin D supplementation for 6 months to 98 men and women aged 69 years did not improve quadriceps isokinetic strength compared with placebo [
3,
27]. In addition, the Verreault et al. [
28], study suggested that 628 older women with disabilities were not associated with low vitamin D status and changes in grip strength, knee extensor strength, and hip flexor strength for 3 years. However, it differs from our study in that it included only women with severe disabilities and that most subjects had a significantly lower 25(OH)D status.
Vitamin D, a nutrient that can positively affect muscle mass and increase muscle strength, is a fat-soluble vitamin that is synthesized through skin synthesis and diet. In this case, it is biologically inactive and must be activated to function in humans [
29]. Vitamin D synthesized in the skin or consumed through food enters the blood directly or through the lymphatic system, binds to and circulates with vitamin D-binding protein, and is stored in adipose tissue or converted to 25(OH)D while passing through the liver. It is converted to 1,25-dihydroxyvitamin D (1,25[OH]2D), an active vitamin, through the kidneys [
29,
30]. Active 1, 25(OH)D binds to vitamin D receptors in intestinal chorionic cells, absorbs calcium and phosphorus, and accumulates calcium and phosphorus in bones. The concentration of serum 25(OH)D is about 1,000-times higher than that of 1,25(OH)2D, and 1,25(OH)2D is an active form and has a short time to play its role, so the presence or absence of vitamin D deficiency is determined by serum 25(OH)D [
30]. Insufficient vitamin D may be associated with the development of sarcopenia, which contributes to decreased muscle function. There are many reasons for vitamin D deficiency in older people, such as frequent hospitalizations, decreased skin’s ability to endogenously synthesize vitamin D, and decreased reduced vitamin D receptor (VDR) expression in muscle tissue. Several studies suggest a link between vitamin D deficiency and falls in older adults. A large-scale prospective study confirmed that physical function is mediated by the effect of vitamin D levels on falls, suggesting that decreased muscle function in people with low vitamin D is an important factor in the risk of falls [
29,
30].
However, there are studies showing that even 2,000 IU of vitamin D administration has no effect on protein synthesis in the elderly. van Vliet et al. [
31], conducted clinical trials to evaluate the independent and combined effect of vitamin D supplementation on the rate of muscle fiber protein synthesis and found that the combination of vitamin D or conjugated linoleic acids did not affect the rate of muscle protein synthesis. However, there are differences from our research. We have included leucine, a nutritional supplement that can positively affect muscle mass and increase muscle strength. Leucine is known to have a positive effect on muscle mass by stimulating the mammalian target of rapamycin (mTOR) signaling pathway, increasing muscle protein synthesis and reducing muscle protein breakdown [
32,
33]. In addition, the nutritional supplements in this study also contain calcium, which is involved in muscle contraction and relaxation [
34].
In this study, we are following the collective approach of the European Working Group on Sarcopenia in Older People and the indicator of muscle mass discussed in the Asian Working Group for Sarcopenia with modifications and additions from the perspective of Asians (DXA measurement results [ASMI]: male 7.0 kg/m
2, female 5.4 kg/m
2) as a major effective indicator of change in muscle mass targeting non-muscular reduction subjects. It is most important to measure the decrease in muscle mass objectively when diagnosing the currently presented sarcopenia. Among similar previous studies to diagnose sarcopenia, we used the method proposed by the New Mexico Elder Health Survey as a measure of muscle mass among the diagnostic criteria for sarcopenia [
8]. The skeletal muscle mass index as measured by DXA, the formula of dividing the appendicular skeletal muscle mass of the limb by the square of the height (ASMI), defined as the case where the adult muscle mass decreased by 2 SDs or less in relation to the young adult average [
8]. In Janssen et al. [
35], presented the SMMI (%) by dividing the skeletal muscle mass by the body weight according to the Third National Health and Nutrition Examination Survey (NHANES III) [
36,
37]. At the Foundation for the National Institutes of Health, ASM, measured by DXA, was presented as a standard corrected by body mass index [
35].
BIA was developed as a body composition evaluation method that can be easily used in clinical practice because it is relatively accurate, has a simple test method, is inexpensive, is easy to transport, and is safe. The BIA sends a small alternating current through the body and measures the body’s resistance to this current. Among body components, only body water and dissolved electrolytes can conduct current. Therefore, the total amount of body water can be measured through the measured resistance, and the fat-free mass is estimated by assuming that the total body water occupies a certain part (usually 73%) of the lean mass [
38].
According to DXA measurements in this study, the ASMI increased by 0.07 ± 0.14 in the intervention group of the insufficient group, no change was noted in the sufficient group, and there was no statistical difference in visceral fat mass. On the other hand, unlike the DXA results, which did not differ between the two groups, the BIA measurement results enabled the detection of differences in the sufficient group and insufficient group. The SMM/wt results increased by 0.38 ± 0.69 kg/kg, % after 12 weeks only intervention group of the insufficient group, and no significant difference was found in the sufficient group. In addition, the SMMI result increased by 1.07 ± 0.69 kg/m
2 after 12 weeks in the intervention group of the insufficient group. Bioelectrical impedance equipment, used to obtain the main results of this study, is compact, economical, easy to operate, and convenient to carry compared with DXA equipment, so it is widely used in clinical practice. The DXA measurement method has the disadvantage of being relatively expensive, requiring someone with inspection skills, and immovable [
39,
40]. In addition, component body fat assessment is an important tool for maintaining general health and longevity, and can and does exist for monitoring the effectiveness of diets. DXA is likewise regarded as a standard method for sieve analysis, and BIA with minimal risk and easy application is preferably reported, which may not be possible and has associated risks [
41].
The secondary effective indicators in this study were muscle strength and physical performance (femoral muscle strength, grip strength, SPPB, arm circumference, and calf circumference). There were no significant differences between the two groups with respect to femoral muscle strength, knee extension, grip strength, and SPPB. In an RCT study of healthy Asian young adults and older women, quadriceps muscle strength and 6-minute walking improved between 3 and 6 months, respectively [
42,
43]. However, in this study, protein supplements did not improve muscle strength contrary to our expectations. In addition, similar results involving protein supplements and measuring muscle strength and body performance in the prefrail and frail elderly have shown increased muscle mass (ASM, SMM) and increased walking speed in older adults when observed for 12 weeks [
7]. Furthermore, healthy older men who took medical nutritional drinks (21 g of whey protein, 3 g of leucine, 3 g of fat, 8,000 IU of vitamin D, and 500 mg of calcium) before breakfast for 6 weeks experienced a greater improvement in muscle mass. Elbow and leg muscle masses were higher than those of the control group, but, grip strength and SPPB did not differ between groups [
44]. In this study, muscle function as measured by SPPB was not improved. This is attributed to the average SPPB scores before and after the study being all within the healthy and normal scale provided by the National Institute on Aging, for a total of 11 or more [
45]. Daily physical activity levels assessed by the IPAQ did not change over the course of this study in both groups, supporting the hypothesis that muscle mass was not affected by physical activity.
The dietary intake analysis presented in
Table 3 includes only dietary intakes and excluded nutrients from the supplement. The authors intentionally did not include the nutritional value of the supplement in the dietary intake analysis, to separate, strictly, the changes in dietary intake from the supplemental effects. At baseline, the daily energy intake of both groups did not meet the expected energy requirements of the 2015 Korean Nutrient Intake Standard (Ministry of Health and Welfare) [
46]. After 12 weeks of intervention, only the energy intake of the insufficient group with improved muscle health achieved an intake close to the expected energy requirement of 1,774.124 ± 796.60 kcal (an average of about 2,000 kcal for men and women), which explains that adequate energy intake has a positive effect on muscle health. In addition, in the sufficient group, the intake of vitamin D, calcium, leucine, lysine, and valine significantly decreased after 12 weeks of intervention. As a result of analyzing the meal diary of the insufficient group’s participants, the intake of meat, e.g., egg and chicken dishes such as steamed chicken and grilled chicken, and meat such as samgyetang (chicken soup, 933.70 kcal, carbohydrate 27.99 g, lipid 47.99 g, protein 88.47 g per serving) and galbitang (rib soup, 377.85 kcal, carbohydrates 10.39 g, lipids 24.11 g, protein 35.57 g per serving) increased, as compared to before the experiment. Analysis of these foods was performed with a web-based computer nutrition analysis program (CAN-Pro. ver. 5.0, 2015; The Korean Nutrition Society). On the other hand, in the intervention group of the sufficient group, overall food intake decreased, and the intake of protein and amino acid-source foods decreased. Studies showing an association between sarcopenia and levels of energy and protein intake suggest that increasing energy and protein intake from food as well as supplement intake may help prevent sarcopenia [
47]. Therefore, this study suggests that even in the group with sufficient serum vitamin D, additional appropriate energy intake must be met to increase muscle mass and promote muscle health.
Exercise is considered standard treatment to increase muscle mass and improve body function in people with sarcopenia. However, this study aimed to investigate only the effects of nutritional interventions to rule out the effects of exercise. Serum 25(OH)D concentration increased significantly after 12 weeks in both groups taking the supplement, and further increased in the insufficient group (insufficient group: from 25.11 ± 3.68 ng/mL to 37.47 ± 7.83 ng/mL), (sufficient group: from 41.97 ± 9.34 ng/mL to 43.41 ± 10.79 ng/mL), which shows the result of a change from an insufficient state to a sufficient state for the insufficient group.
There are some limitations to this study. First, we did not strictly instruct subjects concerning which beverage the supplement should be dissolved in, and we had subjects take the supplement at any time of the day. Second, it was difficult to recruit healthy adults who met the selection criteria of this study and, for this reason, the number of participants did not equally match according to age and sex. Third, the 25(OH)D deficient group seems to consume more protein from their diet than the serum 25(OH)D-deficient group, though not significant, than the serum 25(OH)D deficient group, we could not strongly claim that the muscle mass outcome is solely dependent on the leucine + vitamin D supplementation. Despite these limitations, this study has several advantages. This study investigated the intervention effects of protein nutritional beverages reported previously [
19] and deeply analyzed the effect within the intervention group. We also monitored and controlled increased exercise to isolate the effects of protein supplements containing vitamin D. We demonstrated that having normal (sufficient) state of serum 25(OH)D has a positive effect on overall muscle health. Finally, normalization of serum 25(OH)D with sufficient nutrients and energy intake increases muscle mass and has a positive effect on muscle health.
CONCLUSION
In conclusion, we found that, in people with insufficient serum 25(OH)D level, supplemental intake of proteins including vitamin D, calcium, and leucine and adequate energy intake increased muscle mass in middle-aged and older adults and, therefore, could exert a beneficial effect on muscle health.
NOTES
-
Conflict of Interest: C.J. and A.X. are product developers for the company (Maeil Sarcopenia Research Center) that provided the leucine and the placebo for the study, and they performed the blind randomization. C.J. and A.X. never saw any of the participants or saw any of the results in this study. The remaining authors (including the corresponding authors, Y.K.P.) declare that they have no competing interests, and they were blind to the drug treatment until the completion of the study
-
Author Contributions:
Conceptualization: Kang Y, Kim N, Lee Y, An X, Chung YS, Park YK.
Data curation: Kang Y, Kim N, Lee Y, An X, Chung YS, Park YK.
Formal analysis: Kang Y, Kim N, Lee Y, An X, Chung YS, Park YK.
Investigation: Kang Y, Kim N, Lee Y, An X, Chung YS, Park YK.
Methodology: Kang Y, Kim N, Lee Y, An X, Chung YS, Park YK.
Project administration: Kang Y, Kim N, Lee Y, An X, Chung YS, Park YK.
Writing - original draft: Kang Y, Kim N, Lee Y, An X, Chung YS, Park YK.
Writing - review & editing: Kang Y, Kim N, Lee Y, An X, Chung YS, Park YK.
ACKNOWLEDGEMENTS
The authors are grateful for helping with the interventions of the study participants. Thanks to the following people for their help: Kyung Bae Yoon, Su Ryun Lee, and Dong Eun Kim.
REFERENCES
- 1. Park MS, Park J, Ryu SY, Choi SW. 25-Hydroxyvitamin D is associated with osteosarcopenia: the 2009-2011 Korea National Health and Nutrition Examination Survey. J Med Stat Inform 2020;45:139-146.
- 2. Rosenberg IH. Sarcopenia: origins and clinical relevance. J Nutr 1997;127:990S-1S.
- 3. Visser M, Deeg DJ, Lips P. Longitudinal Aging Study Amsterdam. Low vitamin D and high parathyroid hormone levels as determinants of loss of muscle strength and muscle mass (sarcopenia): the Longitudinal Aging Study Amsterdam. J Clin Endocrinol Metab 2003;88:5766-5772.
- 4. Roubenoff R, Parise H, Payette HA, Abad LW, D’Agostino R, Jacques PF, Wilson PW, Dinarello CA, Harris TB. Cytokines, insulin-like growth factor 1, sarcopenia, and mortality in very old community-dwelling men and women: the Framingham Heart Study. Am J Med 2003;115:429-435.
- 5. Kim YJ. Associations between eating frequency and dietary nutrients and muscle mass (Korean National Health and Nutrition Survey 2008-2009)[doctoral dissertation]. Seoul: Seoul National University; 2013.
- 6. Stipanuk MH. Leucine and protein synthesis: mTOR and beyond. Nutr Rev 2007;65:122-129.
- 7. Park Y, Choi JE, Hwang HS. Protein supplementation improves muscle mass and physical performance in undernourished prefrail and frail elderly subjects: a randomized, double-blind, placebo-controlled trial. Am J Clin Nutr 2018;108:1026-1033.
- 8. Baumgartner RN, Koehler KM, Gallagher D, Romero L, Heymsfield SB, Ross RR, Garry PJ, Lindeman RD. Epidemiology of sarcopenia among the elderly in New Mexico. Am J Epidemiol 1998;147:755-763.
- 9. Baczynski R, Massry SG, Kohan R, Magott M, Saglikes Y, Brautbar N. Effect of parathyroid hormone on myocardial energy metabolism in the rat. Kidney Int 1985;27:718-725.
- 10. Boland R. Role of vitamin D in skeletal muscle function. Endocr Rev 1986;7:434-448.
- 11. Schleithoff SS, Zittermann A, Tenderich G, Berthold HK, Stehle P, Koerfer R. Vitamin D supplementation improves cytokine profiles in patients with congestive heart failure: a double-blind, randomized, placebo-controlled trial. Am J Clin Nutr 2006;83:754-759.
- 12. Jung HC, Seo MW, Lee S, Jung SW, Song JK. Correcting vitamin D insufficiency improves some but not all aspects of physical performance during winter training in taekwondo athletes. Int J Sport Nutr Exerc Metab 2018;28:635-643.
- 13. Holick MF, Matsuoka LY, Wortsman J. Age, vitamin D, and solar ultraviolet. Lancet 1989;2:1104-1105.
- 14. Gloth FM 3rd, Smith CE, Hollis BW, Tobin JD. Functional improvement with vitamin D replenishment in a cohort of frail, vitamin D-deficient older people. J Am Geriatr Soc 1995;43:1269-1271.
- 15. Dhesi JK, Bearne LM, Moniz C, Hurley MV, Jackson SH, Swift CG, Allain TJ. Neuromuscular and psychomotor function in elderly subjects who fall and the relationship with vitamin D status. J Bone Miner Res 2002;17:891-897.
- 16. Samson MM, Meeuwsen IB, Crowe A, Dessens JA, Duursma SA, Verhaar HJ. Relationships between physical performance measures, age, height and body weight in healthy adults. Age Ageing 2000;29:235-242.
- 17. Abshirini M, Mozaffari H, Kord-Varkaneh H, Omidian M, Kruger MC. The effects of vitamin D supplementation on muscle strength and mobility in postmenopausal women: a systematic review and meta-analysis of randomised controlled trials. J Hum Nutr Diet 2020;33:207-221.
- 18. Rinaldi I, Setiati S, Oemardi M, Aries W, Tamin TZ. Correlation between serum vitamin D (25(OH)D) concentration and quadriceps femoris muscle strength in Indonesian elderly women living in three nursing homes. Acta Med Indones 2007;39:107-111.
- 19. Kang Y, Kim N, Choi YJ, Lee Y, Yun J, Park SJ, Park HS, Chung YS, Park YK. Leucine-enriched protein supplementation increases lean body mass in healthy Korean adults aged 50 years and older: a randomized, double-blind, placebo-controlled trial. Nutrients 2020;12:1816.
- 20. WHO Scientific Group on the Prevention and Management of Osteoporosis. Prevention and management of osteoporosis: report of a WHO scientific group (No. 921). Geneva: World Health Organization; 2003.
- 21. Ross AC, Taylor CL, Yaktinea AL, Del Valle HB. Dietary reference intakes for calcium and vitamin D. Washington, D.C.: The National Academies Press; 2011.
- 22. Dawson-Hughes B, Heaney RP, Holick MF, Lips P, Meunier PJ, Vieth R. Estimates of optimal vitamin D status. Osteoporos Int 2005;16:713-716.
- 23. Kim TN, Choi KM. Sarcopenic obesity. J Korean Diabetes 2013;14:166-173.
- 24. Kim JW, Lee SY. Current methods of human body composition assessment. Korean J Obes 2015;24:184-189.
- 25. Chanet A, Salles J, Guillet C, Giraudet C, Berry A, Patrac V, Domingues-Faria C, Tagliaferri C, Bouton K, Bertrand-Michel J, Van Dijk M, Jourdan M, Luiking Y, Verlaan S, Pouyet C, Denis P, Boirie Y, Walrand S. Vitamin D supplementation restores the blunted muscle protein synthesis response in deficient old rats through an impact on ectopic fat deposition. J Nutr Biochem 2017;46:30-38.
- 26. Prabhala A, Garg R, Dandona P. Severe myopathy associated with vitamin D deficiency in western New York. Arch Intern Med 2000;160:1199-1203.
- 27. Grady D, Halloran B, Cummings S, Leveille S, Wells L, Black D, Byl N. 1,25-Dihydroxyvitamin D3 and muscle strength in the elderly: a randomized controlled trial. J Clin Endocrinol Metab 1991;73:1111-1117.
- 28. Verreault R, Semba RD, Volpato S, Ferrucci L, Fried LP, Guralnik JM. Low serum vitamin d does not predict new disability or loss of muscle strength in older women. J Am Geriatr Soc 2002;50:912-917.
- 29. Shin MY, Kwun IS. Vitamin D: hormone-like nutrient. J Nutr Health 2016;49:1-7.
- 30. Choi HJ. New insight into the action of vitamin D. Korean J Fam Med 2011;32:89-96.
- 31. van Vliet S, Fappi A, Reeds DN, Mittendorfer B. No independent or combined effects of vitamin D and conjugated linoleic acids on muscle protein synthesis in older adults: a randomized, double-blind, placebo-controlled clinical trial. Am J Clin Nutr 2020;112:1382-1389.
- 32. Jewell JL, Russell RC, Guan KL. Amino acid signalling upstream of mTOR. Nat Rev Mol Cell Biol 2013;14:133-139.
- 33. Pasiakos SM. Exercise and amino acid anabolic cell signaling and the regulation of skeletal muscle mass. Nutrients 2012;4:740-758.
- 34. Szent-Györgyi AG. Calcium regulation of muscle contraction. Biophys J 1975;15:707-723.
- 35. Janssen I, Heymsfield SB, Ross R. Low relative skeletal muscle mass (sarcopenia) in older persons is associated with functional impairment and physical disability. J Am Geriatr Soc 2002;50:889-896.
- 36. Deng X, Song Y, Manson JE, Signorello LB, Zhang SM, Shrubsole MJ, Ness RM, Seidner DL, Dai Q. Magnesium, vitamin D status and mortality: results from US National Health and Nutrition Examination Survey (NHANES) 2001 to 2006 and NHANES III. BMC Med 2013;11:187.
- 37. Cashman KD, Dowling KG, Škrabáková Z, Gonzalez-Gross M, Valtueña J, De Henauw S, Moreno L, Damsgaard CT, Michaelsen KF, Mølgaard C, Jorde R, Grimnes G, Moschonis G, Mavrogianni C, Manios Y, Thamm M, Mensink GB, Rabenberg M, Busch MA, Cox L, Meadows S, Goldberg G, Prentice A, Dekker JM, Nijpels G, Pilz S, Swart KM, van Schoor NM, Lips P, Eiriksdottir G, Gudnason V, Cotch MF, Koskinen S, Lamberg-Allardt C, Durazo-Arvizu RA, Sempos CT, Kiely M. Vitamin D deficiency in Europe: pandemic? Am J Clin Nutr 2016;103:1033-1044.
- 38. Cho YG, Kang JH, Kim KA. Comparison of bioelectrical impedance analysis with dual energy X-ray absorptiometry in obese women. Korean J Obes 2007;16:50-57.
- 39. Lim S. Various methods of analysing body composition. Korean J Obes 2010;19:155-158.
- 40. Marra M, Sammarco R, De Lorenzo A, Iellamo F, Siervo M, Pietrobelli A, Donini LM, Santarpia L, Cataldi M, Pasanisi F, Contaldo F. Assessment of body composition in health and disease using bioelectrical impedance analysis (BIA) and dual energy X-ray absorptiometry (DXA): a critical overview. Contrast Media Mol Imaging 2019;2019:3548284.
- 41. Lim S. Utility of bioelectrical impedance analysis for body composition assessment. J Korean Diabetes 2022;23:106-112.
- 42. Chang CI, Chen CY, Huang KC, Wu CH, Hsiung CA, Hsu CC, Chen CY. Comparison of three BIA muscle indices for sarcopenia screening in old adults. Eur Geriatr Med 2013;4:145-149.
- 43. Van Roie E, Verschueren SM, Boonen S, Bogaerts A, Kennis E, Coudyzer W, Delecluse C. Force-velocity characteristics of the knee extensors: an indication of the risk for physical frailty in elderly women. Arch Phys Med Rehabil 2011;92:1827-1832.
- 44. Chanet A, Verlaan S, Salles J, Giraudet C, Patrac V, Pidou V, Pouyet C, Hafnaoui N, Blot A, Cano N, Farigon N, Bongers A, Jourdan M, Luiking Y, Walrand S, Boirie Y. Supplementing breakfast with a vitamin D and leucine–enriched whey protein medical nutrition drink enhances postprandial muscle protein synthesis and muscle mass in healthy older men. J Nutr 2017;147:2262-2271.
- 45. Oh B, Cho B, Choi HC, Son KY, Park SM, Chun S, Cho SI. The influence of lower-extremity function in elderly individuals’ quality of life (QOL): an analysis of the correlation between SPPB and EQ-5D. Arch Gerontol Geriatr 2014;58:278-282.
- 46. Ministry of Health and Welfare. The Korean Nutrition Society. Dietary reference intakes for Koreans 2015. Sejong: Ministry of Health and Welfare; 2016.
- 47. Na W, Oh D, Hwang S, Chung B, Sohn C. Association between sarcopenia and energy and protein intakes in community-dwelling elderly. Korean J Community Nutr 2022;27:286-295.