ABSTRACT
The prevalence of metabolic syndrome (MetS) and its cost are increasing due to lifestyle changes and aging. This study aimed to develop a deep neural network model for prediction and classification of MetS according to nutrient intake and other MetS-related factors. This study included 17,848 individuals aged 40–69 years from the Korea National Health and Nutrition Examination Survey (2013–2018). We set MetS (3–5 risk factors present) as the dependent variable and 52 MetS-related factors and nutrient intake variables as independent variables in a regression analysis. The analysis compared and analyzed model accuracy, precision and recall by conventional logistic regression, machine learning-based logistic regression and deep learning. The accuracy of train data was 81.2089, and the accuracy of test data was 81.1485 in a MetS classification and prediction model developed in this study. These accuracies were higher than those obtained by conventional logistic regression or machine learning-based logistic regression. Precision, recall, and F1-score also showed the high accuracy in the deep learning model. Blood alanine aminotransferase (β = 12.2035) level showed the highest regression coefficient followed by blood aspartate aminotransferase (β = 11.771) level, waist circumference (β = 10.8555), body mass index (β = 10.3842), and blood glycated hemoglobin (β = 10.1802) level. Fats (cholesterol [β = −2.0545] and saturated fatty acid [β = −2.0483]) showed high regression coefficients among nutrient intakes. The deep learning model for classification and prediction on MetS showed a higher accuracy than conventional logistic regression or machine learning-based logistic regression.
-
Keywords: Deep learning; Metabolic syndrome; Korea National Health and Nutrition Examination Survey (KNHANES); Nutrient intake,
INTRODUCTION
Metabolic syndrome (MetS), a cluster of metabolic disorders, which is characterized by three or more risk factors including a large waist circumference (WC; elevated abdominal adiposity), high blood pressure, increased fasting blood glucose e, a high blood triglycerides (TGs) concentration and a low blood high-density lipoprotein cholesterol (HDL-C) [
1,
2,
3]. Insulin resistance is proposed as a common etiology of each factor of MetS [
4,
5,
6].
MetS can increase prevalence of type 2 diabetes mellitus (T2DM) and cardiovascular diseases (CVDs) [
7,
8,
9]. The persistently elevating trend in the prevalence of MetS is observed worldwide [
10,
11]. The prevalence of MetS was assessed among US individuals aged over 20 years based on data from the National Health and Nutrition Examination Survey (NHANES) 2011–2016. The prevalence of MetS among 17,048 subjects was 34.7% in 2011–2016, with an insignificant increase between 2011–2012 (32.5%) and 2015–2016 (36.9%). A significant increase in MetS prevalence was observed with increasing age from 19.5% in subjects aged 20–39 years and 48.6% in subjects aged over 60 years. Notably, the MetS prevalence was rapidly growing among young adults and Hispanic and Asian subjects [
12]. The data from Korean National Health Insurance Service reflecting approximately 10 million people annually, which was approximately 20% of the Korean population, showed the increased MetS prevalence after adjustment for age in subjects aged over 30 years from 28.84% in 2009 to 30.52% in 2013 [
13].
MetS treatment aims to lower abdominal obesity, blood pressure, blood glucose, blood TG levels, and raise blood HDL-C levels to prevent T2DM and CVDs. Lifestyle modification is vital to reduce risk of MetS [
1,
2,
3]. Medical expenses for MetS are likely to increase worldwide [
14,
15]. The prevention for MetS will become increasingly crucial by identifying MetS risk factors encouraging people to lead healthy lifestyles [
16]. Factors including age, family history, smoking, physical activity, diet, alcohol and so on, can influence MetS prevalence [
2,
17]. One of modifiable factors is a diet. Dietary patterns high in fiber/low-glycemic-index, fruits, vegetables, fish and low in saturated fat, sodium is associated with a lower risk of MetS [
17,
18,
19,
20,
21,
22]. The effective management of MetS-related factors could facilitate the prevention and management of MetS.
Deep learning is a technique of machine learning in artificial intelligence area. Deep learning makes use of deep neural networks (DNNs) to model complex non-linear relationships and thus is able to solve real-life problems. A DNN often consists of an input layer, multiple hidden layers, and an output layer. Each layer generally implements some non-linear operations that transform the representation at one level into another representation at a more abstract level. Deep learning showed a high accuracy with a big data [
23,
24,
25].
Recently, a machine learning model was developed for MetS prediction [
26,
27]. Choe et al. [
26] used MetS factors including 10 single nucleotide polymorphisms (SNPs) genetic information, age, sex, body mass index (BMI), smoking, alcohol, physical activity in non-obese Koreans for MetS prediction using 5 machine learning techniques such as multilayer perceptron (MLP), naïve Bayes classification (NB); random forest (RF), decision tree classification (DT) and support vector machine classification (SVM) [
26]. However, few studies on the classification and prediction of MetS using nutrient intake and MetS-related factors existed based on the data of Korea National Health and Nutrition Examination Survey (KNHANES). Therefore, this study aimed to build an optimal MetS classification and prediction model including MetS-related factors by using deep learning techniques based on Korean subject data.
MATERIALS AND METHODS
Data and subjects
We used data from the health, screening, and nutrition surveys of the 6–7th KNHANES (2013–2018) conducted by Korea Centers for Disease Control and Prevention (KCDC) under the Korean Ministry of Health and Welfare [
28]. KNHANES is a national health examination survey of collecting data on subjects’ status of social, economic, nutritional and health (healthcare utilization, anthropometric measures, biochemical and clinical analysis, quality of life, health behaviours and so on) through a health interview survey, a health behaviours survey, a health examination survey and a nutrition survey [
28]. A nutrition survey was conducted with investigation on dietary behaviour, dietary supplement use, food security, food frequency, food and dietary intake in a face-to-face interview method. Nutrient intake was accessed by the 24-hour recall method for clarifying usual dietary intake of subjects, and by a validated food-frequency questionnaire (FFQ) consisting of 63 food items [
29,
30,
31,
32].
In this study, nutrient intake per 1,000 kcal was calculated, considering that most of the nutrient intake was proportional to the total daily caloric intake. We excluded missing values of nutrient intake. Missing values of categorical variables were replaced with the mode values, and missing values of continuous variables were replaced with mean values. The final sample included 17,848 subjects aged 40–69 years who had previously given their consent. The study was conducted with the approval of the Research Ethics Review Committee of the Korea Centers for Disease Control and Prevention where appropriate (IRB No. 2013-07CON-03-4C, 2013-12EXP-03-5C, 2015-01-02-6C, 2018-01-03-P-A).
Variable classification
A total of 52 variables of general characteristics and nutrient intake were set as independent variables (
Table 1,
Supplementary Table 1). Independent variables were summarised in
Supplementary Table 1. In the case of the sex column, it is categorical data divided by 1 for men and 2 for women. In this case, the size can be interpreted as an incorrect relationship. Therefore, numerical data was created and used as an input value by using the one-hot encoding technique. MetS was set as a dependent variable (
Table 2). The problem of multicollinearity was considered important to explain the relationship between independent variables in traditional statistical analysis [
33]. Multicollinearity issues was not considered in machine learning/deep learning [
33] because machine learning/deep learning is focused on finding prediction and classification models [
33].
Table 1Baseline characteristics of subjects included as independent variables
Table 1
|
Variable (code) with variable description |
MetS (n = 5,708) |
Non-MetS (n = 12,140) |
p value |
Train data |
Test data |
|
Sex (Sex) |
|
|
< 0.001 |
|
|
|
1 = Male |
2,753 (48.2%) |
4,748 (39.1%) |
6,029 |
1,472 |
|
2 = Female |
2,955 (51.8%) |
7,392 (60.9%) |
8,249 |
2,098 |
|
Age (Age)*
|
|
|
< 0.001 |
|
|
|
40–69 years |
58.0, 51.0 |
53.0, 46.0 |
14,278 |
3,570 |
|
Waist circumference (HE_WC)*
|
89.3, 83.8 |
80.0, 74.1 |
0.000 |
|
|
|
Body mass index (kg/m2) (HE_BMI)*
|
26.0, 24.0 |
23.2, 21.3 |
0.000 |
24.1 (14.2–44.4) |
24.0 (15.2–42.9) |
|
Energy intake after energy intake adjustment (kcal/day) (N_EN)*
|
1,837.0, 1,386.3 |
1,846.5, 1,414.0 |
0.423 |
1,988.6 (52.8–19,806.1) |
1,988.6 (52.8–19,806.1) |
|
Protein intake after energy intake adjustment (g/day) (N_PROT)*
|
32.8, 27.9 |
33.5, 28.4 |
< 0.001 |
34.6 (0.0–175.6) |
34.6 (0.0–175.6) |
|
Fat intake after energy intake adjustment (g/day) (N_FAT)*
|
16.7, 11.4 |
19.0, 13.1 |
< 0.001 |
19.5 (0.0–73.0) |
19.5 (0.0–73.0) |
|
Saturated fatty acid intake after energy intake adjustment (g/day) (N_SFA)*
|
4.7, 2.9 |
5.4, 3.5 |
< 0.001 |
5.8 (0.0–32.5) |
5.8 (0.0–32.5) |
|
Monounsaturated fatty acid intake after energy intake adjustment (g/day) (N_MUFA)*
|
4.8, 3.0 |
5.6, 3.5 |
< 0.001 |
6.0 (0.0–37.7) |
6.0 (0.0–37.7) |
|
Polyunsaturated fatty acid intake after energy intake adjustment (g/day) (N_PUFA)*
|
4.4, 2.9 |
4.8, 3.2 |
< 0.001 |
5.2 (0.0–30.7) |
5.2 (0.0–43.9) |
|
n-3 fatty acid intake after energy intake adjustment (g/day) (N_N3)*
|
0.6, 0.3 |
0.6, 0.4 |
< 0.001 |
0.9 (0.0–43.9) |
0.9 (0.0–43.9) |
|
n-6 fatty acid intake after energy intake adjustment (g/day) (N_N6)*
|
3.6, 2.3 |
3.9, 2.6 |
< 0.001 |
4.3 (0.0–26.7) |
4.3 (0.0–26.7) |
|
Cholesterol intake after energy intake adjustment (mg/day) (N_CHOL)*
|
77.0, 34.5 |
91.4, 44.0 |
< 0.001 |
109.6 (0.0–2,205.2) |
109.6 (0.0–2,025.2) |
|
Carbohydrate intake after energy intake adjustment (g/day) (N_CHO) |
169.1, 143.8 |
165.1, 141.8 |
< 0.001 |
161.2 (0.0–224.5) |
161.2 (0.0–244.5) |
|
Fiber intake after energy intake adjustment (g/day) (N_TDF)*
|
13.2, 9.7 |
13.2, 9.8 |
0.888 |
14.2 (0.0–66.0) |
14.2 (0.0–66.0) |
|
Calcium intake after energy intake adjustment (mg/day) (N_CA)*
|
235.4, 176.4 |
243.7, 181.9 |
< 0.001 |
272.1 (0.0–3,114.4) |
272.1 (0.0–3,114.4) |
|
Phosphorus intake after energy intake adjustment (mg/day) (N_PHOS)*
|
532.0, 450.0 |
543.5, 461.9 |
< 0.001 |
556.6 (0.0–2,120.7) |
556.6 (0.0–2,120.7) |
|
Iron intake after energy intake adjustment (mg/day) (N_FE)*
|
6.9, 5.4 |
7.0, 5.5 |
0.011 |
8.0 (0.0–1,284.3) |
8.0 (0.0–1,284.3) |
|
Sodium intake after energy intake adjustment (mg/day) (N_NA)*
|
1,697.8, 1,250.1 |
1,711.3, 1,267.4 |
0.141 |
1,871.9 (0.0–18,562.7) |
1,871.9 (0.0–18.562.7 |
|
Potassium intake after energy intake adjustment (mg/day) (N_K)*
|
1,499.1, 1,198.2 |
1,535.6, 1,247.6 |
< 0.001 |
1,618 (0.0–8,531.9) |
1,618 (0.0–8,531.9) |
|
Vitamin A (retinol equivalent) intake after energy intake adjustment (μgRE/day) (N_VA)*
|
264.9, 163.2 |
277.4, 179.9 |
< 0.001 |
365.1 (0.0–15,511.0) |
365.1 (0.0–15,511.0) |
|
Beta-carotene intake after energy intake adjustment (μg/day) (N_CAROT)*
|
1,274.9, 733.1 |
1,311.9, 779.1 |
0.003 |
1,828.5 (0.0–93,087.5) |
1,828.5 (0.0–93,087.5) |
|
Retinol intake after energy intake adjustment (μg/day) (N_RETIN)*
|
28.6, 8.1 |
34.2, 12.3 |
< 0.001 |
56.4 (0.0–5,216.7) |
56.4 (0.0–5,216.7) |
|
Thiamine intake after energy intake adjustment (mg/day) (N_B1)*
|
0.7, 0.6 |
0.8, 0.6 |
< 0.001 |
0.8 (0.0–5.0) |
0.8 (0.0–5.0) |
|
Riboflavin intake after energy intake adjustment (mg/day) (N_B2)*
|
0.6, 0.5 |
0.7, 0.5 |
< 0.001 |
0.7 (0.0–4.1) |
0.7 (0.0–4.1) |
|
Niacin intake after energy intake adjustment (mg/day) (N_NIAC)*
|
6.8, 5.4 |
7.1, 5.7 |
< 0.001 |
7.5 (0.0–47.0) |
7.5 (0.0–47.0) |
|
Vitamin C intake after energy intake adjustment (mg/day) (N_VITC)*
|
|
|
< 0.001 |
|
|
Table 2Metabolic syndrome as dependent variables
Table 2
|
Diagnostic factors |
Code |
Description |
MetS (n = 5,708) (%) |
Non-MetS (n = 12,140) (%) |
p value |
Train data |
Test data |
|
Blood pressure |
HE_SBP_A3*
|
Average of 3 measurements systolic blood pressure |
127.3, 117.3 |
116.0, 106.0 |
0.000 |
120.2 (79.3–243.3) |
119.8 (79.3–198.6) |
|
HE_DBP_A3*
|
Average of 3 measurement diastolic blood pressure |
80.6, 73.3 |
75, 69 |
< 0.001 |
77.2 (40.0–147.3) |
76.9 (41.3–135.3) |
|
DI1_2 |
Taking blood pressure medication |
|
|
0.000 |
|
|
|
1 = Taking blood pressure medications daily |
2,433 (42.6%) |
1,100 (9.1%) |
28,204 |
709 |
|
2 = Taking blood pressure medication 20 days a month |
65 (1.1%) |
38 (0.3%) |
77 |
26 |
|
3 = Taking blood pressure medication at least 15 days a month |
12 (0.2%) |
14 (0.1%) |
23 |
3 |
|
4 = Taking blood pressure medication less than 15 days a month |
9 (0.2%) |
12 (0.1%) |
19 |
2 |
|
5 = Don’t take blood pressure medication |
151 (2.6%) |
205 (1.7%) |
294 |
62 |
|
8 = Not applicable |
2,951 (51.7%) |
10,485 (86.4%) |
10,761 |
2,675 |
|
9 = Don’t know, no response |
87 (1.5%) |
286 (2.4%) |
280 |
93 |
|
Waist circumference |
HE_WC*
|
Waist circumference |
89.3, 83.8 |
80.0, 74.1 |
0.000 |
82.51 (52.3–126.4) |
82.52 (52.5–130.0) |
|
Triglyceride |
HE_TG*
|
Triglycerides |
172.0, 124.0 |
103, 72 |
0.000 |
143.6 (20.0–1,921.0) |
142.8 (23.0–2,455.0) |
|
DI2_2 |
Taking medications for dyslipidemia |
|
|
0.000 |
|
|
|
1 = Taking dyslipidemia medications daily |
1,456 (25.5%) |
582 (4.8%) |
1,623 |
415 |
|
2 = Taking dyslipidemia medication 20 days a month |
43 (0.8%) |
31 (0.3%) |
52 |
22 |
|
3 = Taking dyslipidemia medication at least 15 days a month |
7 (0.1%) |
28 (0.2%) |
28 |
7 |
|
4 = Taking dyslipidemia medication less than 15 days a month |
16 (0.3%) |
19 (0.2%) |
31 |
4 |
|
5 = Don’t take dyslipidemia medication |
538 (9.4%) |
692 (5.7%) |
969 |
261 |
|
8 = Not applicable |
3,561 (62.4%) |
10,502 (86.5%) |
11,295 |
2,768 |
|
9 = Don’t know, no response |
87 (1.5%) |
286 (2.4%) |
280 |
93 |
|
HDL cholesterol |
HE_HDL_st2*
|
HDL cholesterol |
43.0, 37.2 |
51.3, 46.7 |
0.000 |
50.8 (5.918–145.2) |
50.6 (8.0–113.9) |
|
Blood glucose |
HE_glu*
|
Fasting blood glucose |
106.0, 100.0 |
95, 89 |
0.000 |
102.9 (49.0–553.0) |
103.0 (48.0–352.0) |
|
DE1_31 |
Insulin injection |
|
|
< 0.001 |
|
|
|
0 = No |
696 (17.0%) |
329 (2.7%) |
1,031 |
267 |
|
1 = Yes |
94 (1.6%) |
50 (0.4%) |
116 |
28 |
|
8 = Not applicable |
4,557 (79.8%) |
11,474 (94.5%) |
12,849 |
3,182 |
|
9 = Don’t know, no response |
88 (1.5%) |
287 (2.4%) |
282 |
93 |
|
DE1_32 |
Taking diabetes medication |
|
|
< 0.001 |
|
|
|
0 = No |
16 (0.3%) |
20 (0.2%) |
29 |
7 |
|
1 = Yes |
1,047 (18.3%) |
359 (3.0%) |
1,118 |
3,288 |
|
8 = Not applicable |
4,557 (79.8%) |
11,474 (94.5%) |
12,849 |
3,182 |
|
9 = Don’t know, no response |
88 (1.5%) |
284 (2.4%) |
282 |
93 |
The number of subjects with MetS and subjects without MetS was 10,810 and 7,038, respectively. MetS diagnosis is based on the obesity treatment guidelines 2020 by the Korean Society for the study of Obesity. This guideline is based on criteria of the modified Third National Cholesterol Education Program Expert Panel on Detection, Evaluation, and Treatment of High Blood Cholesterol in Adults (NCEP-ATP III), and is based on Korean women’s abdominal obesity that Korean Society for Obesity and Abdominal Obesity Diagnosis criteria 2006 was set at a WC of 85 cm or more. Subjects of this study was diagnosed with MetS, when they had met 3 or more of the following criteria: 1) WC ≥ 90 cm for men and ≥ 85 cm for women; 2) blood pressure ≥ 130/85 mmHg, or medication use; 3) fasting blood glucose ≥ 100 mg/dL or medication use; 4) HDL-C < 40 mg/dL for men and < 50 mg/dL for women; 5) TGs ≥ 150 mg/dL or medication use [
34,
35,
36,
37,
38,
39].
The predictive model was implemented with conventional logistic regression, machine learning-based logistic regression, and deep learning. The DNN model was trained and implemented in Python (version 3.8.5). A model was built in PyTorch (version 1.9.0) for the performance improvement. Data preprocessing was performed with dummy for categorical variables. Data was scaled for continuous variables using minmaxscaler operation. For continuous variables, data values were converted between 0 and 1 for each variable. The ranges of all variables were normalized equally. The data of this study were randomly shuffled by setting the batch size of train data to 16. The batch size of the test data was set to 32 and not randomly shuffled. The data were randomly divided into train data and test data in an 8:2 ratio. The model was trained with the train data, and the model was evaluated with the test data.
In our model, we utilized the rectified linear unit (ReLU) function as the activation function for all of the hidden layers except the output layers. The reason behind using ReLU in our model was to get better performance for active user prediction. On the other hand, we used sigmoid function as the activation function in the output layers. The output value of the function was between 0 and 1. The sigmoid function was used for activating the output layers in binary classification problems. It was calculated as follows:
Again, we used the Adam (Adaptive moment of estimation) optimizer function which has been designed specifically for training DNNs. We used 100 epochs for training the model and have used binary cross-entropy as loss function as it measures the performance of a classification model whose number of output was a probability value between 0 and 1, given by following:
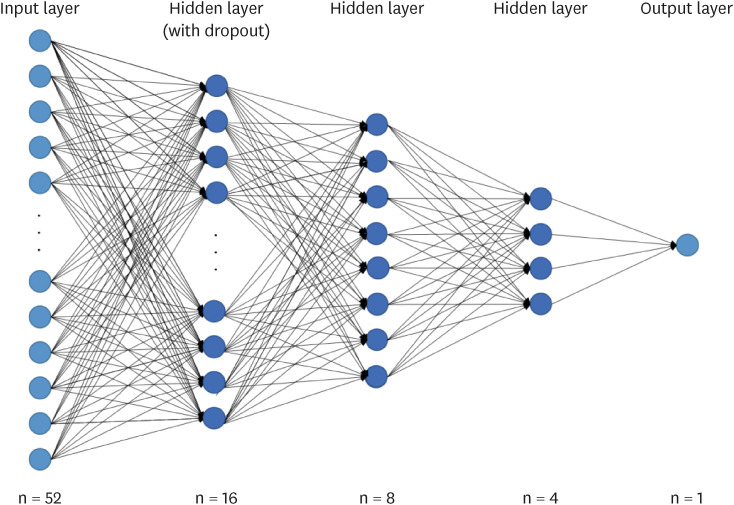
where hat(y) was the predicted probability in the model, y was the corresponding target value. To prevent overfitting, a dropout of 0.01 was applied between the hidden and output layers. The DNN model used in this study is shown in
Figure 1. A predictive model was constructed in which 52 independent were included in the input layer. The hidden layer contained three layers with 16, 8, or 4 nodes. The output layer had one nodes. It was set up to output whether subjects had MetS or subjects did not have MetS.
Figure 1
Prediction deep learning model for metabolic syndrome.
Dropout, a technique for dropping neurons with a probability between 0 and 1 from interconnected layers. Used to prevent overfitting; Hidden Layer, a layer that connects between the input layer and the output layer without computation; Input Layer, a layer that receives input from the dataset; Output Layer, a layer that outputs the result.
We then compared accuracy, precision, recall, and F1 score by deep learning, machine learning logistic regression and conventional logistic regression using the confusion matrix to evaluate mode performance (
Table 3). The prediction results and actual data were presented with confusion matrix form based on true positives (TP), true negatives (TN), false positives (FP), and false negatives (FN). Accuracy indicates the percentage of the total data that was correctly predicted and is calculated as
TP+TNTP+FN+FP+TN. Precision indicates the probability that reality is positive when the prediction result is positive, calculated as
TPFP+TP. Recall refers to sensitivity, which is calculated as
TPFN+TP. Recall refers only to positive predictions. F1-score is calculated as
2×precision×recallprecision+recall.
Table 3Confusion matrix
Table 3
|
Class |
Predicted |
|
Positive |
Negative |
|
Actual |
|
|
|
Positive |
True positive |
False negative |
|
Negative |
False positive |
False negative |
In this study, the importance of variables was determined with regression coefficients (β) to examine the effect of the 52 independent variables on the classification and prediction on MetS (
Table 4). As shown in
Table 4, 52 independent variables in a DNN model were described with 53 variables for values regression coefficients where, a gender was divided into male and female to examine the effect of gender difference on MetS.
Table 4Regression coefficient of independent variables
Table 4
|
Variable |
Code |
Regression coefficient |
|
ALT (blood alanine aminotransferase; SGPT) |
HE_ALT |
12.2035 |
|
AST (blood aspartate aminotransferase; SGOT) |
HE_AST |
11.771 |
|
Waist circumference |
HE_WC |
10.8555 |
|
Body mass index (kg/m2) |
HE_BMI |
10.3842 |
|
Glycated hemoglobin |
HE_HbA1c |
10.1802 |
|
Cholesterol intake after energy intake adjustment (mg/day) |
N_CHOL |
−2.9035 |
|
Niacin intake after energy intake adjustment (mg/day) |
N_NIAC |
−2.0545 |
|
Saturated fatty acid intake after energy intake adjustment (g/day) |
N_SFA |
−2.0483 |
|
Vitamin A (retinol equivalent) intake after energy intake adjustment (μgRE/day) |
N_VA |
−1.9251 |
|
Monounsaturated fatty acid intake after energy intake adjustment (g/day) |
N_MUFA |
−1.8857 |
|
Calcium intake after energy intake adjustment (mg/day) |
N_CA |
−1.872 |
|
Retinol intake after energy intake adjustment (μg/day) |
N_RETIN |
−1.7457 |
|
n-6 fatty acid intake after energy intake adjustment (g/day) |
N_N6 |
−1.6927 |
|
Fat intake after energy intake adjustment (g/day) |
N_FAT |
−1.5581 |
|
Age |
Age |
1.5306 |
|
Riboflavin intake after energy intake adjustment (mg/day) |
N_B2 |
−1.504 |
|
Polyunsaturated fatty acid intake after energy intake adjustment (g/day) |
N_PUFA |
−1.4999 |
|
Vitamin C intake after energy intake adjustment (mg/day) |
N_VITC |
−1.3961 |
|
Beta-carotene intake after energy intake adjustment (μg/day) |
N_CAROT |
−1.3347 |
|
Phosphorus intake after energy intake adjustment (mg/day) |
N_PHOS |
−1.2384 |
|
Protein intake after energy intake adjustment (g/day) |
N_PROT |
−1.2096 |
|
Potassium intake after energy intake adjustment (mg/day) |
N_K |
−1.1856 |
|
Education |
Edu |
−1.1246 |
|
n-3 fatty acid intake after energy intake adjustment (g/day) |
N_N3 |
−0.9903 |
|
Sex, male/female |
Female |
−0.912 |
|
Subjective health status |
D_1_1 |
0.7562 |
|
Whether there is a family member diagnosed with a chronic disease by a doctor |
HE_FH |
0.7373 |
|
Current smoking status |
BS3_1 |
−0.7362 |
|
Whether the mother was diagnosed with high blood pressure by a doctor |
HE_HPfh2 |
0.724 |
|
Whether the mother was diagnosed with diabetes by a doctor |
HE_DMfh2 |
0.7172 |
|
Whether the mother was diagnosed with a stroke by a doctor |
HE_STRfh2 |
0.7088 |
|
Whether the father was diagnosed with a stroke by a doctor |
HE_STRfh1 |
0.6896 |
|
Whether the mother was diagnosed with ischemic heart disease by a doctor |
HE_IHDfh2 |
0.6836 |
|
Whether the father was diagnosed with diabetes by a doctor |
HE_DMfh1 |
0.6817 |
|
Whether the father was diagnosed with high blood pressure by a doctor |
HE_HPfh1 |
0.6681 |
|
Whether the father was diagnosed with ischemic heart disease by a doctor |
HE_IHDfh1 |
0.6637 |
|
Whether the father was diagnosed with hyperlipidemia by a doctor |
HE_HLfh1 |
0.6586 |
|
Thiamine intake after energy intake adjustment (mg/day) |
N_B1 |
−0.6529 |
|
Weight change in 1 year |
BO1_1 |
0.6483 |
|
Whether the mother was diagnosed with hyperlipidemia by a doctor |
HE_HLfh2 |
0.6426 |
|
Iron intake after energy intake adjustment (mg/day) |
N_FE |
0.6328 |
|
Amount of alcohol consumed at one time |
BD2_1 |
0.5812 |
|
Carbohydrate intake after energy intake adjustment (g/day) |
N_CHO |
0.4502 |
|
Number of walking days per week |
BE3_31 |
−0.4073 |
|
Sex, male/female |
Male |
0.3888 |
|
Income quintile (individual) |
Incm5 |
−0.3872 |
|
Weight control for 1 year |
BO2_1 |
−0.3637 |
|
Sodium intake after energy intake adjustment (mg/day) |
N_NA |
−0.3552 |
|
Drinking frequency/year |
BD1_11 |
0.3504 |
|
Average number of cigarettes smoked per day |
BS3_2 |
−0.2388 |
|
Number of days of strength training per week |
BE5_1 |
−0.1606 |
|
Energy intake after energy intake adjustment (kcal/day) |
N_EN |
−0.085 |
|
Fiber intake after energy intake adjustment (g/day) |
N_TDF |
0.063 |
Absolute values were used for regression coefficients, which showed the magnitude of influence of the independent variable on the dependent variable per unit change.
RESULTS
Baseline subject characteristics learning performance evaluation
Baseline characteristics of subjects included as dependent variables are shown in
Table 1. A total of 17, 848 subjects (7,501 males and 10,347 females) was assessed. The mean WC of subjects was 82.5 cm, which was within the normal range. The glycated hemoglobin (HbA1c) level was within the normal range with the mean of 5.83%. Income level was almost evenly distributed when divided into quintiles. High school graduates accounted for the largest number with 7,488 subjects. Subjects of 6,204 responded that they walked every day. Subjects of 2,921 responded that they do not walk at all. Subjects of 13,140 responded that they do not do any strength training per week at all. Subjects of 12,255 responded no change in body weight within 1 year. As for the family history of chronic disease doctor diagnosis, subjects of 11,886 answered “yes” and subjects of 5,715 answered “no”. Subjects of 4,698 answered that their mother had been diagnosed with hypertension. Subjects of 2,184 answered that their mother had been diagnosed with diabetes. The subjects answered that they ate alcohol 2 to 4 times a month (n = 4,439). Subjects 3,192 reported drinking alcohol less than once a month. Overall, subjects of 10,098 answered “not applicable” to their current smoking status. Subjects of 4,573 reported they smoked in the past. Subjects of 14,671 reported that they do not smoke. Subjects of 2,523 answered that they smoke every day. Subjects of 371 answered that they smoke occasionally. Only 83 subjects did not respond to the question on smoking. The mean BMI of subjects was 24 kg/m
2 (
Table 1).
The comparison among accuracy, precision, recall and F1 score is presented in
Table 5, which was calculated by deep learning, machine learning-based logistic regression, and conventional logistic regression.
Table 5Statistical analysis result for the train data and test data
Table 5
|
Evaluation metrics |
Conventional logistic regression |
Machine learning-based logistic regression |
Deep learning |
|
Train data |
|
|
|
|
Train accuracy |
80.9357 |
80.7467 |
81.2089 |
|
Precision |
75.2009 |
75.3824 |
84.2808 |
|
Recall |
59.7666 |
58.5994 |
88.9747 |
|
F1-score |
66.6012 |
65.9398 |
86.5642 |
|
Test data |
|
|
|
|
Val accuracy |
79.7759 |
79.9160 |
81.1485 |
|
Precision |
73.6451 |
74.2457 |
82.8154 |
|
Recall |
59.3830 |
59.0403 |
91.1789 |
|
F1-score |
65.7495 |
65.7757 |
86.7962 |
The deep learning accuracy of train data was 81.2089, which was higher than the conventional logistic regression (80.9357) or machine learning logistic regression (80.7467) as shown in
Table 5. The values of precision, recall and F1-score obtained by deep learning train data were 84.2808, 88.9747 and 86.5642, respectively. The values of precision, recall and F1-score obtained by conventional logistic regression train data were 75.2009, 59.7666, and 66.6012, respectively. The machine learning-based logistic regression train data showed lower values with precision (75.3824), recall (58.5994) and F1-score (65.9398) compared with values obtained by deep learning train data. In test data analysis, the accuracy (81.1485), precision (82.8154), recall (91.1789) and F1-score (86.7962) of deep learning showed higher values than conventional logistic regression and machine learning logistic regression (
Table 5).
Regression coefficient was used in order to examine the effect of each independent variable on MetS (
Table 4). In the analysis of regression coefficient, gender was divided into male and female to investigate the effect of gender difference on MetS. The regression coefficients were compared with absolute values. Blood alanine aminotransferase (ALT; β = 12.2035) and blood asparate aminotransferase (AST; β = 11.771) showed the highest regression coefficient among independent variables. WC (β = 10.8555) and BMI (β = 10.3842). HbA1c (β = 10.1802) was also analyzed as an important independent variable for MetS.
The sixth highest regression coefficient was cholesterol intake (β = −2.9035). It showed the highest value among the variables related to nutrient intake. Niacin intake (β = −2.0545) was analyzed as the 7th highest. Saturated fatty acid intake (β = −2.0483) was analyzed as the 8th highest. Cholesterol and saturated fatty acid were analyzed with high regression coefficient values among fat-related nutrients.
The gender regression coefficient was analyzed in the 24th place for female (β = −0.9120) and 45th for male (β = 0.3888) which indicated that women had more influence on MetS.
In the variable of family (father or/and mother) history of chronic disease (hypertension/diabetes/hyperlipidemia/stroke/ischemic heart disease) the mother’s disease diagnosis showed a higher regression coefficient. The hyperlipidemia diagnosis of a father showed a higher regression coefficient than a mother.
Current smoking status (β = −0.7362) showed the 27th regression coefficient. A body weight change within 1 year (β = 0.6483) showed the 38th regression coefficient. The amount of alcohol consumption at one time (β = 0.5812) showed the 41th regression coefficient. The regression coefficient showed that smoking impacted MetS rather than a body weight change or alcohol intake.
DISCUSSION
This study aimed to classify and predict the risk of MetS with MetS-related components in a DNN model of a deep learning technique. We constructed the DNN model consisting of the hidden layer with 16, 8 or 4 nodes and the output layer with one node. The developed the DNN model of deep learning showed the improved accuracy compared with conventional logistic regression or machine learning-based logistic regression.
Several studies developed MetS prediction models using machine learning techniques [
26,
40,
41,
42]. These studies conducted in a different method of machine learning techniques, sample size, study design and so on. However, these studies did not identified the effect of individual nutrient intake on MetS. Recently, Park et al. [
42] developed MetS prediction model using 6 types of machine learning methods of K-nearest neighbor, naive Bayes, random forest, decision tree, multilayer perceptron, and support vector machine in 2,871 Koreas subjects who visited a medical center for a health check-up. Two machine learning methods of naive-Bayes method showed the highest sensitivity with 0.49 followed by and conventional regression method with 0.39 [
42].
In a machine learning model of decision tree for the MetS prediction with 1,333 Taiwanese subjects which developed by Yu et al. [
40], accuracies and area under the curve (AUC) values of various decision trees in receiver operating characteristic curve analysis were 0.831 for classification and regression trees and 0.904 for the random forest. The most important variable for MetS prediction was obesity, followed by glutamic oxaloacetic transaminase, serum glutamic pyruvic transaminase, a liver steatosis score (controlled attenuation parameter score), and HbA1c.
In consistent the findings by Yu et al. [
40], in regression coefficient analysis of this study, ALT, AST, WC, BMI, and HbA1c showed higher regression coefficients than other variables, suggesting that appropriate management of these components is crucial for the MetS management. In our findings, the highest regression coefficient of blood levels of ALT and AST for liver function indicated the most important independent variable for MetS. Blood levels of ALT and AST are biomarkers for liver function predicted MetS independent of MetS related features [
43].
Hepatic fat content might be associated with liver dysfunction [
44]. Qualitative dietary modification with no weight loss could positively affect liver fat content [
45]. In a randomized controlled trial (RCT) of 45 subjects with T2DM, a diet high in monounsaturated fatty acid (MUFA) for 8 weeks decreased fat content in liver compared with a diet high in carbohydrate and fiber. This reduction in hepatic fat content was independent of an aerobic training program indicating that MUFA intake can exert a vital role in hepatic function [
45].
Given the higher regression coefficients of WC (β = 10.8555) and BMI (β = 10.3842), weight management was suggested to be important to prevent the prevalence of MetS. A l-year randomized controlled clinical trial of 224 subjects (age 18–65 years; BMI 30–45 kg/m
2) showed that approximately 8 kg reduction in body weight was associated with lower risk of MetS [
46]. In mice, a diet enriched in MUFAs attenuated insulin resistance by reducing concentrations of fasting glucose, serum insulin compared with a diet enriched in SFA through AMPK activation [
47]. In a RCT of 59 subjects with MetS or early-stage T2DM, supplementation with fish oil high in n-3 polyunsaturated fatty acids (PUFAs) for 8 weeks showed glucose control by decreasing HbA1c with the borderline of statistical significance in the comparison of a within group [
48].
Regression coefficient indicated that dietary fat intakes of cholesterol, SFAs, MUFAs, a total fat, PUFAs could exert an important role in MetS with the ranks of 6th, 8th, 10th,14th,17th out of 53 independent variables. The prevalence of MetS is associated with cardiovascular risk factors [
49]. In human studies [
49,
50,
51,
52], SFA intake was associated with increased serum cholesterol levels [
50,
51]. An elevated SFA intake was associated with an elevated risk of MetS [
49]. The replacement of SFA intake with unsaturated fatty acid was associated with decreased risks of MetS [
49] and coronary heart disease [
52,
53]. In a meta-analysis of 13 epidemiological studies with 36,542 subjects, increased intake of omega-3 PUFAs reduced risk of MetS by 26% (odds ratio [OR]/relative risk [RR], 0.74; 95% confidence interval [CI], 0.62–0.89) [
54].
Niacin intake was ranked 7th in regression coefficient. Niacin, one of anti-hyperlipidemic medications increases HDL-C concentrations and decreases TG and low-density lipoprotein cholesterol [
55,
56].
In our findings, current smoking status showing the 27th regression coefficient indicated smoking could influence the prevalence of MetS in Korean adults. Consistent with our findings, cross-sectional study of 808 Korean young adults (mean age of 30.9 ± 3.3 years) showed that smokers had a 2.4-fold higher risk of MetS compared with non-smokers. Moreover, smokers had a 2.6-fold increased risk of hypertriglyceridemia and a 3-fold decreased level of HDL-C compared with non-smokers [
57].
In our findings, retinol intake status showed the 12th regression coefficient. In cross-sectional study of the 7th KNHANES (2016 to 2018) with 24,269 subjects, retinol levels were associated with risk of MetS when compared highest retinol levels with lowest retinol levels (OR, 2.351; 95% CI, 1.748–3.163; p
trend < 0.001) [
58].
The present study has strengths. To the best of our knowledge, this is the first deep learning approach for the classification and prediction of MetS with related factors including nutrient intake, lifestyle habits, basic body measurements, and parental disease inheritance in a large sample size using big data of KNHANES. We attempted to develop an optimized DNN model of deep learning with a highly accurate performance by adding as many independent variables of MetS-influencing components as possible. A DNN model for classification and prediction on MetS construed in present study showed considerably improved performance compared with conventional logistic regression or machine learning-based logistic regression.
The present study has limitations. The KNHNES used in this study was based on questionnaires where non-responder and selection bias can exist. Moreover, subjects’ responses to the questionnaires according to their memory, which can lead to recall bias. This study cannot figure out a casual association attributable to the cross-sectional data of the KNHNES. The results obtained through deep learning which the intermediate process for data analysis required other statistical methods to determine the importance of independent variables influencing dependent variables.
In conclusion, a DNN model developed with a big data of KNHNES showed an improved accuracy in classifying and predicting the prevalence of MetS compared with logistic regression or machine learning-based logistic regression.
National Research Foundation of Koreahttps://doi.org/10.13039/501100003725
NRF-2019R1G1A1095767
NOTES
-
Funding: This research was funded by the National Research Foundation of Korea (NRF), grant number NRF-2019R1G1A1095767. The NRF had no role in the study design, data analysis, or writing of this article.
-
Conflict of Interest: The authors declare that they have no competing interests.
-
Author Contributions:
Conceptualization: Kim Y.
Data curation: Lim DH, Kim H, Heo JH.
Formal analysis: Kim H, Heo JH.
Funding acquisition: Kim Y.
Investigation: Kim H.
Methodology: Lim DH, Kim Y.
Project administration: Kim Y.
Resources: Kim Y.
Software: Kim H, Lim DH.
Supervision: Kim Y.
Validation: Kim H, Heo JH, Lim DH.
Visualization: Kim H, Heo JH, Lim DH, Kim Y.
Writing - original draft: Kim H.
Writing - review & editing: Lim DH, Kim Y.
ACKNOWLEDGEMENTS
The study was conducted according to the guidelines of the Declaration of Helsinki. Ethical review and approval were waived for this study, because KNHANES VI-VII was conducted by obtaining the approval of Research Ethics Review Committee of KCDC (2013-07CON-03-4C; 2013-12EXP-03-5C; 2018-01-03-P-A).
SUPPLEMENTARY MATERIAL
Supplementary Table 1
Baseline characteristics of subjects included as independent variables
cnr-12-138-s001.xls
REFERENCES
- 1. Alberti KG, Eckel RH, Grundy SM, Zimmet PZ, Cleeman JI, Donato KA, Fruchart JC, James WP, Loria CM, Smith SC Jr. International Diabetes Federation Task Force on Epidemiology and Prevention. Hational Heart, Lung, and Blood Institute. American Heart Association. World Heart Federation. International Atherosclerosis Society. International Association for the Study of Obesity. Harmonizing the metabolic syndrome: a joint interim statement of the International Diabetes Federation Task Force on Epidemiology and Prevention; National Heart, Lung, and Blood Institute; American Heart Association; World Heart Federation; International Atherosclerosis Society; and International Association for the Study of Obesity. Circulation 2009;120:1640-1645.
- 2. Eckel RH, Grundy SM, Zimmet PZ. The metabolic syndrome. Lancet 2005;365:1415-1428.
- 3. Samson SL, Garber AJ. Metabolic syndrome. Endocrinol Metab Clin North Am 2014;43:1-23.
- 4. Ighbariya A, Weiss R. Insulin resistance, prediabetes, metabolic syndrome: what should every pediatrician know? J Clin Res Pediatr Endocrinol 2017;9:49-57.
- 5. Reaven GM. Insulin resistance: the link between obesity and cardiovascular disease. Med Clin North Am 2011;95:875-892.
- 6. Ferrannini E, Haffner SM, Mitchell BD, Stern MP. Hyperinsulinaemia: the key feature of a cardiovascular and metabolic syndrome. Diabetologia 1991;34:416-422.
- 7. Mottillo S, Filion KB, Genest J, Joseph L, Pilote L, Poirier P, Rinfret S, Schiffrin EL, Eisenberg MJ. The metabolic syndrome and cardiovascular risk a systematic review and meta-analysis. J Am Coll Cardiol 2010;56:1113-1132.
- 8. Scuteri A, Najjar SS, Morrell CH, Lakatta EG. Cardiovascular Health Study. The metabolic syndrome in older individuals: prevalence and prediction of cardiovascular events: the Cardiovascular Health Study. Diabetes Care 2005;28:882-887.
- 9. Wilson PW, D’Agostino RB, Parise H, Sullivan L, Meigs JB. Metabolic syndrome as a precursor of cardiovascular disease and type 2 diabetes mellitus. Circulation 2005;112:3066-3072.
- 10. Borch-Johnsen K. Metabolic syndrome in a global perspective. Significance for public health. Ugeskr Laeger 2006;168:3032-3034.
- 11. Ranasinghe P, Mathangasinghe Y, Jayawardena R, Hills AP, Misra A. Prevalence and trends of metabolic syndrome among adults in the Asia-Pacific region: a systematic review. BMC Public Health 2017;17:101.
- 12. Hirode G, Wong RJ. Trends in the prevalence of metabolic syndrome in the United States, 2011-2016. JAMA 2020;323:2526-2528.
- 13. Lee SE, Han K, Kang YM, Kim SO, Cho YK, Ko KS, Park JY, Lee KU, Koh EH. Taskforce Team of Diabetes Fact Sheet of the Korean Diabetes Association. Trends in the prevalence of metabolic syndrome and its components in South Korea: Findings from the Korean National Health Insurance Service Database (2009-2013). PLoS One 2018;13:e0194490.
- 14. Kim KY, Dong JY, Han SY, Lee KS. The effects of the metabolic syndrome on the total medical charge. Health Policy Manag 2017;27:47-55.
- 15. Scholze J, Alegria E, Ferri C, Langham S, Stevens W, Jeffries D, Uhl-Hochgraeber K. Epidemiological and economic burden of metabolic syndrome and its consequences in patients with hypertension in Germany, Spain and Italy; a prevalence-based model. BMC Public Health 2010;10:529.
- 16. Lee G, Choi HY. Factors associated with dietary control and physical activity in the management of metabolic syndrome in Korean menopausal women. Int J Environ Res Public Health 2020;17:6901.
- 17. Sayón-Orea C, Razquin C, Bulló M, Corella D, Fitó M, Romaguera D, Vioque J, Alonso-Gómez ÁM, Wärnberg J, Martínez JA, Serra-Majem L, Estruch R, Tinahones FJ, Lapetra J, Pintó X, Tur JA, López-Miranda J, Bueno-Cavanillas A, Delgado-Rodríguez M, Matía-Martín P, Daimiel L, Sánchez VM, Vidal J, Vázquez C, Ros E, Ruiz-Canela M, Sorlí JV, Castañer O, Fiol M, Navarrete-Muñoz EM, Arós F, Gómez-Gracia E, Zulet MA, Sánchez-Villegas A, Casas R, Bernal-López R, Santos-Lozano JM, Corbella E, Bouzas C, García-Arellano A, Basora J, Asensio EM, Schröder H, Moñino M, García de la Hera M, Tojal-Sierra L, Toledo E, Díaz-López A, Goday A, Salas-Salvadó J, Martínez-González MA. Effect of a nutritional and behavioral intervention on energy-reduced Mediterranean diet adherence among patients with metabolic syndrome: interim analysis of the PREDIMED-Plus randomized clinical trial. JAMA 2019;322:1486-1499.
- 18. Riccardi G, Rivellese AA. Dietary treatment of the metabolic syndrome--the optimal diet. Br J Nutr 2000;83(Suppl 1):S143-S148.
- 19. Agodi A, Maugeri A, Kunzova S, Sochor O, Bauerova H, Kiacova N, Barchitta M, Vinciguerra M. Association of dietary patterns with metabolic syndrome: results from the Kardiovize Brno 2030 study. Nutrients 2018;10:898.
- 20. Cho YA, Kim J, Cho ER, Shin A. Dietary patterns and the prevalence of metabolic syndrome in Korean women. Nutr Metab Cardiovasc Dis 2011;21:893-900.
- 21. Soltani S, Kolahdouz Mohammadi R, Shab-Bidar S, Vafa M, Salehi-Abargouei A. Sodium status and the metabolic syndrome: a systematic review and meta-analysis of observational studies. Crit Rev Food Sci Nutr 2019;59:196-206.
- 22. Castro-Barquero S, Ruiz-León AM, Sierra-Pérez M, Estruch R, Casas R. Dietary strategies for metabolic syndrome: a comprehensive review. Nutrients 2020;12:2983.
- 23. LeCun Y, Bengio Y, Hinton G. Deep learning. Nature 2015;521:436-444.
- 24. Charniak E. Introduction to deep learning. Cambridge (MA): The MIT Press; 2019.
- 25. Chollet F. Deep learning with python. Shelter Island (NY): Manning Publications Company; 2017.
- 26. Choe EK, Rhee H, Lee S, Shin E, Oh SW, Lee JE, Choi SH. Metabolic syndrome prediction using machine learning models with genetic and clinical information from a nonobese healthy population. Genomics Inform 2018;16:e31.
- 27. Kim J, Mun S, Lee S, Jeong K, Baek Y. Prediction of metabolic and pre-metabolic syndromes using machine learning models with anthropometric, lifestyle, and biochemical factors from a middle-aged population in Korea. BMC Public Health 2022;22:664.
- 28. Kweon S, Kim Y, Jang MJ, Kim Y, Kim K, Choi S, Chun C, Khang YH, Oh K. Data resource profile: the Korea National Health and Nutrition Examination Survey (KNHANES). Int J Epidemiol 2014;43:69-77.
- 29. Korea Disease Control and Prevention Agency. Survey contents South Korea [Internet]. 2022. cited 2022 January 3. Available from https://knhanes.cdc.go.kr/knhanes/sub02/sub02_03.do#s8_04
- 30. Korea Disease Control and Prevention Agency. Findings from Korea National Health and Nutrition Examination Survey [Internet]. 2018. cited 2021 June 1. Available from https://knhanes.cdc.go.kr/knhanes/sub01/sub01_05.do#s5_02
- 31. Kim J, Kim Y, Ahn YO, Paik HY, Ahn Y, Tokudome Y, Hamajima N, Inoue M, Tajima K. Development of a food frequency questionnaire in Koreans. Asia Pac J Clin Nutr 2003;12:243-250.
- 32. Kim DW, Song S, Lee JE, Oh K, Shim J, Kweon S, Paik HY, Joung H. Reproducibility and validity of an FFQ developed for the Korea National Health and Nutrition Examination Survey (KNHANES). Public Health Nutr 2015;18:1369-1377.
- 33. Nguyen N, Cripps A. Predicting housing value: a comparison of multiple regression analysis and artificial neural networks. J Real Estate Res 2001;22:313-336.
- 34. Lee SH, Tao S, Kim HS. The prevalence of metabolic syndrome and its related risk complications among Koreans. Nutrients 2019;11:1755.
- 35. Grundy SM, Cleeman JI, Daniels SR, Donato KA, Eckel RH, Franklin BA, Gordon DJ, Krauss RM, Savage PJ, Smith SC Jr, Spertus JA, Costa F. American Heart Association. National Heart, Lung, and Blood Institute. Diagnosis and management of the metabolic syndrome: an American Heart Association/National Heart, Lung, and Blood Institute Scientific Statement. Circulation 2005;112:2735-2752.
- 36. Enkhmaa B, Shiwaku K, Anuurad E, Nogi A, Kitajima K, Yamasaki M, Oyunsuren T, Yamane Y. Prevalence of the metabolic syndrome using the Third Report of the National Cholesterol Educational Program Expert Panel on Detection, Evaluation, and Treatment of High Blood Cholesterol in Adults (ATP III) and the modified ATP III definitions for Japanese and Mongolians. Clin Chim Acta 2005;352:105-113.
- 37. Alberti KG, Zimmet PZ. Definition, diagnosis and classification of diabetes mellitus and its complications. Part 1: diagnosis and classification of diabetes mellitus provisional report of a WHO consultation. Diabet Med 1998;15:539-553.
- 38. Korean Society for the Study of Obesity. Guideline for the management of obesity 2018. Seoul: Korean Society for the Study of Obesity; 2018.
- 39. Qasim A, Turcotte M, de Souza RJ, Samaan MC, Champredon D, Dushoff J, Speakman JR, Meyre D. On the origin of obesity: identifying the biological, environmental and cultural drivers of genetic risk among human populations. Obes Rev 2018;19:121-149.
- 40. Yu CS, Lin YJ, Lin CH, Wang ST, Lin SY, Lin SH, Wu JL, Chang SS. Predicting metabolic syndrome with machine learning models using a decision tree algorithm: retrospective cohort study. JMIR Med Inform 2020;8:e17110.
- 41. Worachartcheewan A, Shoombuatong W, Pidetcha P, Nopnithipat W, Prachayasittikul V, Nantasenamat C. Predicting metabolic syndrome using the random forest method. Sci World J 2015;2015:581501.
- 42. Park JE, Mun S, Lee S. Metabolic syndrome prediction models using machine learning and Sasang constitution type. Evid Based Complement Alternat Med 2021;2021:8315047.
- 43. Hanley AJ, Williams K, Festa A, Wagenknecht LE, D’Agostino RB Jr, Haffner SM. Liver markers and development of the metabolic syndrome: the insulin resistance atherosclerosis study. Diabetes 2005;54:3140-3147.
- 44. Lonardo A, Ballestri S, Marchesini G, Angulo P, Loria P. Nonalcoholic fatty liver disease: a precursor of the metabolic syndrome. Dig Liver Dis 2015;47:181-190.
- 45. Bozzetto L, Prinster A, Annuzzi G, Costagliola L, Mangione A, Vitelli A, Mazzarella R, Longobardo M, Mancini M, Vigorito C, Riccardi G, Rivellese AA. Liver fat is reduced by an isoenergetic MUFA diet in a controlled randomized study in type 2 diabetic patients. Diabetes Care 2012;35:1429-1435.
- 46. Phelan S, Wadden TA, Berkowitz RI, Sarwer DB, Womble LG, Cato RK, Rothman R. Impact of weight loss on the metabolic syndrome. Int J Obes 2007;31:1442-1448.
- 47. Finucane OM, Lyons CL, Murphy AM, Reynolds CM, Klinger R, Healy NP, Cooke AA, Coll RC, McAllan L, Nilaweera KN, O’Reilly ME, Tierney AC, Morine MJ, Alcala-Diaz JF, Lopez-Miranda J, O’Connor DP, O’Neill LA, McGillicuddy FC, Roche HM. Monounsaturated fatty acid-enriched high-fat diets impede adipose NLRP3 inflammasome-mediated IL-1β secretion and insulin resistance despite obesity. Diabetes 2015;64:2116-2128.
- 48. Lee TC, Ivester P, Hester AG, Sergeant S, Case LD, Morgan T, Kouba EO, Chilton FH. The impact of polyunsaturated fatty acid-based dietary supplements on disease biomarkers in a metabolic syndrome/diabetes population. Lipids Health Dis 2014;13:196.
- 49. Julibert A, Bibiloni MD, Tur JA. Dietary fat intake and metabolic syndrome in adults: a systematic review. Nutr Metab Cardiovasc Dis 2019;29:887-905.
- 50. Hooper L, Martin N, Jimoh OF, Kirk C, Foster E, Abdelhamid AS. Reduction in saturated fat intake for cardiovascular disease. Cochrane Database Syst Rev 2020;5:CD011737.
- 51. Sellem L, Flourakis M, Jackson KG, Joris PJ, Lumley J, Lohner S, Mensink RP, Soedamah-Muthu SS, Lovegrove JA. Impact of replacement of individual dietary sfas on circulating lipids and other biomarkers of cardiometabolic health: a systematic review and meta-analysis of randomized controlled trials in humans. Adv Nutr 2022;13:1200-1225.
- 52. Siri-Tarino PW, Sun Q, Hu FB, Krauss RM. Saturated fatty acids and risk of coronary heart disease: modulation by replacement nutrients. Curr Atheroscler Rep 2010;12:384-390.
- 53. Mozaffarian D, Micha R, Wallace S. Effects on coronary heart disease of increasing polyunsaturated fat in place of saturated fat: a systematic review and meta-analysis of randomized controlled trials. PLoS Med 2010;7:e1000252.
- 54. Jang H, Park K. Omega-3 and omega-6 polyunsaturated fatty acids and metabolic syndrome: a systematic review and meta-analysis. Clin Nutr 2020;39:765-773.
- 55. Kothawade PB, Thomas AB, Chitlange SS. Novel niacin receptor agonists: a promising strategy for the treatment of dyslipidemia. Mini Rev Med Chem 2021;21:2481-2496.
- 56. Boden WE, Sidhu MS, Toth PP. The therapeutic role of niacin in dyslipidemia management. J Cardiovasc Pharmacol Ther 2014;19:141-158.
- 57. Kim SW, Kim HJ, Min K, Lee H, Lee SH, Kim S, Kim JS, Oh B. The relationship between smoking cigarettes and metabolic syndrome: a cross-sectional study with non-single residents of Seoul under 40 years old. PLoS One 2021;16:e0256257.
- 58. Kim T, Kang J. Association between serum retinol and α-tocopherol levels and metabolic syndrome in Korean general population: analysis of population-based nationally representative data. Nutrients 2020;12:1689.


